Goal Seek is a powerful tool in Microsoft Excel It is available in the “what-if analysis” option. It allows users to find the input value required to achieve a desired output value. In other words, it can be used to determine what value a specific cell needs to be to reach a particular goal. This can be especially useful for financial analysis, where users may need to calculate the impact of changes to variables such as price or quantity sold on a company’s profit.
Preparing the Worksheet:
Let’s consider the following data for our example:
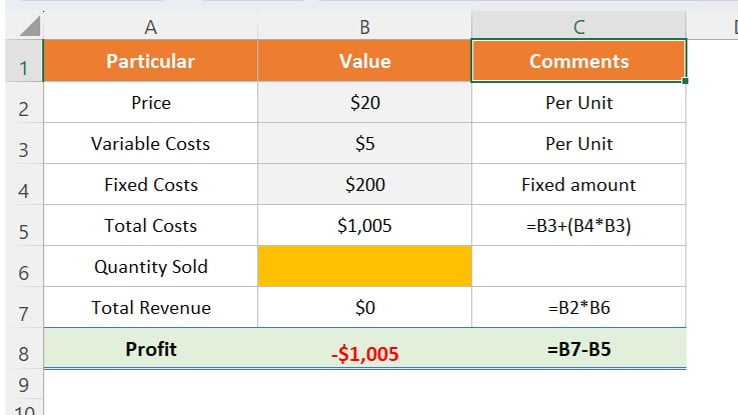
This is a financial data table with three columns and eight rows. The first row is a header row that indicates the meaning of the values in the columns.
- The first column is “Particular,” in which we are capturing the name of the financial metrics.
- The second column is “Value,” which contains the numerical values of the metrics.
- The third column is “Comments,” which provides additional information or details about the metric.
- In the second row, “Price” is the price per unit, which is $20.
- In the third row, “Variable Costs” are the costs associated with producing a single unit, which is $5.
- In the fourth row, “Fixed Costs” are the costs that do not vary with the number of units produced, which is a fixed amount of $200.
- In the fifth row, “Total Costs” represent the sum of Fixed Costs and the product of Quantity Sold and Variable Costs, which is $1,005, as indicated by the formula in the Comments column.
- In the sixth row, “Quantity Sold” is the number of units sold, which is blank. We will fill it below in the tutorial.
- In the seventh row, “Total Revenue” is the product of Price and Quantity Sold, which is $0, as indicated by the formula in the Comments column.
- In the eighth row, “Profit” is the difference between Total Revenue and Total Costs, which is -$1005, as indicated by the formula in the Comments column.
Using Goal Seek:
Our goal is to achieve a profit of $5,000 by changing the Quantity Sold. To do this, we can use Goal Seek to determine the necessary quantity that will result in our desired profit.
Setting Up Goal Seek:
- Select the cell containing the output value you want to achieve, in this case, cell B8 (Profit).
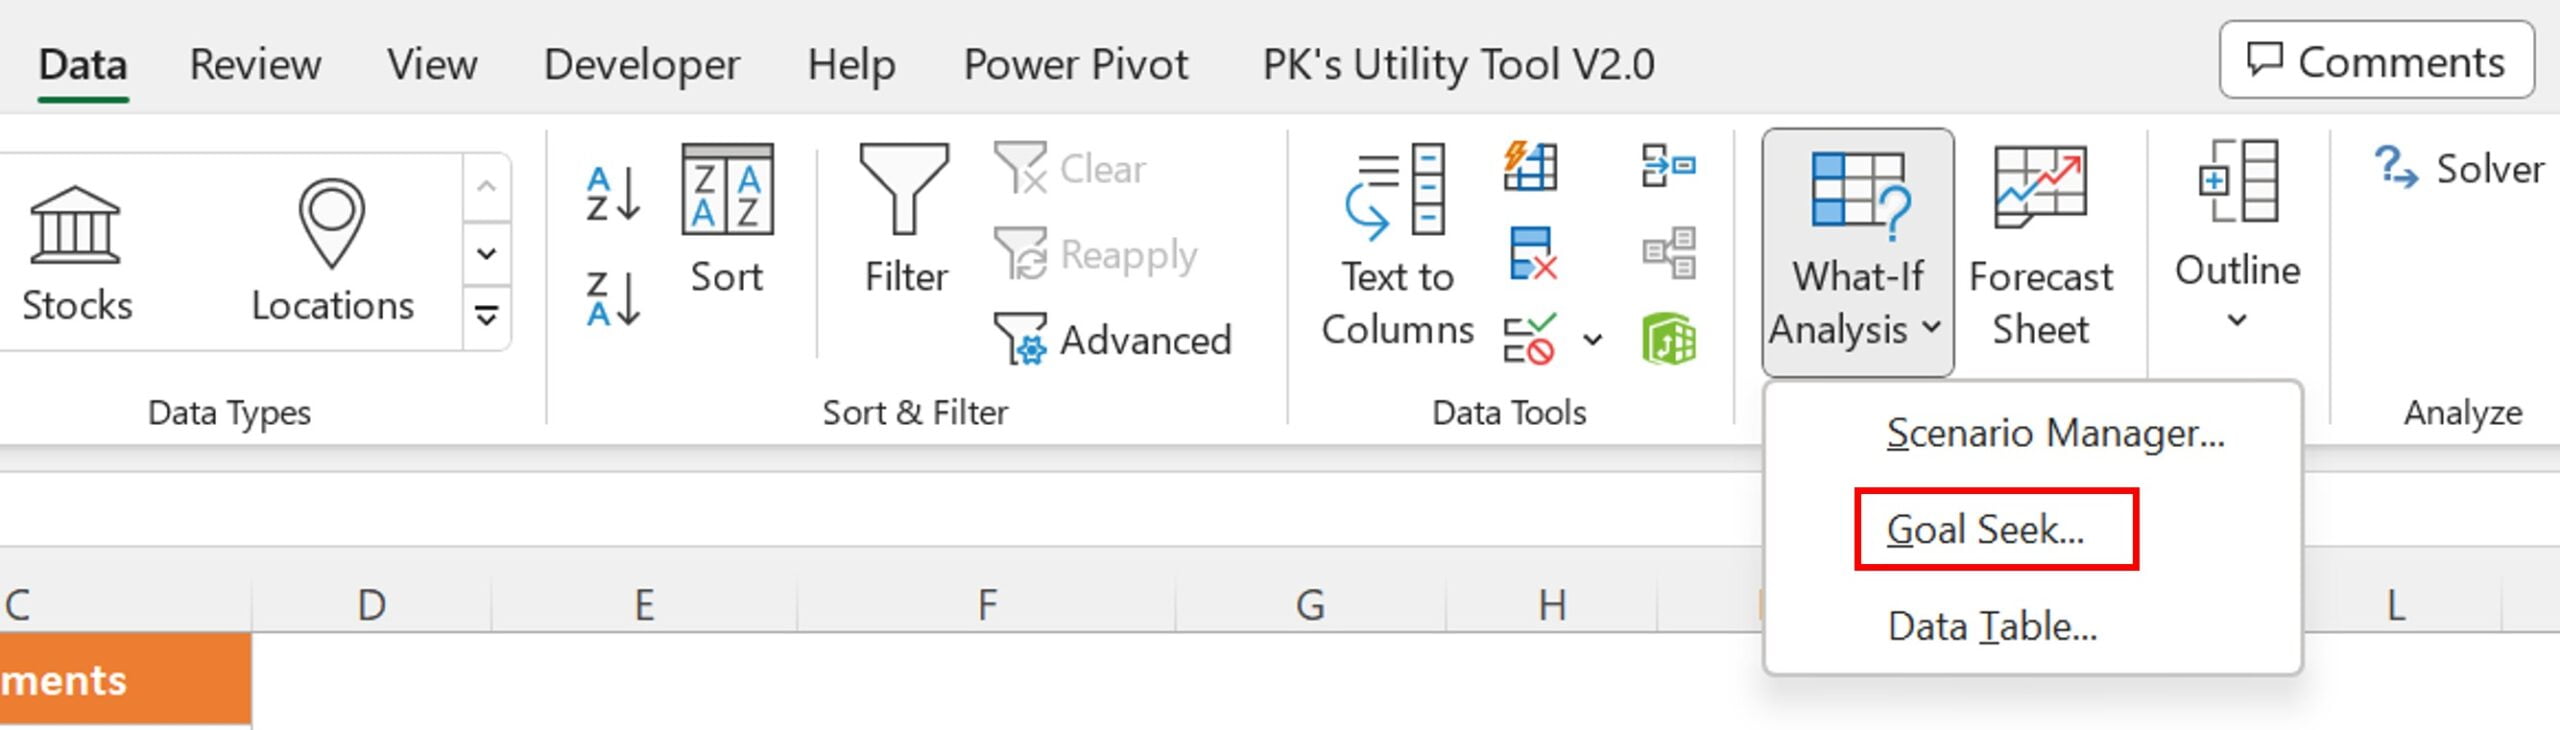
- Navigate to the “Data” tab on the Excel ribbon and click on the “What-If Analysis” button.
- Select “Goal Seek” from the dropdown menu.
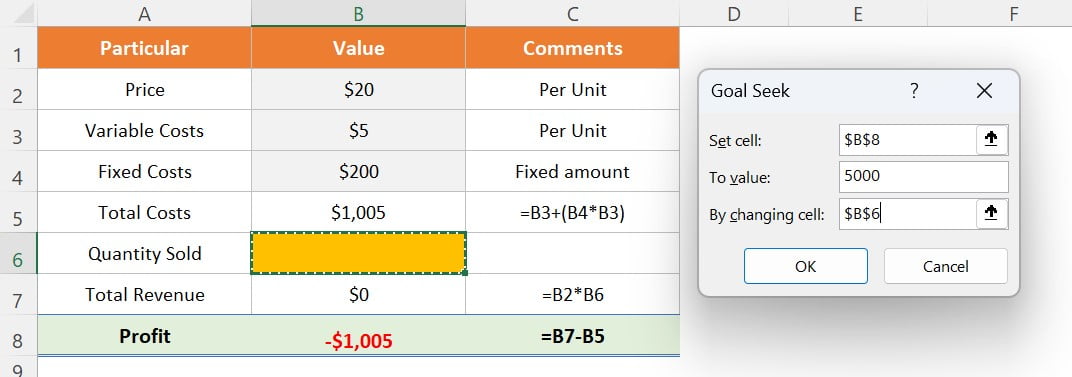
- In the Goal Seek dialog box, set the “Set cell” to B8 (Profit).
- The “To value” to $5000, and the “By changing cell” to B6 (Quantity Sold).
- Click “OK” to run Goal Seek.
Running Goal Seek:
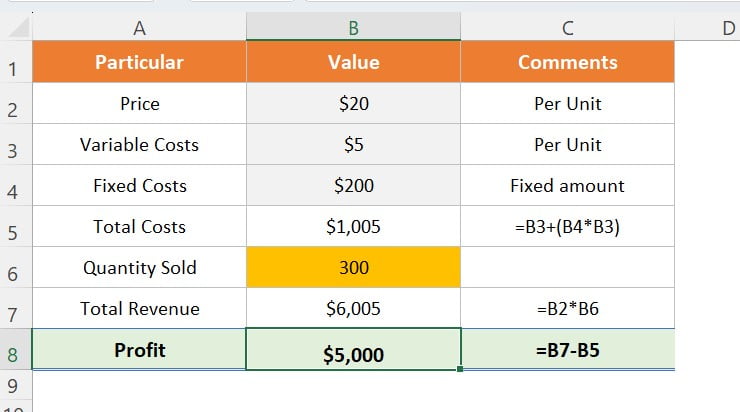
After setting up Goal Seek as described above, click “OK” to run it. Excel will automatically determine the necessary value for Quantity Sold those results in a profit of $5,000.
Viewing the Results:
Once Goal Seek has completed running, Excel will display a message indicating whether it was successful in finding a solution or not. If a solution was found, Excel will change the value in the “By changing cell” to the necessary input value to achieve the desired output value.
Conclusion:
In conclusion, Goal Seek is a powerful tool in Microsoft Excel that can save time and improve accuracy by quickly determining the necessary input value to achieve a desired output value. It is especially useful in financial analysis, where users may need to calculate the impact of changes to variables such as price or quantity sold on a company’s profit. To use Goal Seek effectively, it is important to set up the inputs and outputs correctly, and to understand the limitations of the tool. With these considerations in mind, Goal Seek can be a valuable addition to any Excel user’s toolkit.