Home>Blogs>Power Pivot>Power Gantt Chart (Project Planner) for Project Management
Power Gantt Chart
Power Pivot Charts and Visualization Templates

Power Gantt Chart (Project Planner) for Project Management

In the article, we have created the Power Gantt Chart (Project Planner) for Project Management in Microsoft Excel with Power Pivot. You can use this template for your Project Management Dashboard.

Download our Project Management Dashboard.

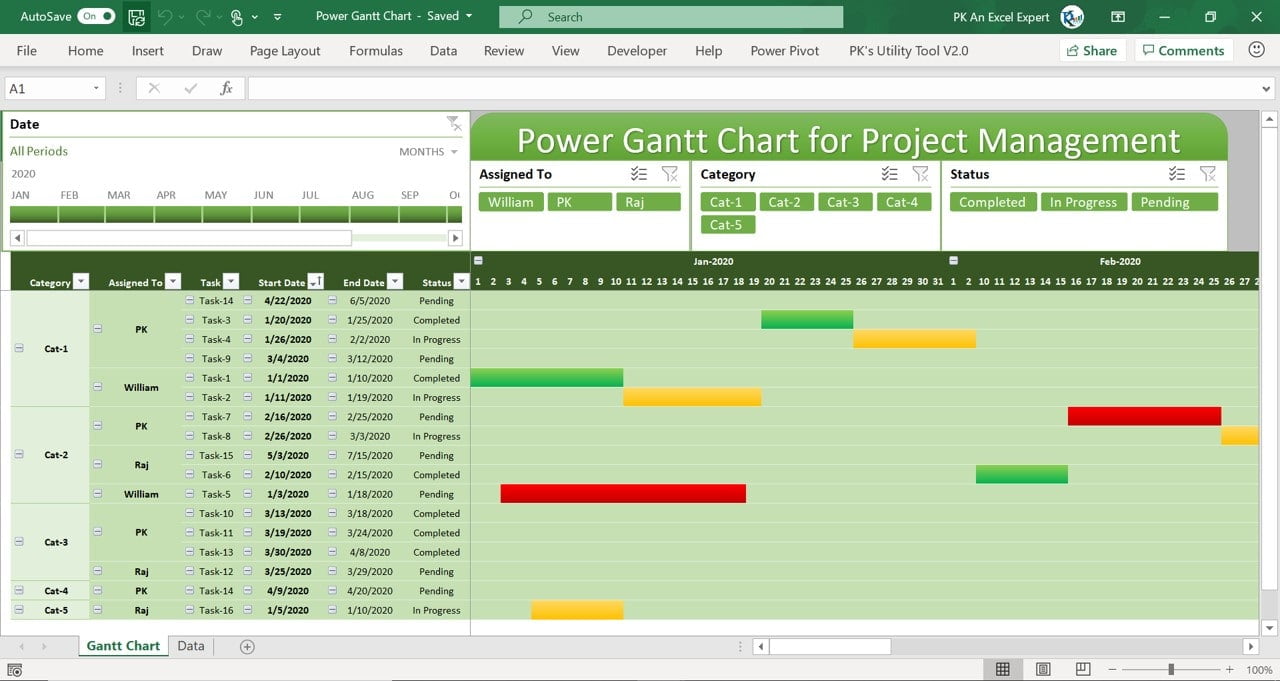
Power Gantt Chart Snapshot

This is a dynamic Gantt Chart which can be controlled by different slicers and Timeline.

Power Gantt Chart

or

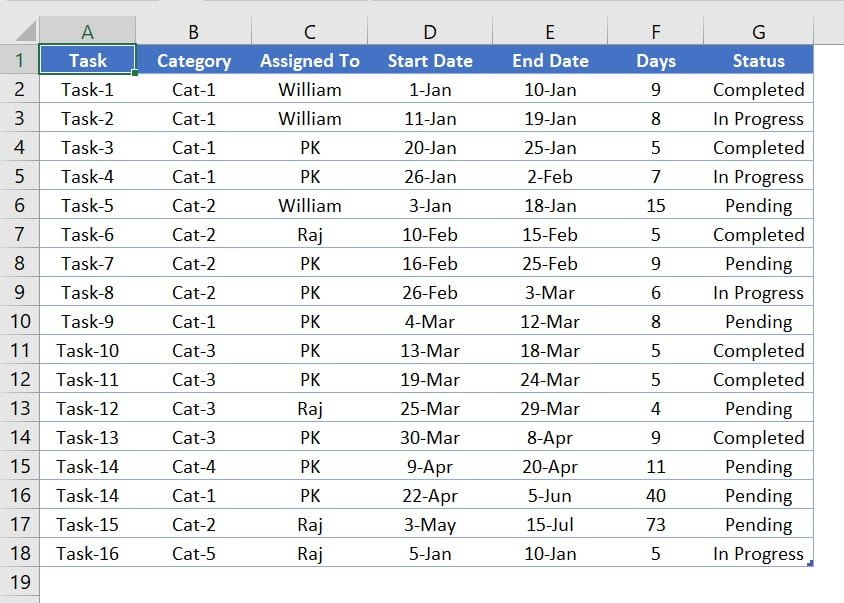
Power Gantt Chart, You can fill your data in Data sheet and then just refresh the Gantt Chart Pivot table.

Input Data
Input Data


Visit our YouTube channel to learn step-by-step video tutorials

Youtube.com/@PKAnExcelExpert

Watch the step by step video tutorial:

or


PK
Meet PK, the founder of PK-AnExcelExpert.com! With over 15 years of experience in Data Visualization, Excel Automation, and dashboard creation. PK is a Microsoft Certified Professional who has a passion for all things in Excel. PK loves to explore new and innovative ways to use Excel and is always eager to share his knowledge with others. With an eye for detail and a commitment to excellence, PK has become a go-to expert in the world of Excel. Whether you're looking to create stunning visualizations or streamline your workflow with automation, PK has the skills and expertise to help you succeed. Join the many satisfied clients who have benefited from PK's services and see how he can take your Excel skills to the next level!
https://www.pk-anexcelexpert.com