What is a Scenario Manager in What-if Analysis?
Scenario Manager in Excel helps you analyze how changing input variables affects formula outcomes. It’s a powerful What-If Analysis tool for modelling scenarios to make informed decisions.
Overview of the tutorial and its purpose:
This tutorial is a step-by-step guide to using Scenario Manager in Excel. You’ll learn to create and modify scenarios, view, and analyze results, generate summary reports. We’ll walk you through setting up a worksheet for scenario analysis.
Setting up a Worksheet for Scenario Analysis
A. Explanation of the example data set:
Let’s consider an example data set which will help us understand how to use Scenario Manager in Excel. We have a sales model with input variables such as Price and Qty, and output variables such as Total Revenue and Profit.
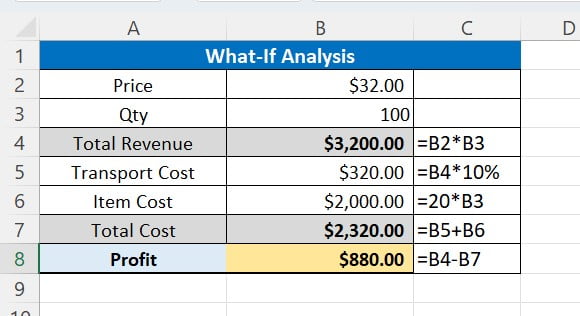
Column A contains the names of the input and output variables, column B contains their values, and column C contains the formulas used to calculate the output variables based on the input values.
B. Tips for formatting data for scenario analysis:
When setting up a worksheet for scenario analysis, it’s important to format the data correctly.
Below are the few tips to format the data for scenario analysis:
Use proper labels for input cells:
Use descriptive labels for input cells, so it should be clear what values they represent. For example, “Price” and “Qty” are clear labels that make it easy to understand the data.
Arrange input cells in a logical order:
Arrange input cells in a logical order that makes sense for the model. For example, you might put Price and Qty next to each other since they’re both input variables for Total Revenue.
Use cell references in formulas:
Use cell references in formulas to easily modify input values. For example, in the example data set, we used B2 and B3 to represent Price and Qty in the formula for Total Revenue.
Create Named Range
Let’s create named ranges for input and output variables in this Excel example. We’ll use “Qty” as an input variable and “Profit” as an output variable. Follow the steps below to create the named ranges:
- Go to the “Formula” tab in the Excel ribbon.
- Click on “Name Manager.”
- Click on the “New” button on the top left.
- In the “New Name” window that appears, put the name as “Qty.”
- In the “Refers to” field, put “=Sheet1!$B$3.”
- Click on “OK.”
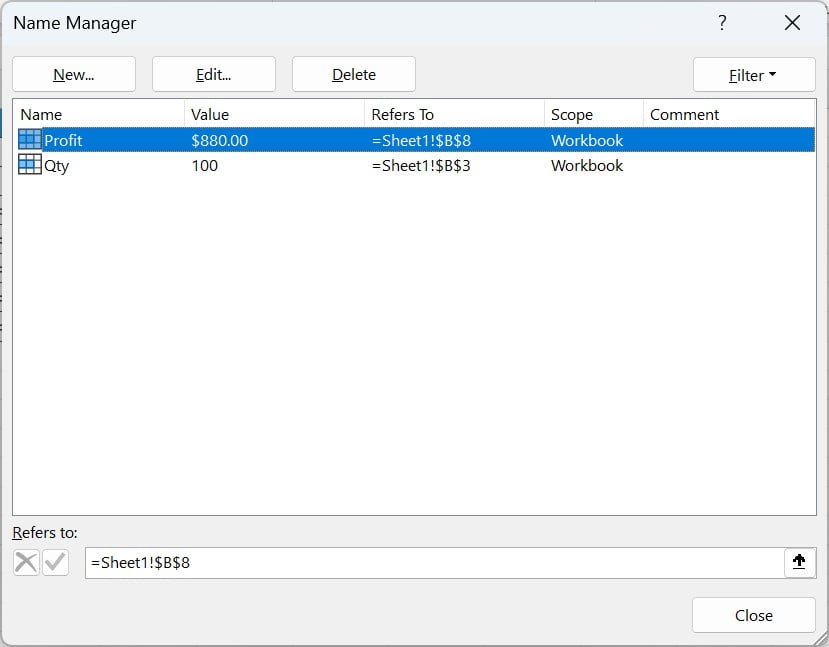
Follow the same steps to create the “Profit” named range.
Now, let’s create the scenarios by changing the value of “Qty.” Here’s how:
- Open the Scenario Manager. It will look like the image shown below.
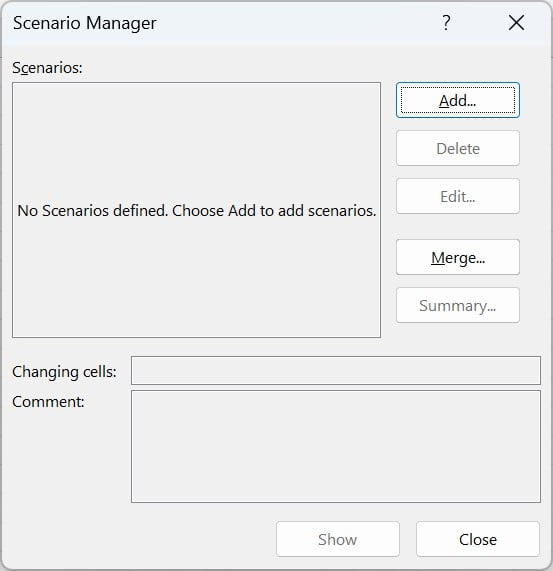
- Click on the “Add” button to create a new scenario.
- The “Add Scenario” window will be displayed.
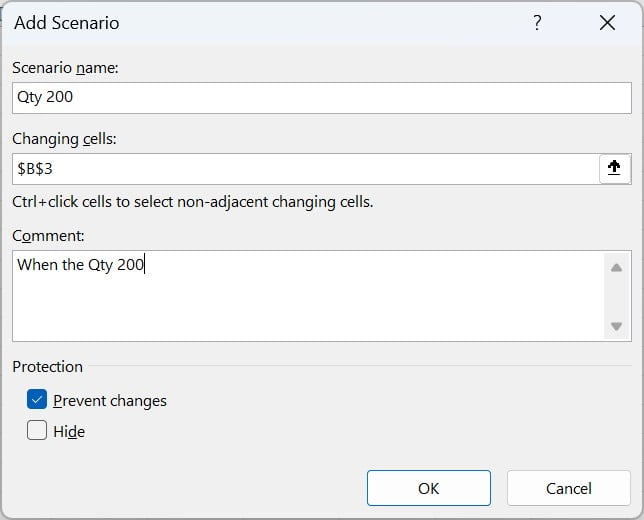
- Fill in the information as given in the image above and click on “OK.”
- Now, a new “Scenario Values” window will open. Put the Qty as 200 here.
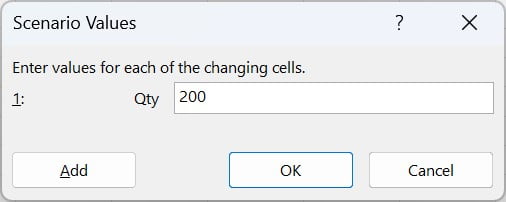
- Click on “OK.”
- Add more scenarios as you want using the same steps.
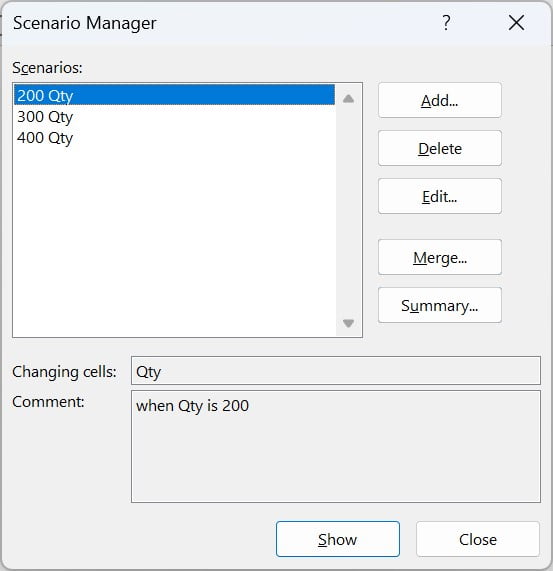
Here, we have added 3 scenarios with 300, 400, and 500 Qty to see the impact on Profit.
- Click on the “Summary” button. It will open the window shown below.
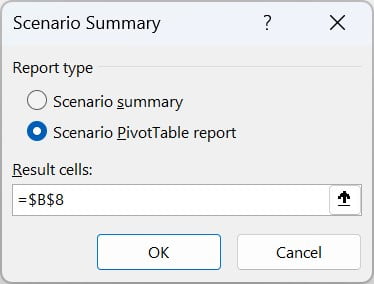
- Summary Scenario window
- Select the “Scenario summary” radio button in the “Report type.”
- Select the B8 in the box, which is the Profit value.
- Click on “OK.”
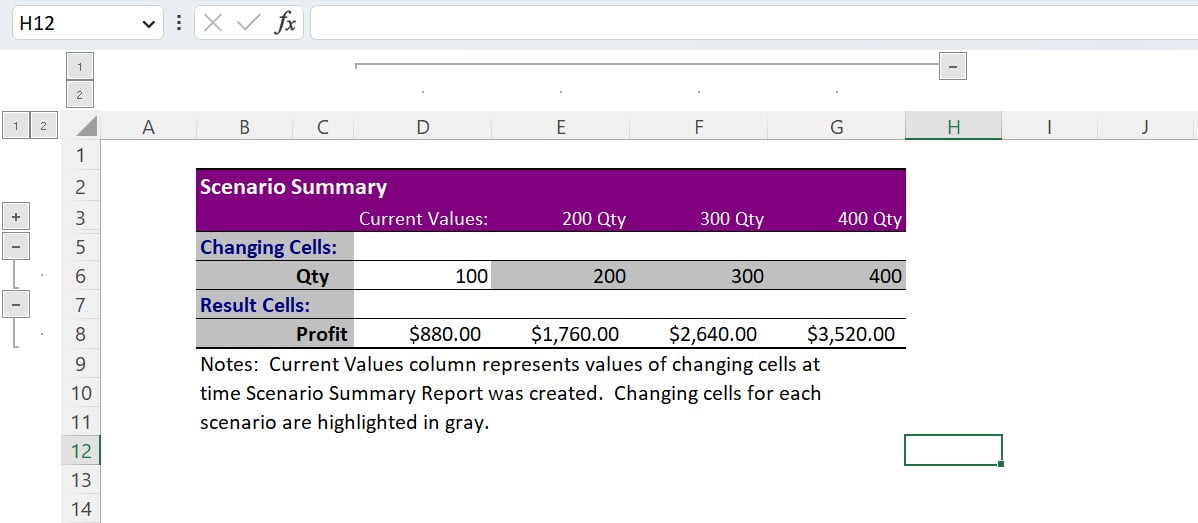
It will create a new worksheet named “Scenario Summary.”
The Scenario Summary report
The Scenario Summary report provides a useful way to analyze the potential outcomes of different scenarios based on various input variables. Once you have created and saved multiple scenarios, you can use the Scenario Summary report to compare the results of each scenario side-by-side. Here are some steps on how to read a Scenario Summary in Excel:
Understand the layout:
When you open the Scenario Summary report, you’ll see a table with rows and columns. The leftmost column lists the changing cells that were defined in each scenario, and the top row displays the scenario names.
Look for the outcome you’re interested in:
The table will display the values of each output cell for each scenario. In other words, it shows the impact of each scenario on the output cells. Look for the cell or cells that you’re interested in analyzing. For example, if you’re trying to maximize profits, look for the Profit cell.
Analyze the results:
Once you’ve identified the cell or cells you’re interested in, compare the values across the different scenarios. The Scenario Summary report makes it easy to see immediately which scenario produces the best outcome for a given cell.
Use the report to make informed decisions:
The Scenario Summary report provides a valuable tool for making informed decisions based on the potential outcomes of different scenarios. Use the information in the report to select the scenario that best meets your goals and constraints.