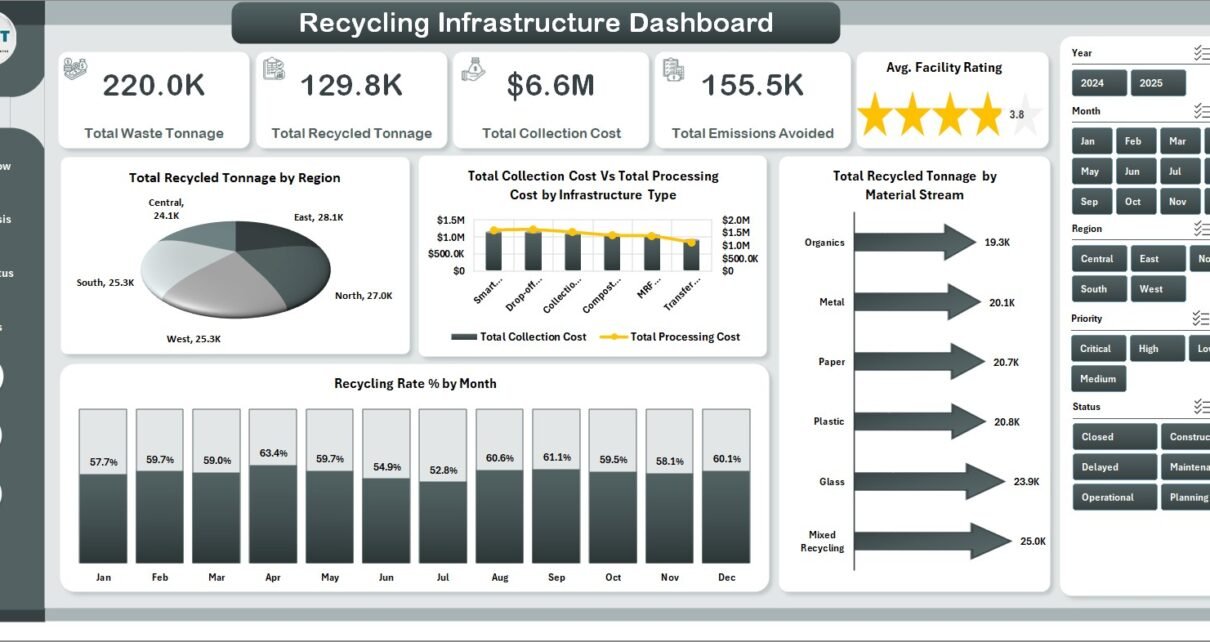
PKComments Off on KANBAN Board with Power Pivot and VBA for Project Management
In today's fast-paced business environment, effective project management is essential for achieving success. One tool that has gained significant popularity in recent years is the KANBAN board. In this comprehensive
PKComments Off on One Pager KPI dashboard in Excel
Excel is a widely used tool for businesses and individuals for data analysis, tracking, and visualization. Excel Dashboard is an effective way to present complex data in a simplified manner,
In this article, we have created a Daily Sales Dashboard to analyze the Daily Sales trends. We have displayed 4 metrics in this dashboard- # Of Calls: The number of
PKComments Off on Annual Sales Calendar for Sales Dashboard in Excel
In this article, we have created an Annual Sales Calendar for Sales Dashboard in Excel. You can use this Sales Calendar in your sales dashboard. We have used the Combo
PKComments Off on KPI Dashboard with Tooltip in Excel
In this article, we have created Chart Tooltip in KPI Dashboard in Microsoft Excel. You can use this trick to show the details of a number with the chart. We
PKComments Off on Comparative Analysis Dashboard in Excel
This is the Excel version of the Comparative Analysis Dashboard. We have used Power Pivot to create this dashboard. We have used Current Year Sales Vs Previous Year Same Period
PKComments Off on 3 Useful Tips for the Pivot Chart
In this article, you will learn 3 useful tips for Pivot Chart. Using these tips you can create an interactive Excel Dashboard. Learn and download interactive Excel Dashboard free of
PKComments Off on Excel Guide: Create a Dynamic Hourly Gantt Chart for Projects
Using Gantt charts for project management is not a new concept. Still, with the advent of advanced Excel features, creating a dynamic hourly Gantt chart has become more accessible than
PKComments Off on Comparative Analysis Dashboard in Power BI
In the article, we have created a Comparative Analysis Dashboard in Microsoft Power BI. In this dashboard, we have displayed a comparison of Current Year Sales with Previous Year sales
PKComments Off on Top/Bottom Analysis dashboard in Excel
In this article, we have created Top/Bottom Analysis dashboard using a sales dataset. This is a dynamic dashboard. We have used Slicers, Form control Option buttons and form control Scrollbar
This website uses cookies to improve your user experience, analyze site traffic and serve targeted ads in accordance with our Privacy PolicyACCEPT
Privacy & Cookies Policy
Privacy Overview
This website uses cookies to improve your experience while you navigate through the website. Out of these cookies, the cookies that are categorized as necessary are stored on your browser as they are essential for the working of basic functionalities of the website. We also use third-party cookies that help us analyze and understand how you use this website. These cookies will be stored in your browser only with your consent. You also have the option to opt-out of these cookies. But opting out of some of these cookies may have an effect on your browsing experience.
Necessary cookies are absolutely essential for the website to function properly. This category only includes cookies that ensures basic functionalities and security features of the website. These cookies do not store any personal information.
Any cookies that may not be particularly necessary for the website to function and is used specifically to collect user personal data via analytics, ads, other embedded contents are termed as non-necessary cookies. It is mandatory to procure user consent prior to running these cookies on your website.