In this article, you will learn 3 useful tips for the Pivot Chart. Using these tips you can create an interactive Excel Dashboard.
Learn and download interactive Excel Dashboard free of cost-
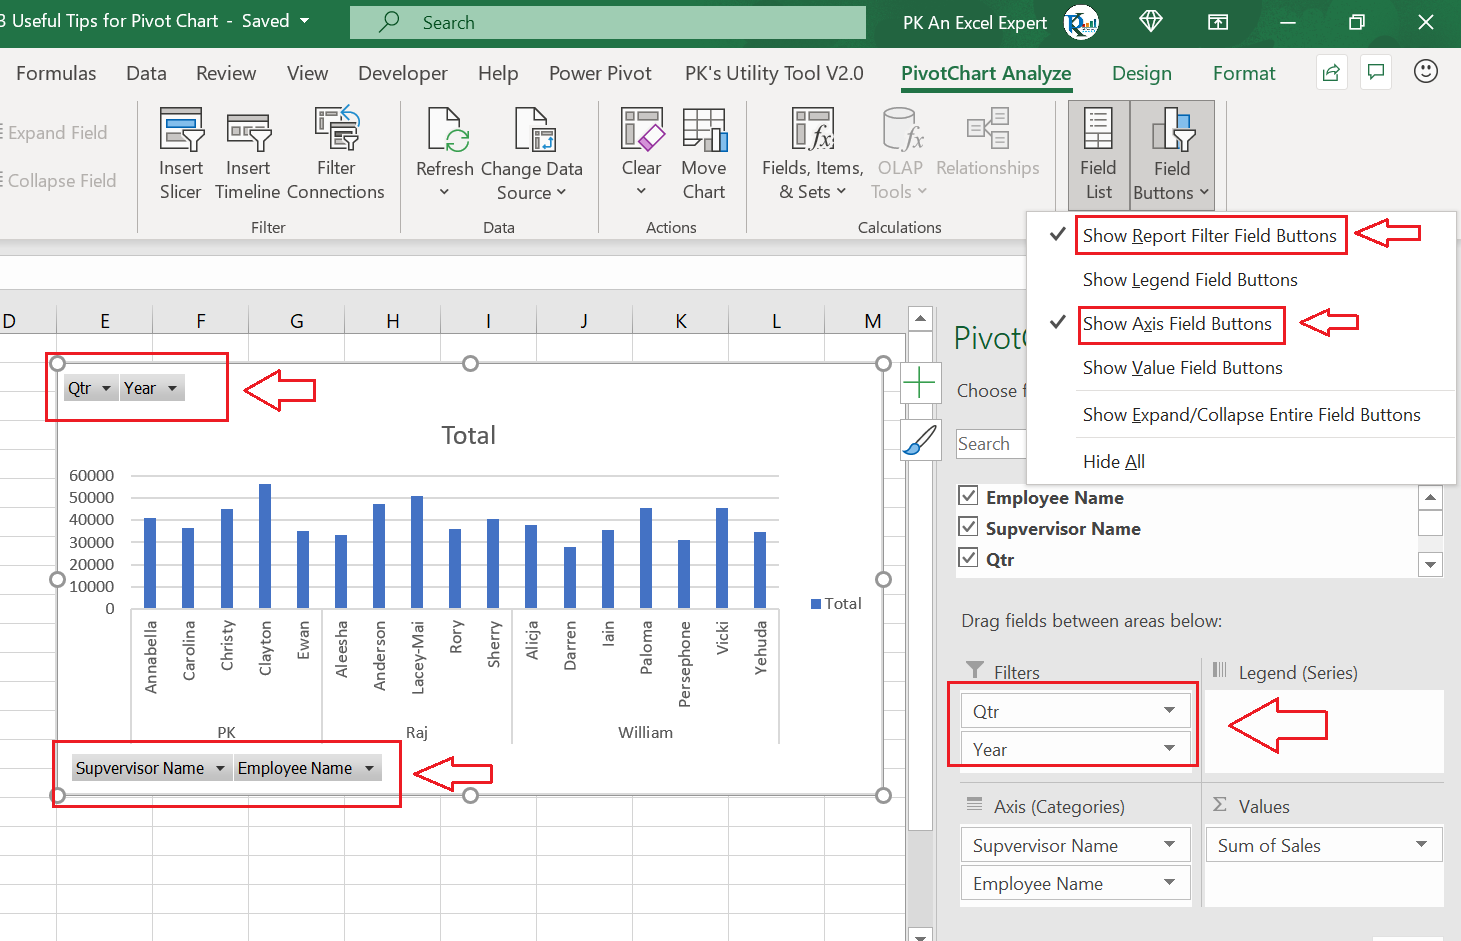
Add the fields in Axis and Values
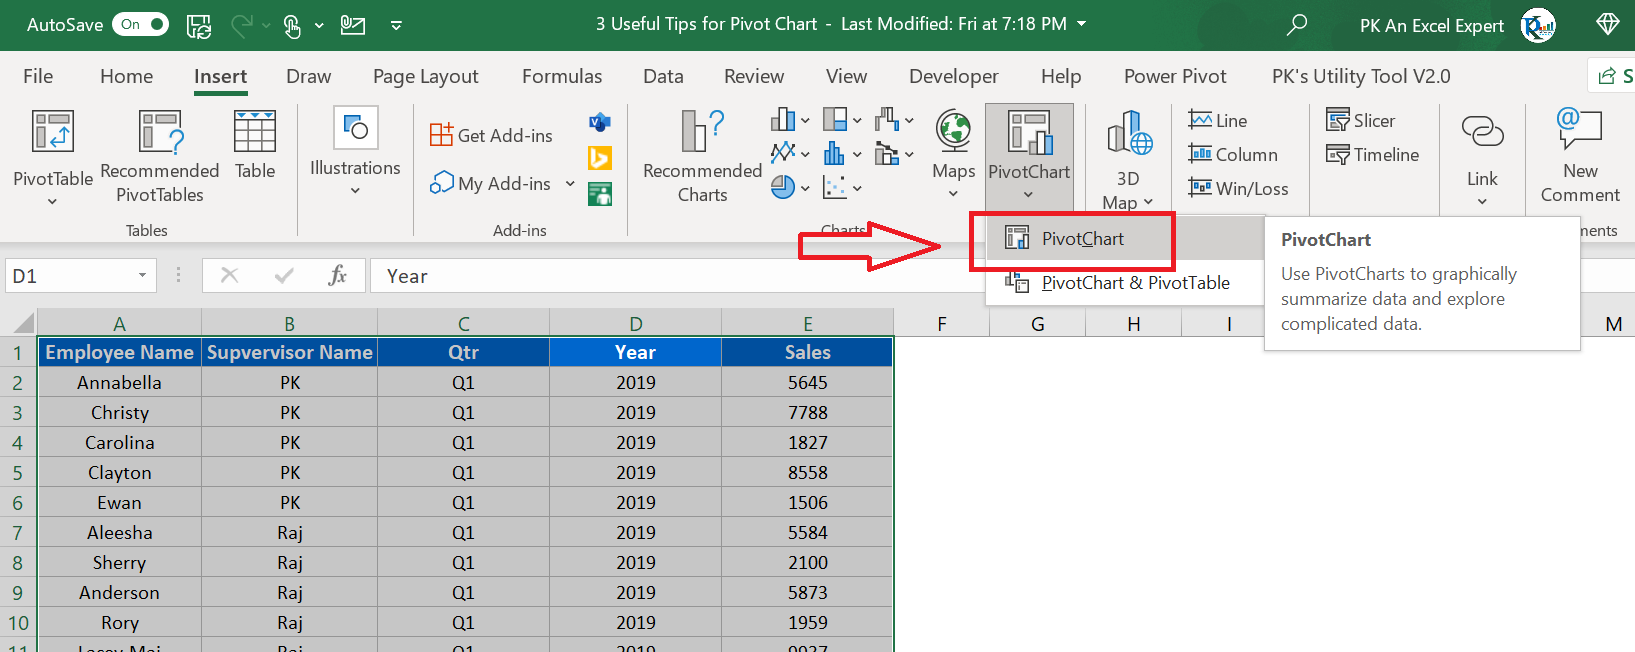
To add the Pivot Chart in Excel just select the data and go to chart Insert tab >> Pivot Chart. You can insert the pivot chart on the new worksheet or existing worksheet.
Click to buy 3 Useful Tips for the Pivot Chart
Add the fields in Axis and Values in Pivot chart-

Click to buy 3 Useful Tips for the Pivot Chart
Below is the list of useful Pivot Tips:
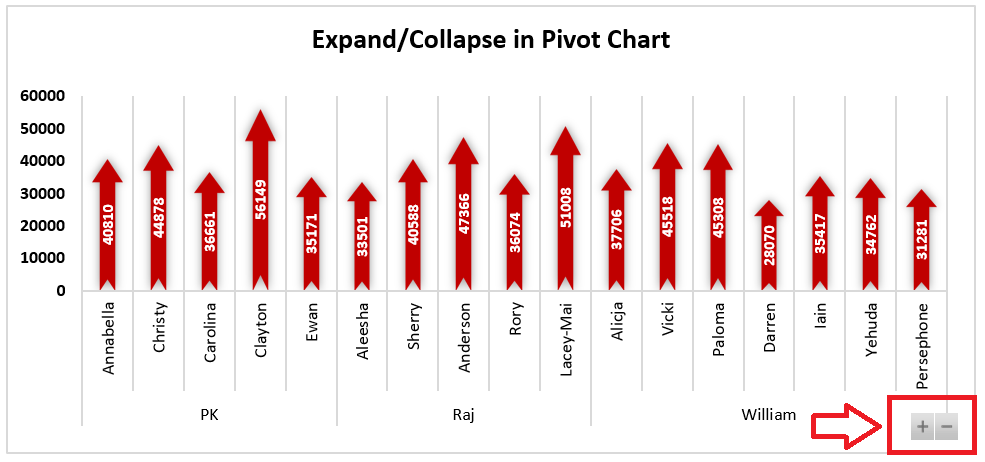
Tip #1: Add Expand/Collapse button on the Chart:
We can add a expand and collapse button on a Pivot chart so that we can expand the chart to the next level hierarchy.
For example- we can show the Agent and Supervisor wise chart or Year and Quarter-wise chart.
Click to buy 3 Useful Tips for the Pivot Chart
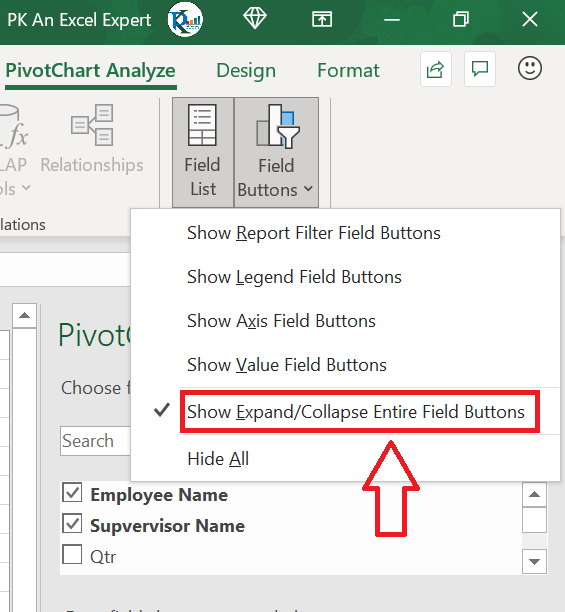
To add this expand/collapse button you can follow the below steps-
- Select the Pivot Chart and go to the PivotChart Analyze.
- Go to the Fields Buttons.
- Check the Expand/Collapse Entire Field Buttons
Click to buy 3 Useful Tips for the Pivot Chart
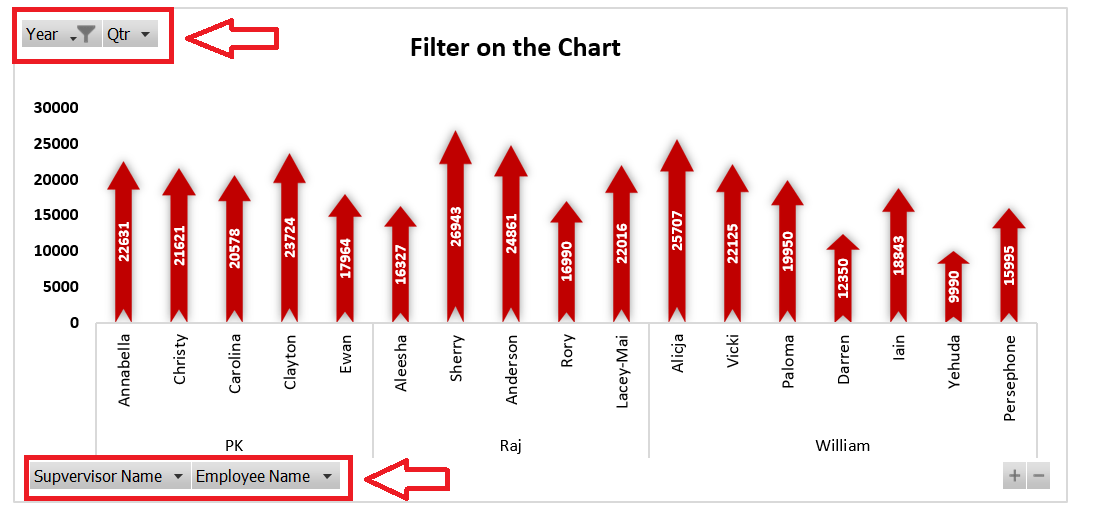
Tip #2: Add Filter Buttons on the chart
Filter buttons are useful to filter the data on the chart. These buttons can be available on the Chart.
Click to buy 3 Useful Tips for the Pivot Chart
- You can add the Filters box in Pivot Charts Fields
- In the Field Buttons, Check the Show Report Field Buttons
Click to buy 3 Useful Tips for the Pivot Chart
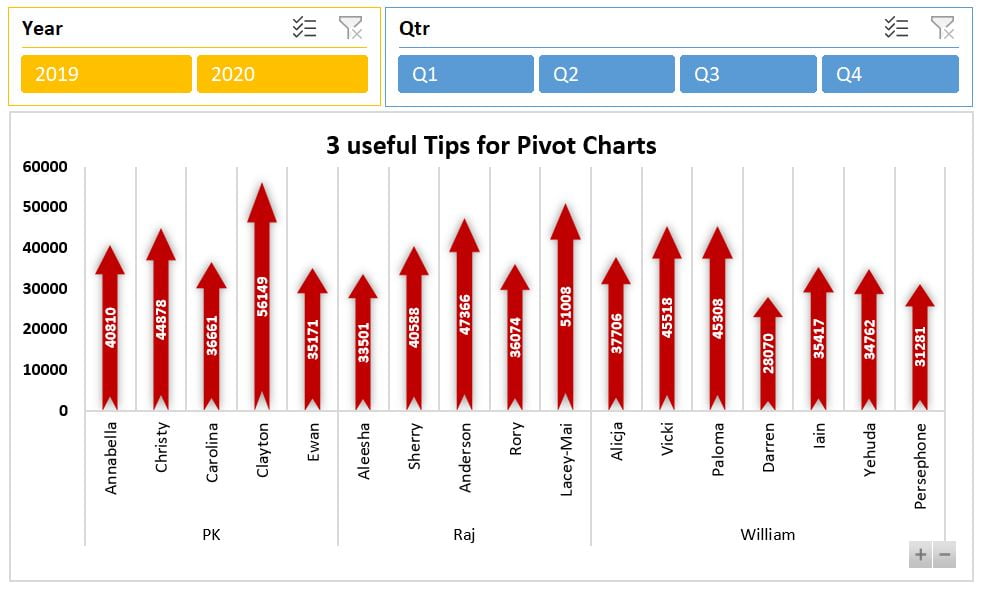
Tip #3: Connect with the Slicer
- Select the Pivot Chart and go to the PivotChart Analyze.
- Click on Insert Slicers
- Select the Field name in the Insert Slicers window.

Click to buy 3 Useful Tips for the Pivot Chart
Visit our YouTube channel to learn step-by-step video tutorials
Watch the step by step video tutorial:
Click to buy 3 Useful Tips for the Pivot Chart