New: NextGenTemplates Academy - video courses on Excel formulas with AI and Pivot Tables & dashboards. Early-bird: 20% off with code EARLYBIRD20 - first 20 orders only. See the courses →
  • Learn Excel (Free Course)
    • 1. Shortcut Keys
    • 2. Fill & Flash Fill
    • 3. Find & Replace
    • 4. Sort & Filter
    • 5. Formulas & Functions
    • 6. Data Validation
    • 7. Conditional Formatting
    • 8. Basic Charts
    • 9. Advanced Charts
    • 10. Pivot Tables
    • 11. Excel Dashboards
    • 12. VBA Course
    • 13. Excel Formulas with AI
  • Templates
  • Tutorials
    • Charts and Visualization
    • VBA
    • Excel Tips and Tricks
    • Excel Dashboards
    • Power Pivot & DAX
  • Power BI
  • Template Store
    • Ready to Use Templates
  • Courses
  • Academy
    • Excel + AI Mastery: 100 Formulas
    • Excel Pivot Tables & Dashboards
  • About Us
  • Contact Us

PK: An Excel Expert

Transforming Data into Decisions

Tag: Slicer

Dashboard Power BI

Circular Economy Startups Dashboard in Power BI

March 31, 2026March 31, 2026 PKComments Off on Circular Economy Startups Dashboard in Power BI
Circular Economy Startups Dashboard in Power BI is a professionally designed analytics template that helps sustainability-focused businesses, green investors, and circular economy advocates track, measure, and optimize startup performance across
Read More
Chart with Slicers in Excel
Charts and Visualization

Excel Magic: Connect Charts Slicers in Seconds

January 10, 2024March 2, 2025 PKComments Off on Excel Magic: Connect Charts Slicers in Seconds
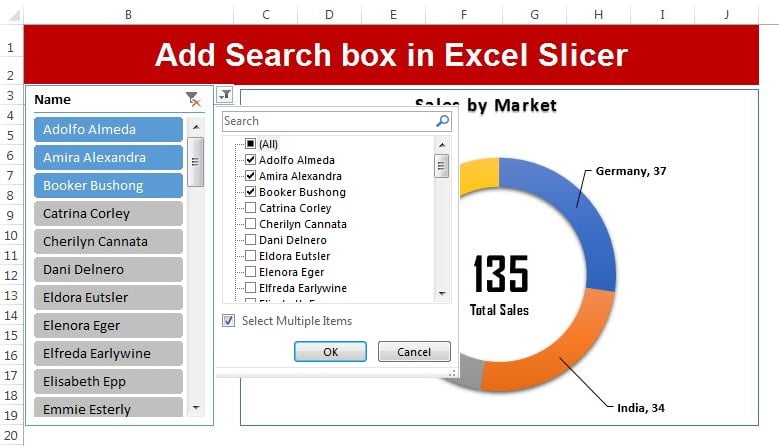
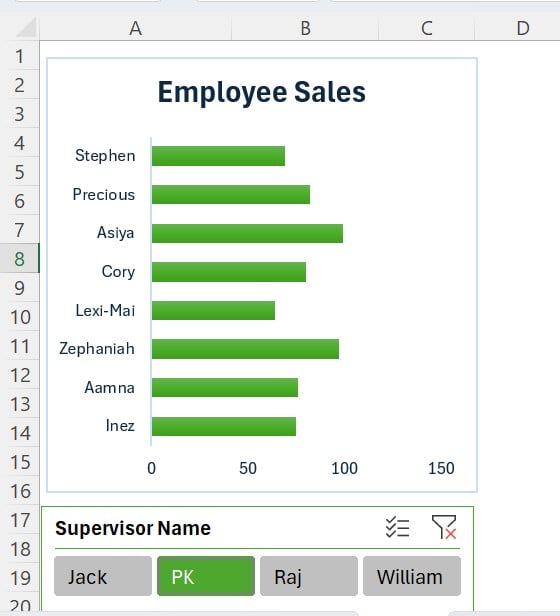
Welcome to our step-by-step guide on how to seamlessly connect charts slicers in Excel. This tutorial is perfect for anyone looking to add a bit of magic to their data visualization
Read More
Pivot Chart Tips
Charts and Visualization

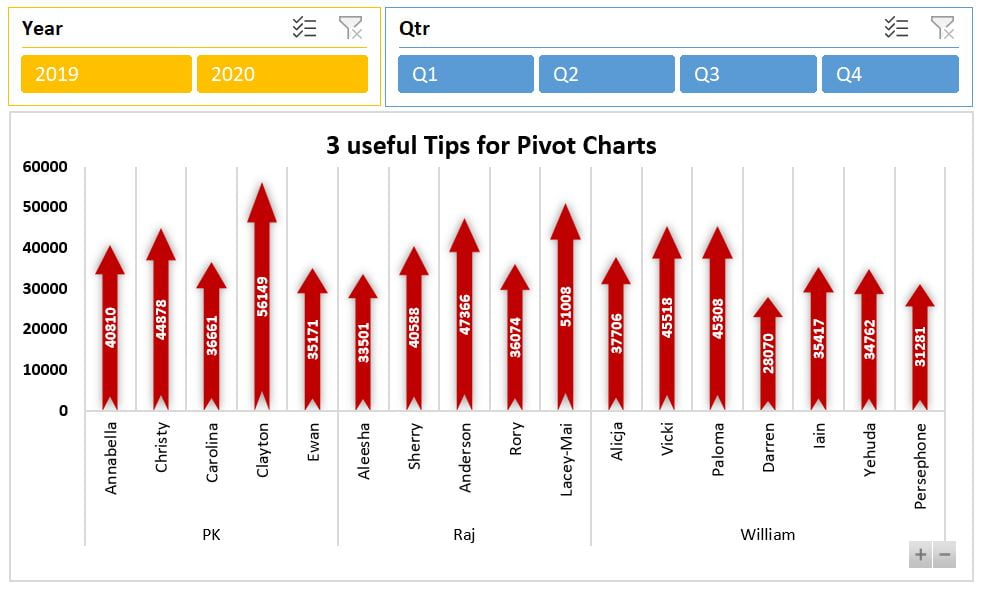
3 Useful Tips for the Pivot Chart

May 16, 2021March 5, 2025 PKComments Off on 3 Useful Tips for the Pivot Chart
In this article, you will learn 3 useful tips for the Pivot Chart. Using these tips you can create an interactive Excel Dashboard. Learn and download interactive Excel Dashboard free
Read More
Dynamic Comparison Analysis Chart
Charts and Visualization

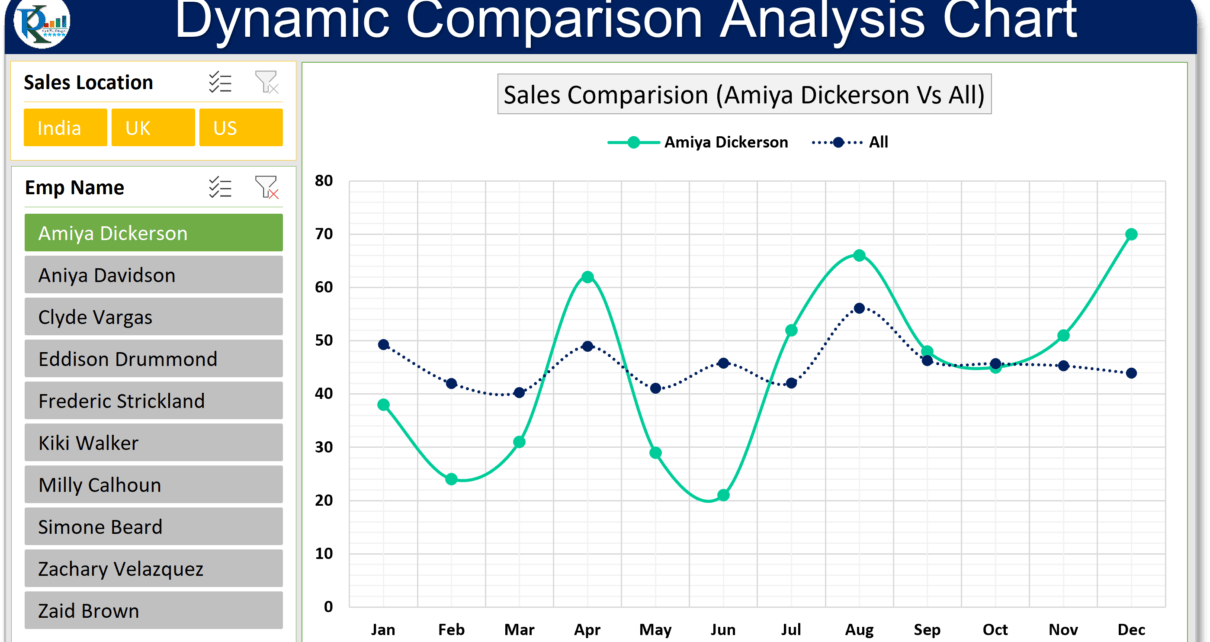
Dynamic Comparison Analysis Chart in Excel

May 3, 2021March 2, 2025 PKComments Off on Dynamic Comparison Analysis Chart in Excel
In this article, you will learn how to create a dynamic comparison Analysis Chart in Microsoft Excel. Using this chart you can compare one employee's performance with other all employees
Read More
Top-Bottom Analysis in Excel
Charts and Visualization Dashboard

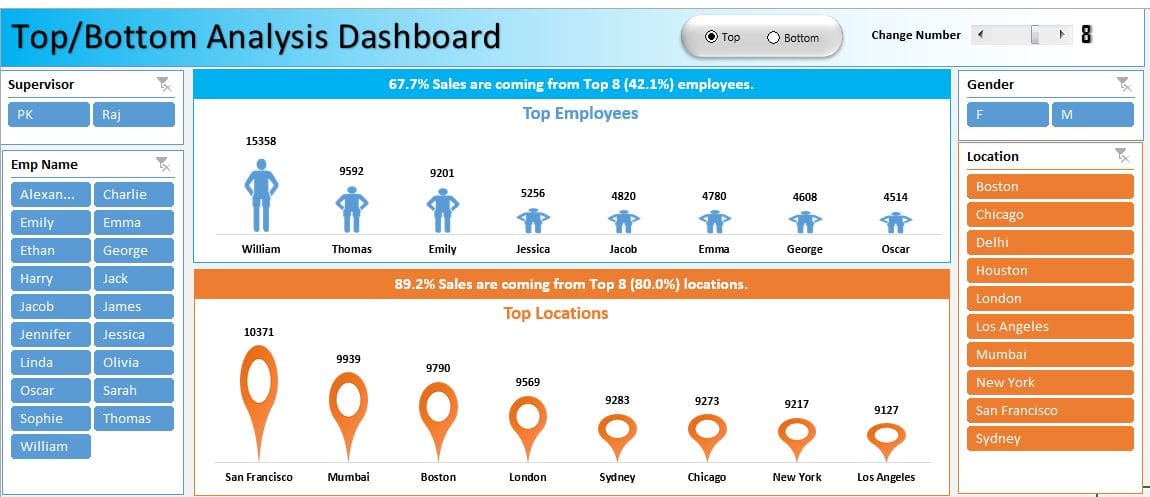
Top/Bottom Analysis dashboard in Excel

May 24, 2020September 19, 2026 PKComments Off on Top/Bottom Analysis dashboard in Excel
The Top/Bottom Analysis dashboard in Excel ranks employees and locations using a sample sales dataset. It combines slicers, Form Control option buttons and a scrollbar to change the ranking view
Read More
Pivot Table Super Tips
Excel Tips and Tricks

Pivot Table Super Tips in Excel

February 16, 2020October 7, 2024 PKComments Off on Pivot Table Super Tips in Excel
In this article, we have used two excel super tips for pivot table. You can use this tips in your excel report wherein you use pivot table. Below are the
Read More
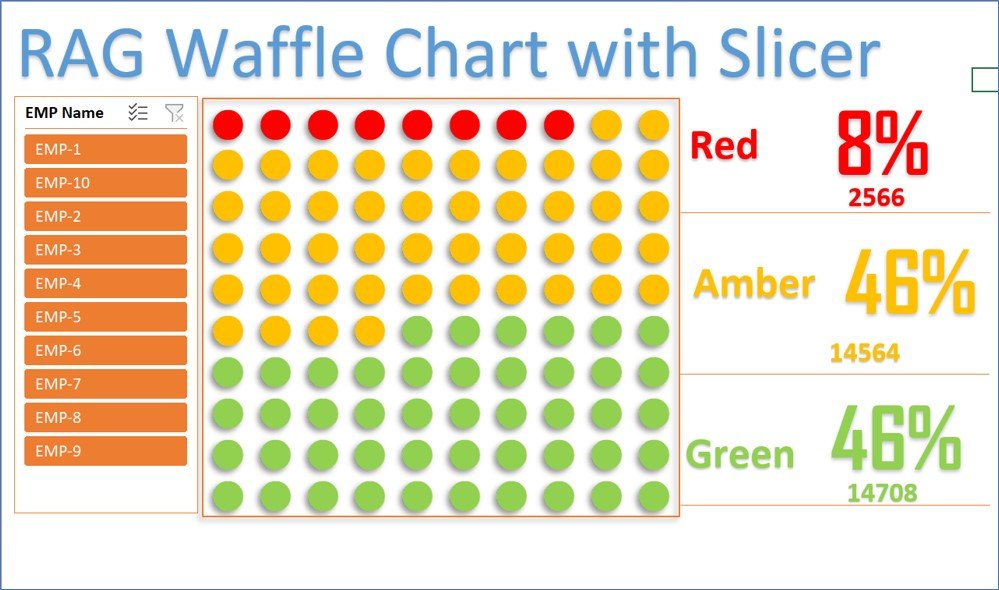
RAG Waffle Chart with Slicer
Charts and Visualization

RAG waffle Chart visualization with Slicer

November 18, 2019March 5, 2025 PKComments Off on RAG waffle Chart visualization with Slicer
In this article, we have create a RAG waffle Chart visualization with slicer to display the Red, Amber and Green percentage. We have used Conditional Formatting and linked picture feature
Read More
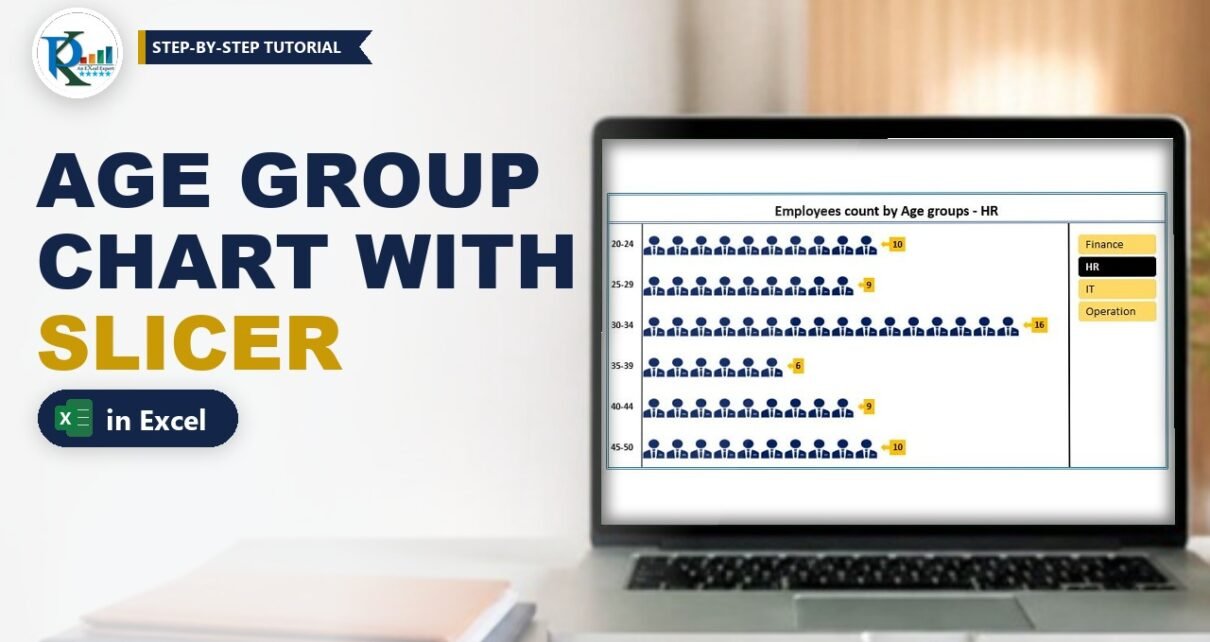
Dynamic Chart with Slicer in Excel: Employees by Age Group
Charts and Visualization

Dynamic Chart with Slicer in Excel: Employees by Age Group

July 17, 2019October 9, 2026 PKComments Off on Dynamic Chart with Slicer in Excel: Employees by Age Group
A dynamic chart with slicer in Excel lets anyone click a department and instantly see how many employees fall into each age group. In this tutorial you build it from
Read More
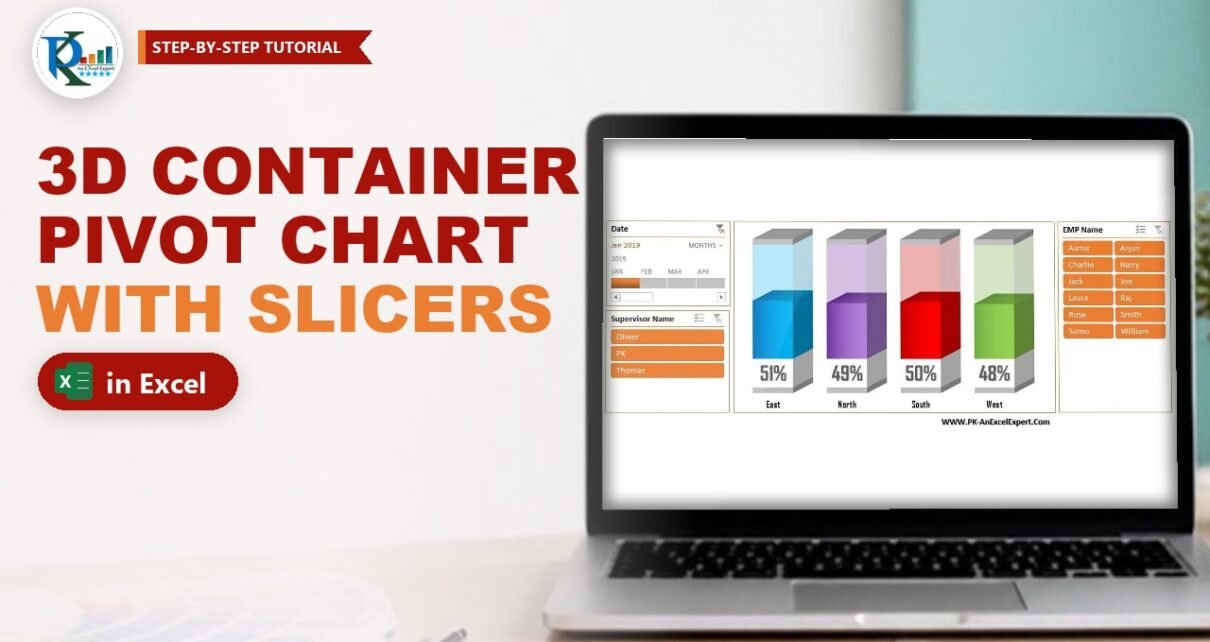
3D Container Pivot Chart in Excel with Slicer and Timeline
Charts and Visualization

3D Container Pivot Chart in Excel with Slicer and Timeline

May 15, 2019October 9, 2026 PKComments Off on 3D Container Pivot Chart in Excel with Slicer and Timeline
A 3D container pivot chart shows a percentage as a liquid level inside a glass-like box: the solid part is what you achieved and the see-through part is what is
Read More
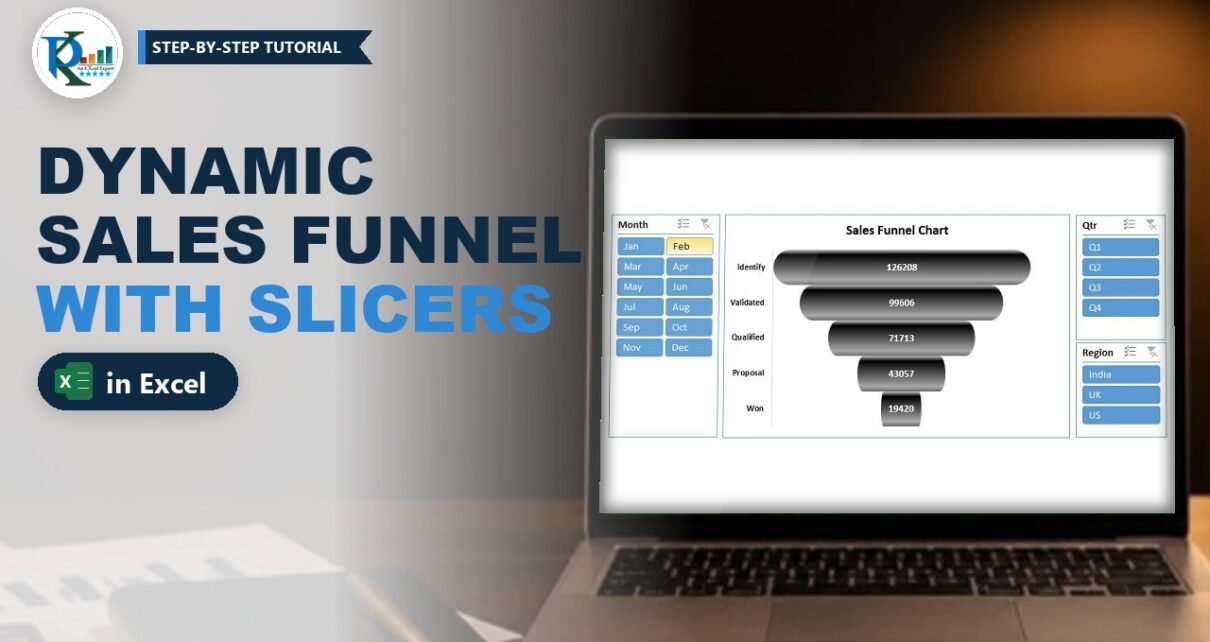
Dynamic Sales Funnel Chart in Excel with Slicers
Charts and Visualization

Dynamic Sales Funnel Chart in Excel with Slicers

May 8, 2019October 9, 2026 PKComments Off on Dynamic Sales Funnel Chart in Excel with Slicers
A sales funnel chart in Excel shows how many deals move from one stage to the next, from the first identified lead down to the deals you won. In this
Read More

Posts pagination

1 2 Next
  • Learn Excel (Free Course)
    • 1. Shortcut Keys
    • 2. Fill & Flash Fill
    • 3. Find & Replace
    • 4. Sort & Filter
    • 5. Formulas & Functions
    • 6. Data Validation
    • 7. Conditional Formatting
    • 8. Basic Charts
    • 9. Advanced Charts
    • 10. Pivot Tables
    • 11. Excel Dashboards
    • 12. VBA Course
    • 13. Excel Formulas with AI
  • Templates
  • Tutorials
    • Charts and Visualization
    • VBA
    • Excel Tips and Tricks
    • Excel Dashboards
    • Power Pivot & DAX
  • Power BI
  • Template Store
    • Ready to Use Templates
  • Courses
  • Academy
    • Excel + AI Mastery: 100 Formulas
    • Excel Pivot Tables & Dashboards
  • About Us
  • Contact Us
Copyright © 2023 PK-AnExcelExpert.com - Privacy Policy