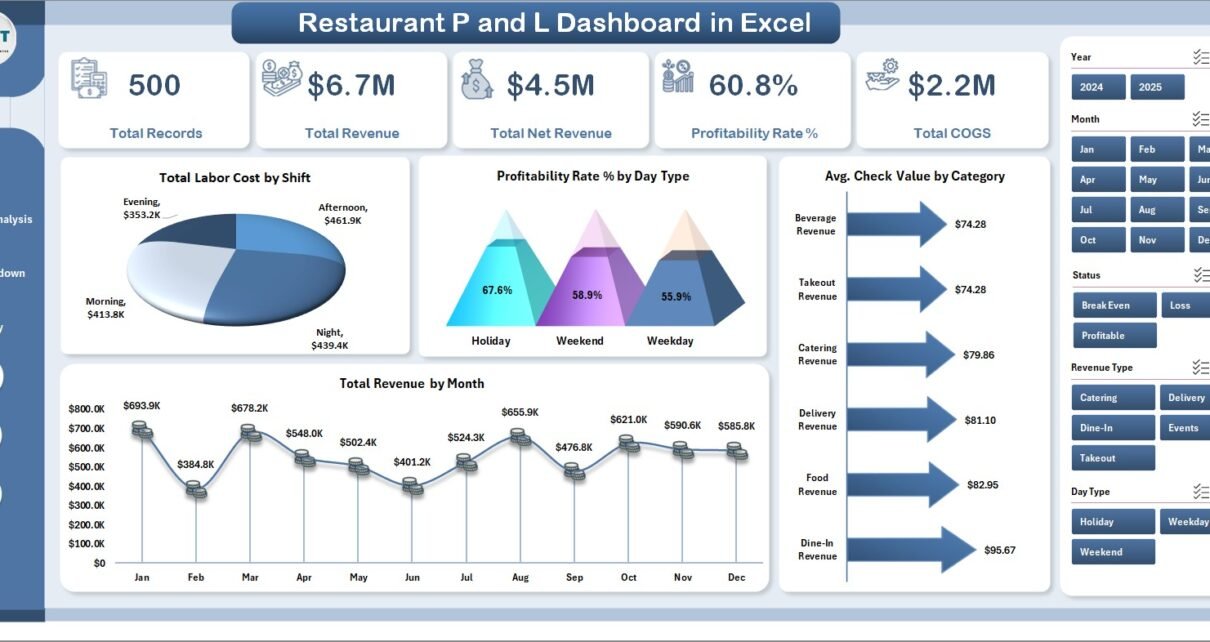
Charts and Visualization Excel Tips and Tricks Quick Analysis Tool in Microsoft Excel October 2, 2022October 2, 2022 PKComments Off on Quick Analysis Tool in Microsoft Excel
Charts and Visualization Sales Analysis Heat Map by Time and Day March 27, 2022March 27, 2022 PKComments Off on Sales Analysis Heat Map by Time and Day
Charts and Visualization Excel Tips and Tricks Conditional Formatting in a Pivot Table with Example December 6, 2021December 6, 2021 PKComments Off on Conditional Formatting in a Pivot Table with Example
Dashboard Power Pivot Comparative Analysis Dashboard in Excel June 20, 2021June 20, 2021 PKComments Off on Comparative Analysis Dashboard in Excel
Charts and Visualization 3 Useful Tips for the Pivot Chart May 16, 2021May 16, 2021 PKComments Off on 3 Useful Tips for the Pivot Chart
Excel Tips and Tricks 10 Super useful Productivity Tips in Excel March 7, 2021March 7, 2021 PKComments Off on 10 Super useful Productivity Tips in Excel
Charts and Visualization Dynamic Pivot Table with Multiple Tables using Power Query January 31, 2021January 31, 2021 PKComments Off on Dynamic Pivot Table with Multiple Tables using Power Query
Power BI VBA Custom Toggle Button in Excel and Power BI August 9, 2020August 9, 2020 PKComments Off on Custom Toggle Button in Excel and Power BI
Excel Tips and Tricks Pivot Table Super Tips in Excel February 16, 2020February 16, 2020 PKComments Off on Pivot Table Super Tips in Excel
Power Pivot KPI in Power Pivot for dashboard and report January 15, 2020January 15, 2020 PKComments Off on KPI in Power Pivot for dashboard and report