New: NextGenTemplates Academy - video courses on Excel formulas with AI and Pivot Tables & dashboards. Early-bird: 20% off with code EARLYBIRD20 - first 20 orders only. See the courses →
  • Learn Excel (Free Course)
    • 1. Shortcut Keys
    • 2. Fill & Flash Fill
    • 3. Find & Replace
    • 4. Sort & Filter
    • 5. Formulas & Functions
    • 6. Data Validation
    • 7. Conditional Formatting
    • 8. Basic Charts
    • 9. Advanced Charts
    • 10. Pivot Tables
    • 11. Excel Dashboards
    • 12. VBA Course
    • 13. Excel Formulas with AI
  • Templates
  • Tutorials
    • Charts and Visualization
    • VBA
    • Excel Tips and Tricks
    • Excel Dashboards
    • Power Pivot & DAX
  • Power BI
  • Template Store
    • Ready to Use Templates
  • Courses
  • Academy
    • Excel + AI Mastery: 100 Formulas
    • Excel Pivot Tables & Dashboards
  • About Us
  • Contact Us

PK: An Excel Expert

Transforming Data into Decisions

Tag: Pivot Chart

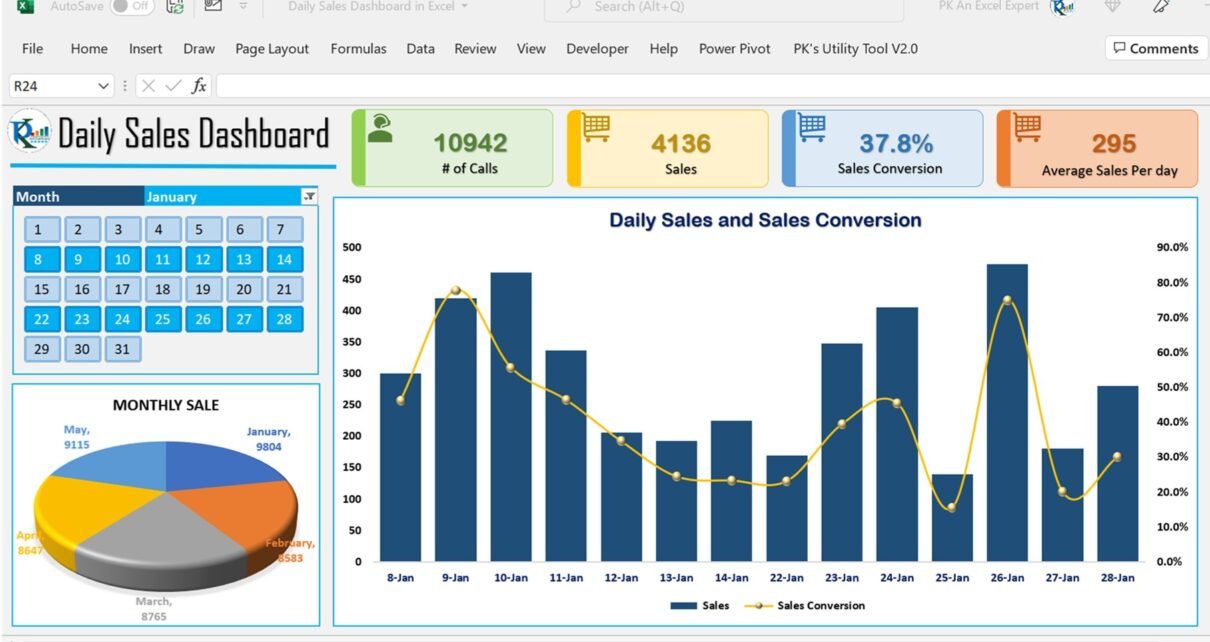
Daily Sales Dashboard
Dashboard

Daily Sales Dashboard in Excel

April 5, 2022February 18, 2025 PKComments Off on Daily Sales Dashboard in Excel
Daily Sales dashboard is quite useful template to track your daily sales. we have created a Daily Sales Dashboard to analyze the Daily Sales trends. We have displayed 4 metrics
Read More
Cross Filter in Excel Chart
Charts and Visualization

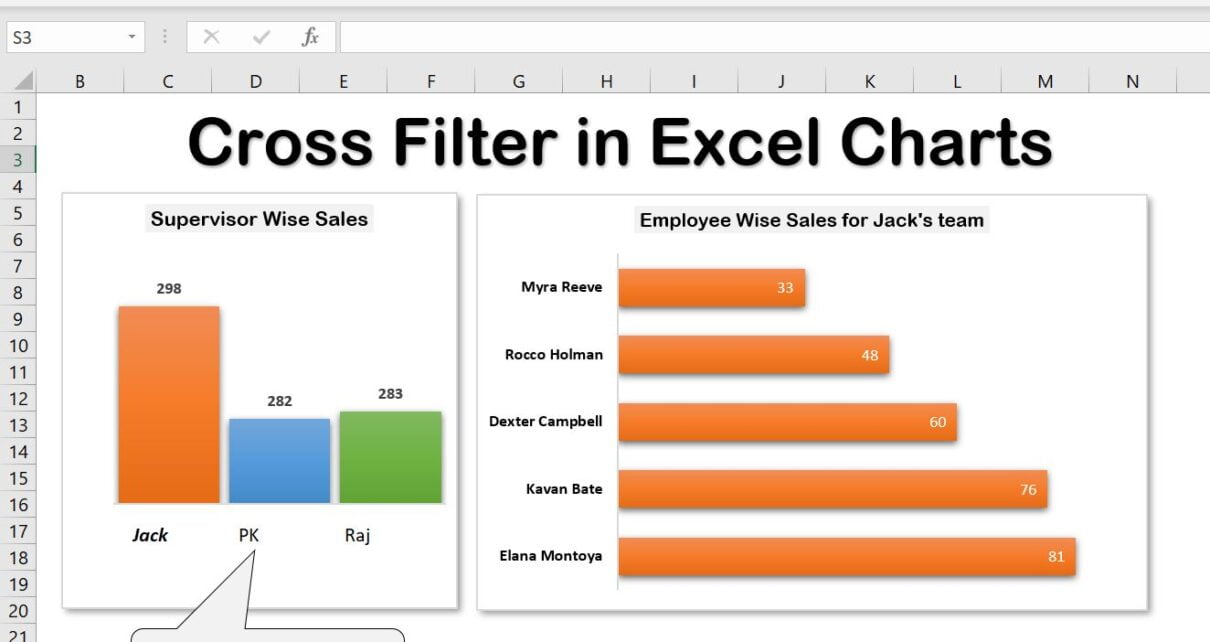
Cross Filter Functionality in Excel Chart

July 5, 2021March 4, 2025 PKComments Off on Cross Filter Functionality in Excel Chart
Excel is a powerful tool that provides a wide range of features to help you analyze and present data effectively. One of the most key features in Excel is the
Read More
Pivot Chart Tips
Charts and Visualization

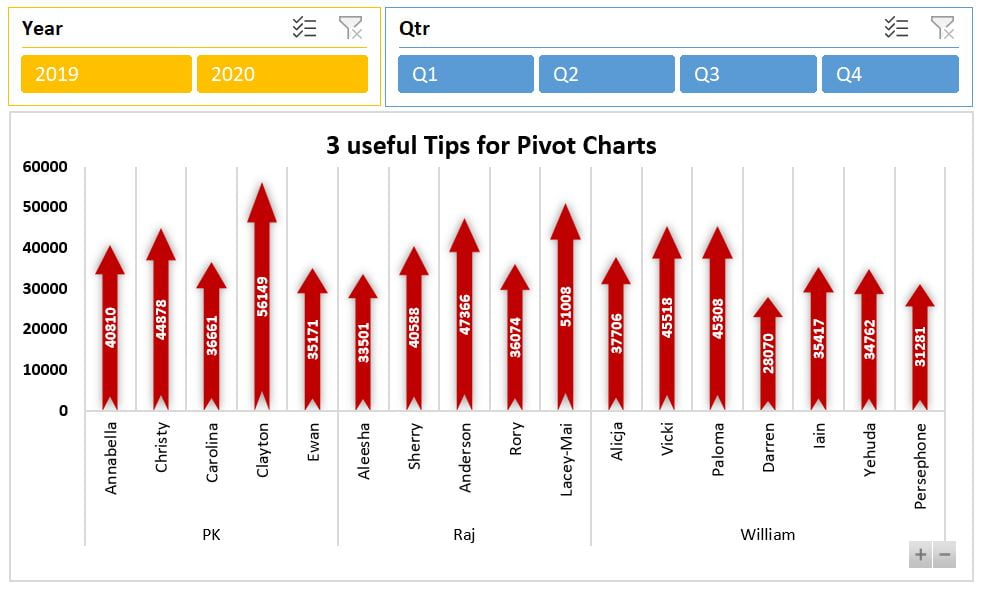
3 Useful Tips for the Pivot Chart

May 16, 2021March 5, 2025 PKComments Off on 3 Useful Tips for the Pivot Chart
In this article, you will learn 3 useful tips for the Pivot Chart. Using these tips you can create an interactive Excel Dashboard. Learn and download interactive Excel Dashboard free
Read More
Dynamic Comparison Analysis Chart
Charts and Visualization

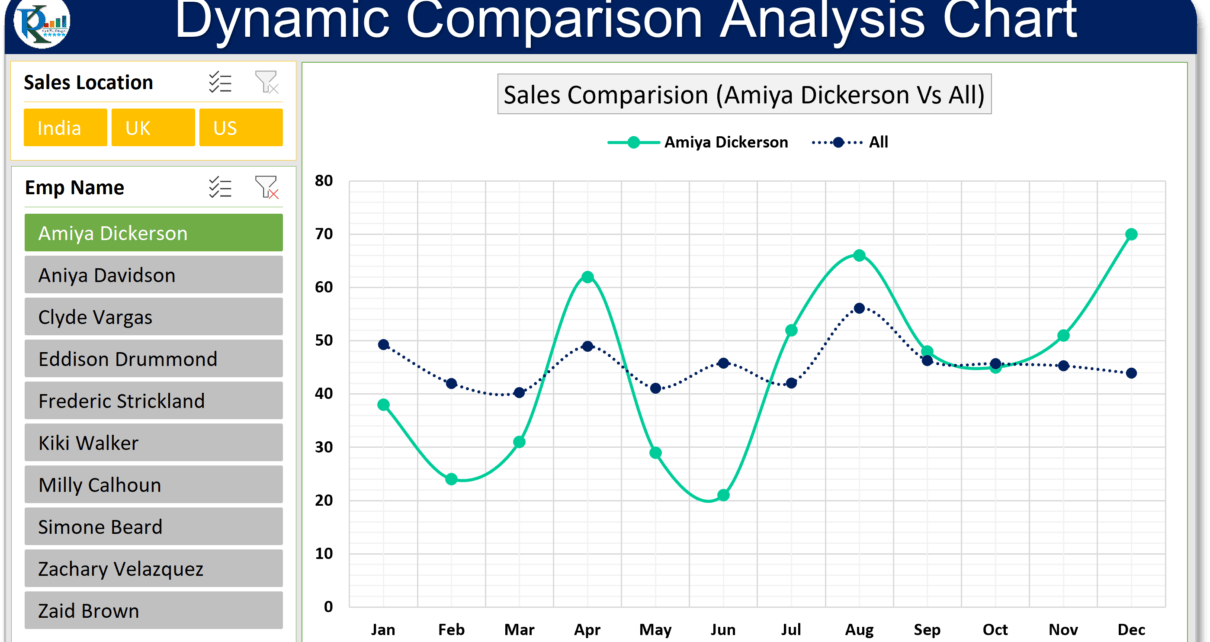
Dynamic Comparison Analysis Chart in Excel

May 3, 2021March 2, 2025 PKComments Off on Dynamic Comparison Analysis Chart in Excel
In this article, you will learn how to create a dynamic comparison Analysis Chart in Microsoft Excel. Using this chart you can compare one employee's performance with other all employees
Read More
Ideas in Excel
Excel Tips and Tricks

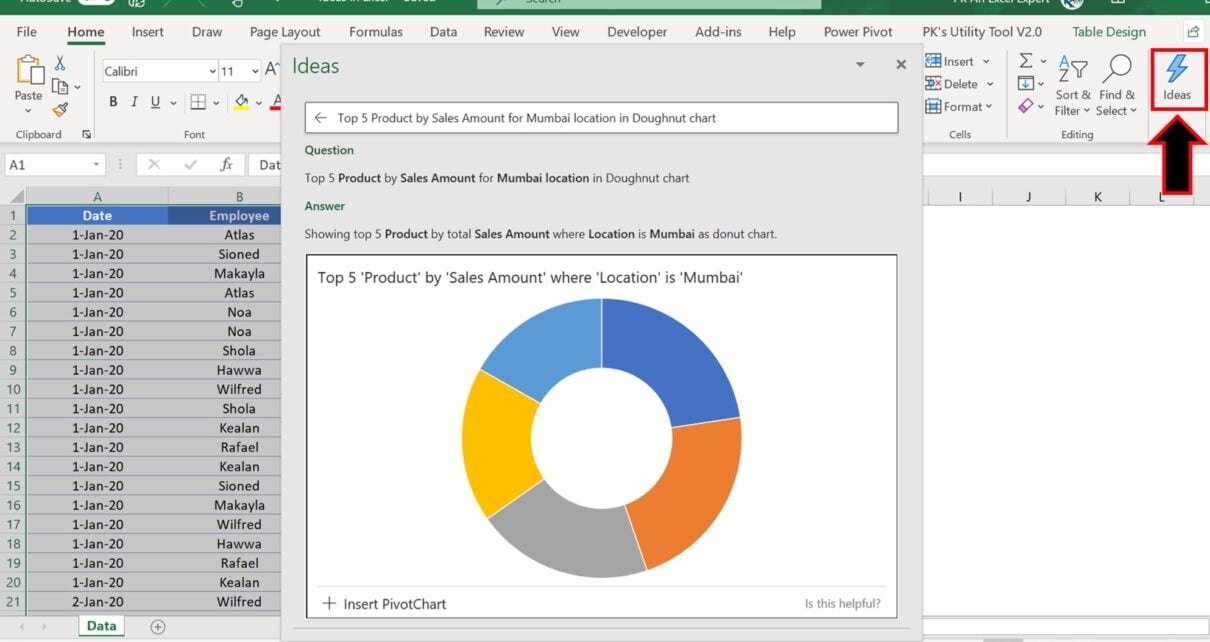
Ideas in Excel

November 22, 2020October 10, 2026 PKComments Off on Ideas in Excel
In this article, we have explained how to use Ideas in Microsoft Excel. Ideas are used to get the suggestion and insights from your data. You can ask any question
Read More
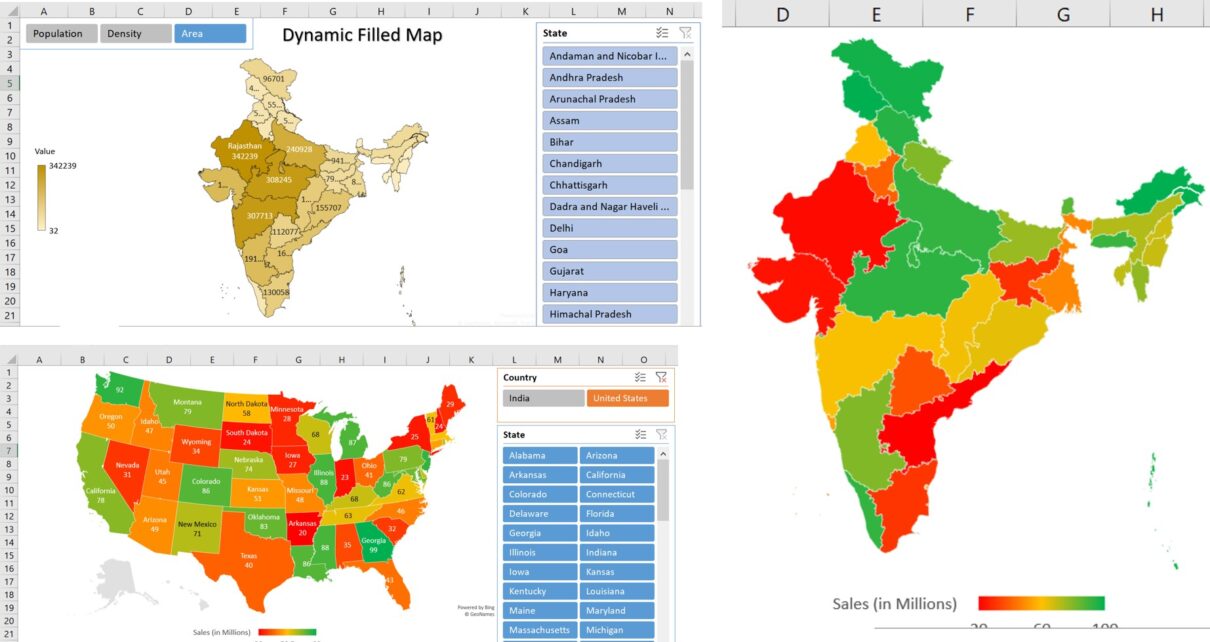
Dynamic Filled Map
Charts and Visualization

Dynamic Filled map in Excel

August 23, 2020October 10, 2026 PKComments Off on Dynamic Filled map in Excel
In the article, You will learn how to create a dynamic filled map in Microsoft Excel. Filled Map is available with Office 365 subscription. You can display the Region, country,
Read More
Table view in Excel
Power BI VBA

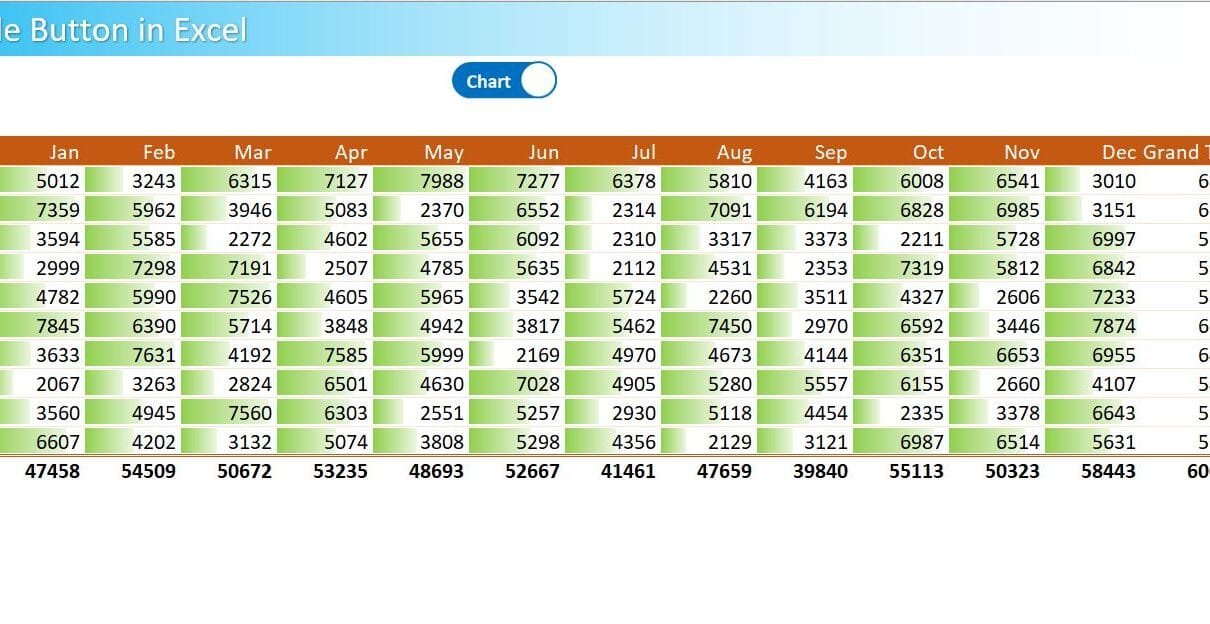
Custom Toggle Button in Excel and Power BI

August 9, 2020October 10, 2026 PKComments Off on Custom Toggle Button in Excel and Power BI
A custom toggle button in Excel and Power BI lets readers switch between a chart and a table in the same dashboard area. This tutorial demonstrates two implementations: Excel VBA
Read More
SUMX Function in Power Pivot: Revenue Measure with RELATED
Power Pivot

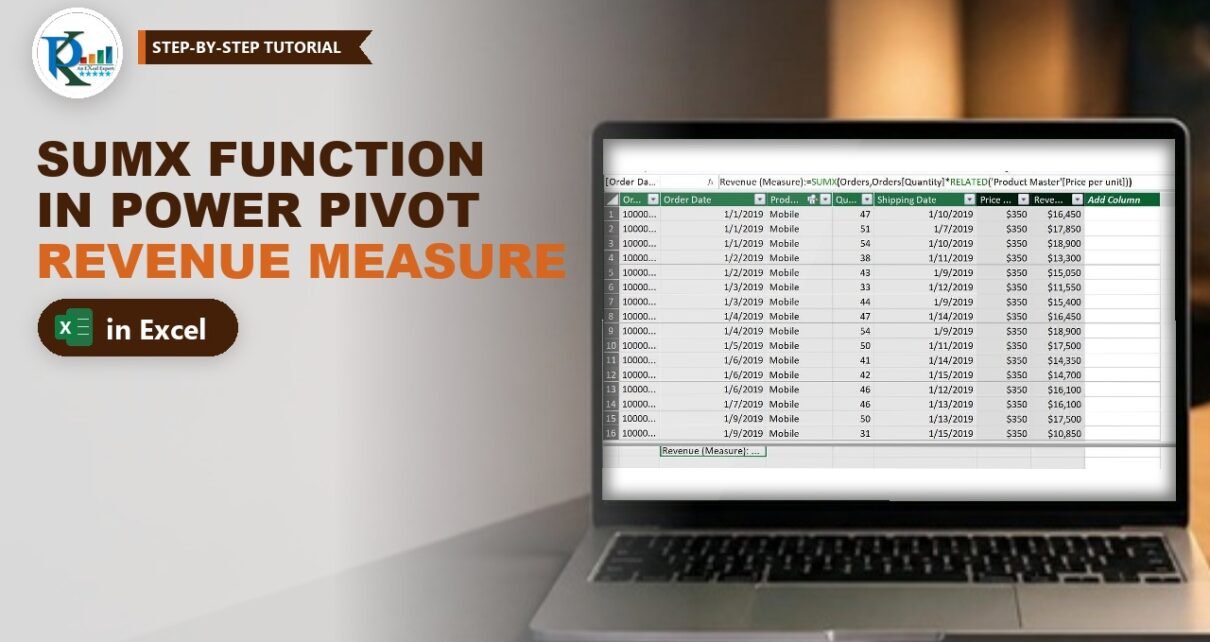
SUMX Function in Power Pivot: Revenue Measure with RELATED

January 13, 2020October 9, 2026 PKComments Off on SUMX Function in Power Pivot: Revenue Measure with RELATED
The SUMX function in Power Pivot lets you calculate revenue with a single measure, without adding any helper columns to your data. In this tutorial you load an Orders table
Read More
Calculated Column in Power Pivot: LOOKUPVALUE vs RELATED
Power Pivot

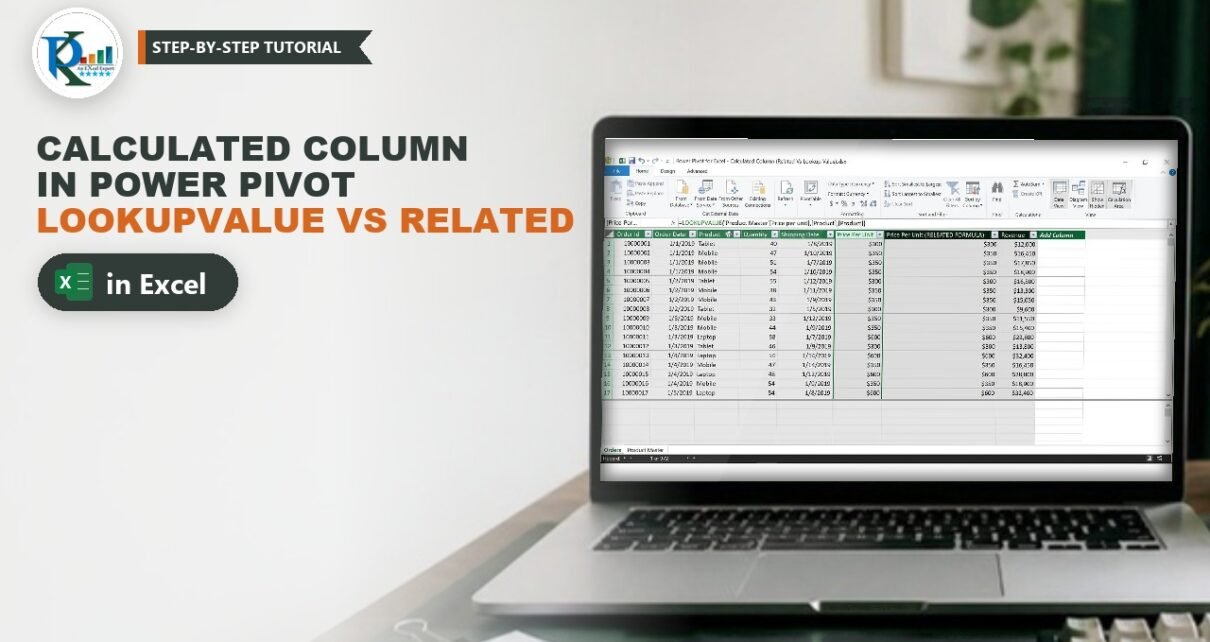
Calculated Column in Power Pivot: LOOKUPVALUE vs RELATED

January 9, 2020October 9, 2026 PKComments Off on Calculated Column in Power Pivot: LOOKUPVALUE vs RELATED
A calculated column in Power Pivot adds a new field to a data model table, computed row by row with a DAX formula. In this tutorial you have an Orders
Read More
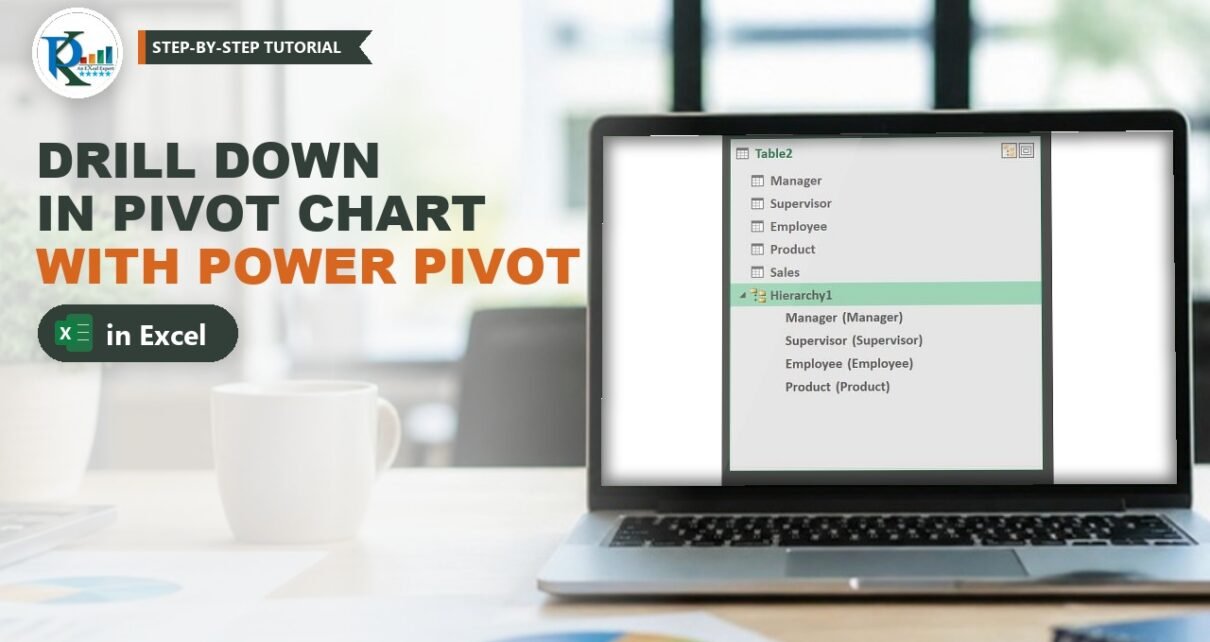
Drill Down in Pivot Chart with Power Pivot Hierarchy in Excel
Power Pivot Charts and Visualization

Drill Down in Pivot Chart with Power Pivot Hierarchy in Excel

January 6, 2020October 9, 2026 PKComments Off on Drill Down in Pivot Chart with Power Pivot Hierarchy in Excel
A drill down in a Pivot Chart lets you start with a big-picture chart and double-click any slice to see what is inside it, level by level. In this tutorial
Read More

Posts pagination

1 2 Next
  • Learn Excel (Free Course)
    • 1. Shortcut Keys
    • 2. Fill & Flash Fill
    • 3. Find & Replace
    • 4. Sort & Filter
    • 5. Formulas & Functions
    • 6. Data Validation
    • 7. Conditional Formatting
    • 8. Basic Charts
    • 9. Advanced Charts
    • 10. Pivot Tables
    • 11. Excel Dashboards
    • 12. VBA Course
    • 13. Excel Formulas with AI
  • Templates
  • Tutorials
    • Charts and Visualization
    • VBA
    • Excel Tips and Tricks
    • Excel Dashboards
    • Power Pivot & DAX
  • Power BI
  • Template Store
    • Ready to Use Templates
  • Courses
  • Academy
    • Excel + AI Mastery: 100 Formulas
    • Excel Pivot Tables & Dashboards
  • About Us
  • Contact Us
Copyright © 2023 PK-AnExcelExpert.com - Privacy Policy