New: NextGenTemplates Academy - video courses on Excel formulas with AI and Pivot Tables & dashboards. Early-bird: 20% off with code EARLYBIRD20 - first 20 orders only. See the courses →
  • Learn Excel (Free Course)
    • 1. Shortcut Keys
    • 2. Fill & Flash Fill
    • 3. Find & Replace
    • 4. Sort & Filter
    • 5. Formulas & Functions
    • 6. Data Validation
    • 7. Conditional Formatting
    • 8. Basic Charts
    • 9. Advanced Charts
    • 10. Pivot Tables
    • 11. Excel Dashboards
    • 12. VBA Course
    • 13. Excel Formulas with AI
  • Templates
  • Tutorials
    • Charts and Visualization
    • VBA
    • Excel Tips and Tricks
    • Excel Dashboards
    • Power Pivot & DAX
  • Power BI
  • Template Store
    • Ready to Use Templates
  • Courses
  • Academy
    • Excel + AI Mastery: 100 Formulas
    • Excel Pivot Tables & Dashboards
  • About Us
  • Contact Us

PK: An Excel Expert

Transforming Data into Decisions

Tag: Pivot Chart

Dynamic Chart with Slicer in Excel: Employees by Age Group
Charts and Visualization

Dynamic Chart with Slicer in Excel: Employees by Age Group

July 17, 2019October 9, 2026 PKComments Off on Dynamic Chart with Slicer in Excel: Employees by Age Group
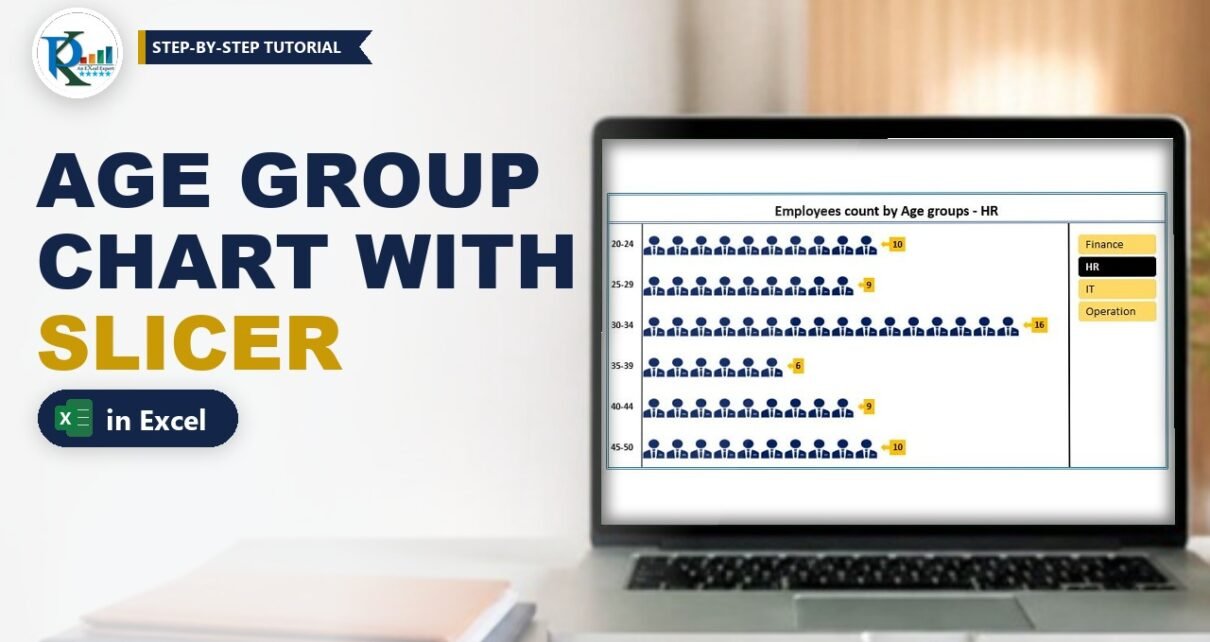
A dynamic chart with slicer in Excel lets anyone click a department and instantly see how many employees fall into each age group. In this tutorial you build it from
Read More
Stylish Pivot Chart with Slicer in Excel (Step by Step)
Charts and Visualization

Stylish Pivot Chart with Slicer in Excel (Step by Step)

May 27, 2019October 9, 2026 PKComments Off on Stylish Pivot Chart with Slicer in Excel (Step by Step)
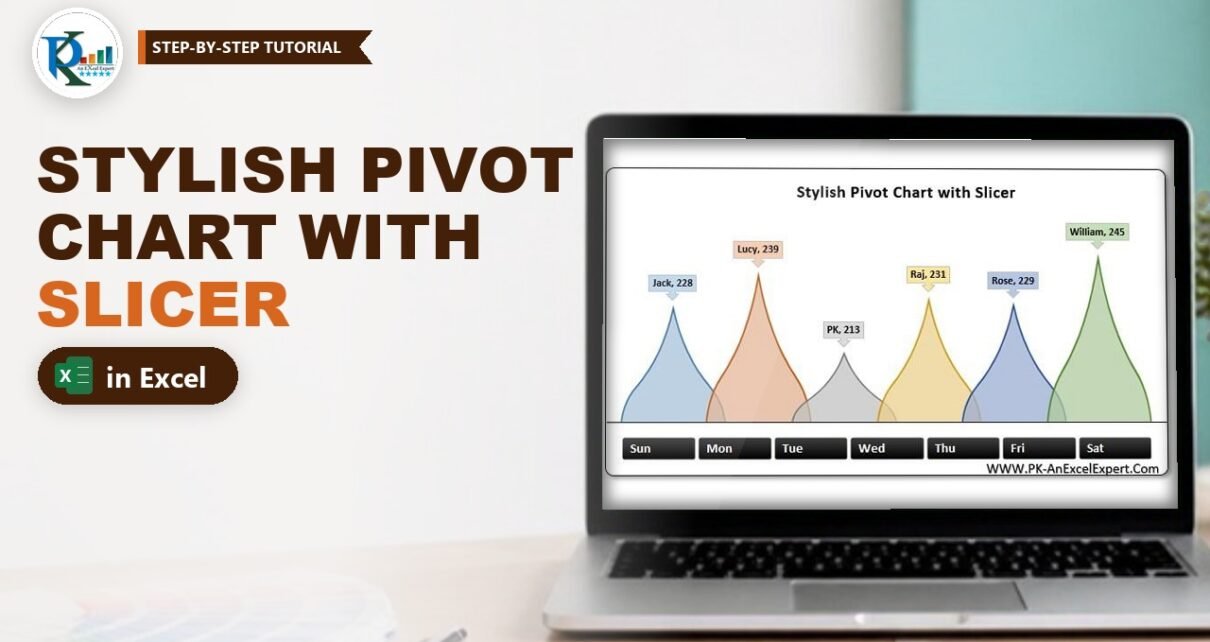
A stylish pivot chart with slicer in Excel turns a plain employee sales report into an eye-catching, clickable visual. In this tutorial you build PK's teardrop chart step by step:
Read More
3D Container Pivot Chart in Excel with Slicer and Timeline
Charts and Visualization

3D Container Pivot Chart in Excel with Slicer and Timeline

May 15, 2019October 9, 2026 PKComments Off on 3D Container Pivot Chart in Excel with Slicer and Timeline
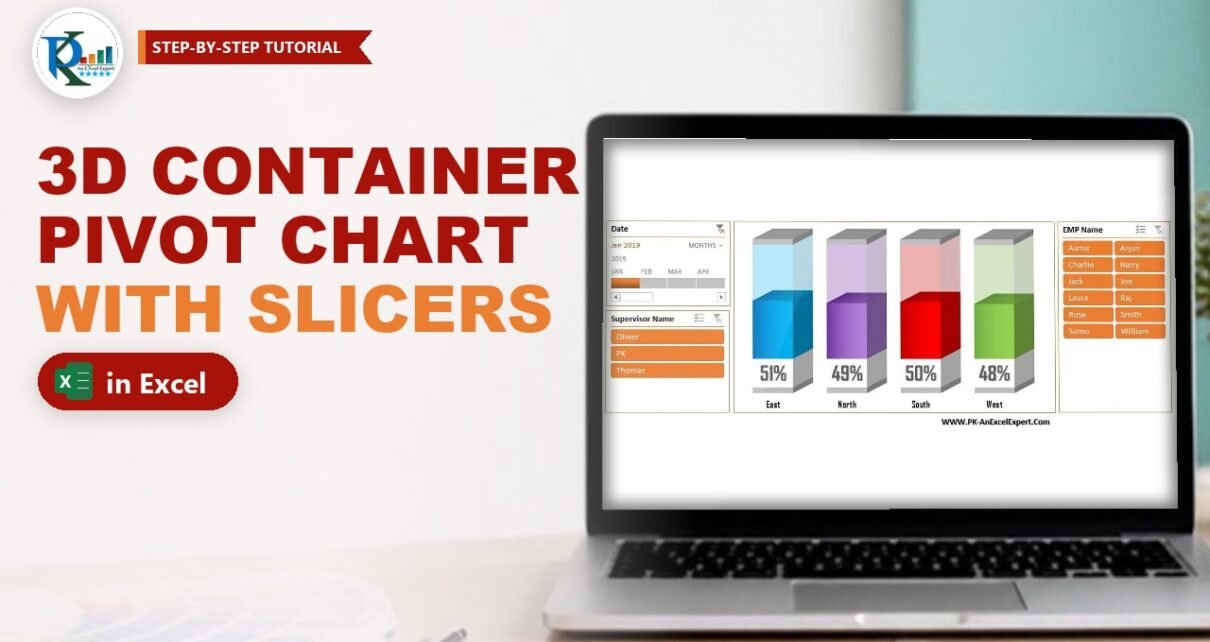
A 3D container pivot chart shows a percentage as a liquid level inside a glass-like box: the solid part is what you achieved and the see-through part is what is
Read More

Posts pagination

Previous 1 2
  • Learn Excel (Free Course)
    • 1. Shortcut Keys
    • 2. Fill & Flash Fill
    • 3. Find & Replace
    • 4. Sort & Filter
    • 5. Formulas & Functions
    • 6. Data Validation
    • 7. Conditional Formatting
    • 8. Basic Charts
    • 9. Advanced Charts
    • 10. Pivot Tables
    • 11. Excel Dashboards
    • 12. VBA Course
    • 13. Excel Formulas with AI
  • Templates
  • Tutorials
    • Charts and Visualization
    • VBA
    • Excel Tips and Tricks
    • Excel Dashboards
    • Power Pivot & DAX
  • Power BI
  • Template Store
    • Ready to Use Templates
  • Courses
  • Academy
    • Excel + AI Mastery: 100 Formulas
    • Excel Pivot Tables & Dashboards
  • About Us
  • Contact Us
Copyright © 2023 PK-AnExcelExpert.com - Privacy Policy