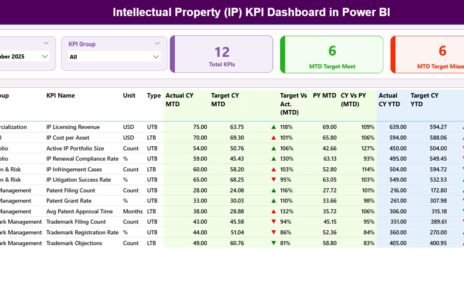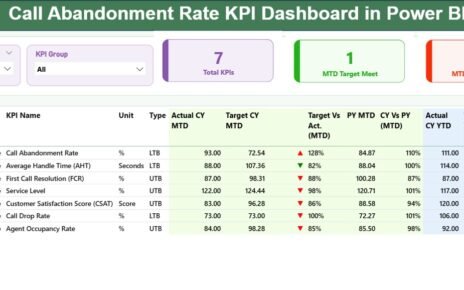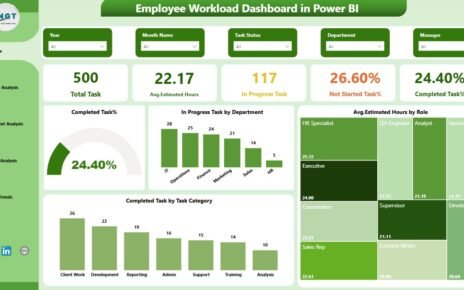
A custom toggle button in Excel and Power BI lets readers switch between a chart and a table in the same dashboard area. This tutorial demonstrates two implementations: Excel VBA macros that change worksheet objects, and Power BI bookmarks that restore visual visibility.
Excel Macros and Power BI Bookmarks Use Different Methods
In the Excel example, two macros change shape visibility and hide or show columns A:N. The Power BI example records chart and table visibility in bookmarks, then assigns those bookmarks to button actions. The shared button design does not mean that the two applications run the same code.
What should I check before reusing the Excel macros?
The supplied code refers to shapes named Btn_Table, Btn_Chart and Chart on the active worksheet. Match those names to your workbook and check what columns A:N contain before running either macro. The original code is reproduced unchanged below.
How can I keep Power BI filters when switching views?
Bookmarks can save both data and display settings. For a visibility-only switch, review the bookmark’s Data option so selecting it does not restore an unwanted slicer state. Microsoft’s report-bookmark documentation explains Data, Display and Selected visuals settings.
Visit our YouTube channel to learn step-by-step video tutorials
Watch the step by step video tutorial for Custom Toggle Button in Excel and Power BI:
Excel: Toggle the Chart and Table with VBA
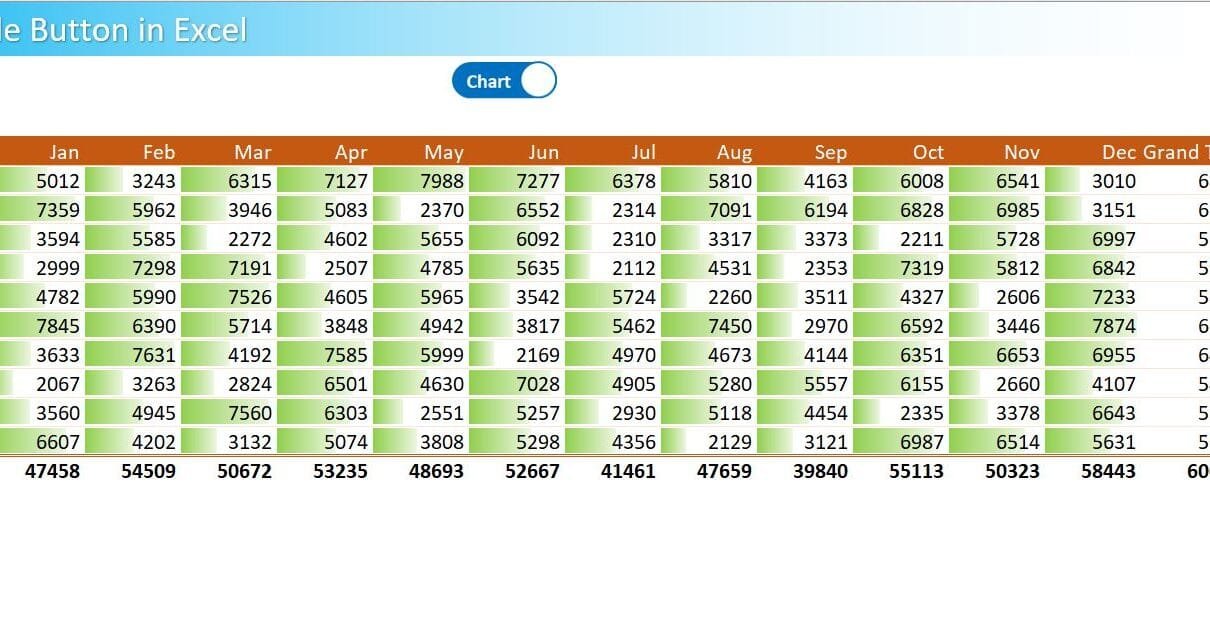
We have used 2 images to create the toggle button in Excel. We have created the 2 macros to show the chart and Table and assigned the macros to these buttons.
Below are the images of the Toggle buttons. We will arrange them on top of each other.

We have created below given macros and assigned to the respective buttons-
Sub Show_Table()

Dim sh As Worksheet
Set sh = ActiveSheet


sh.Shapes("Btn_Table").Visible = msoFalse
sh.Shapes("Btn_Chart").Visible = msoCTrue
sh.Shapes("Chart").Visible = msoFalse
sh.Range("A:N").EntireColumn.Hidden = False

End Sub
Sub Show_Chart()

Dim sh As Worksheet
Set sh = ActiveSheet

sh.Shapes("Btn_Table").Visible = msoCTrue
sh.Shapes("Btn_Chart").Visible = msoFalse
sh.Shapes("Chart").Visible = msoCTrue

sh.Range("A:N").EntireColumn.Hidden = True

End Sub
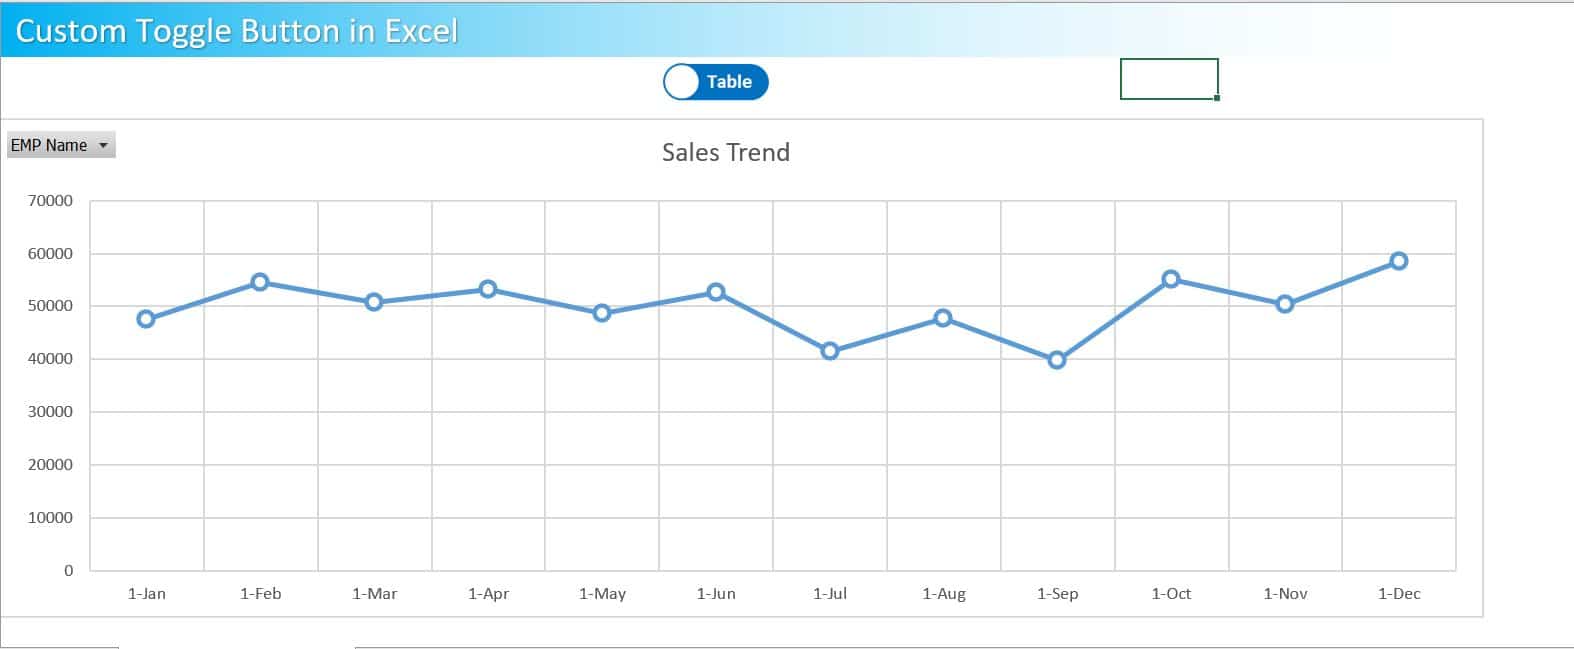
If we will click on the Chart button then it will display chart view-
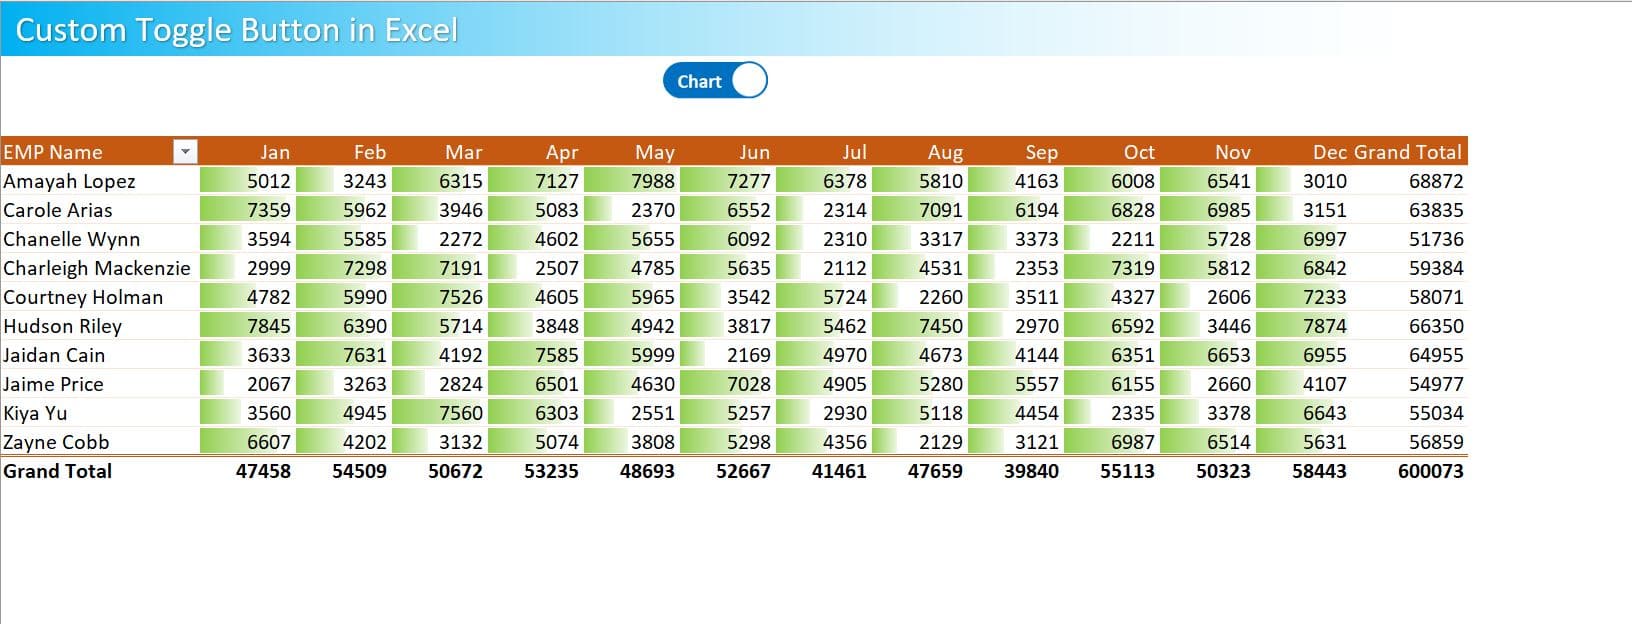
If will click on the Table button then it will display the Table view-
Custom Toggle Button in Microsoft Power BI
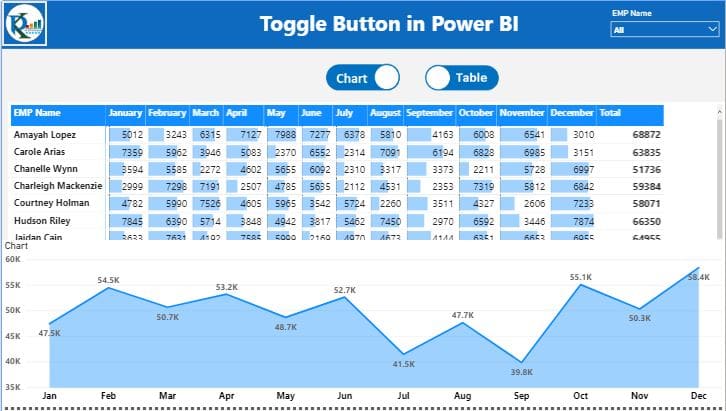
In the Power BI, we can create the Bookmarks to create the toggle buttons. First, import the toggle button images from Insert >> Image and create the chart and tables as per your requirements.
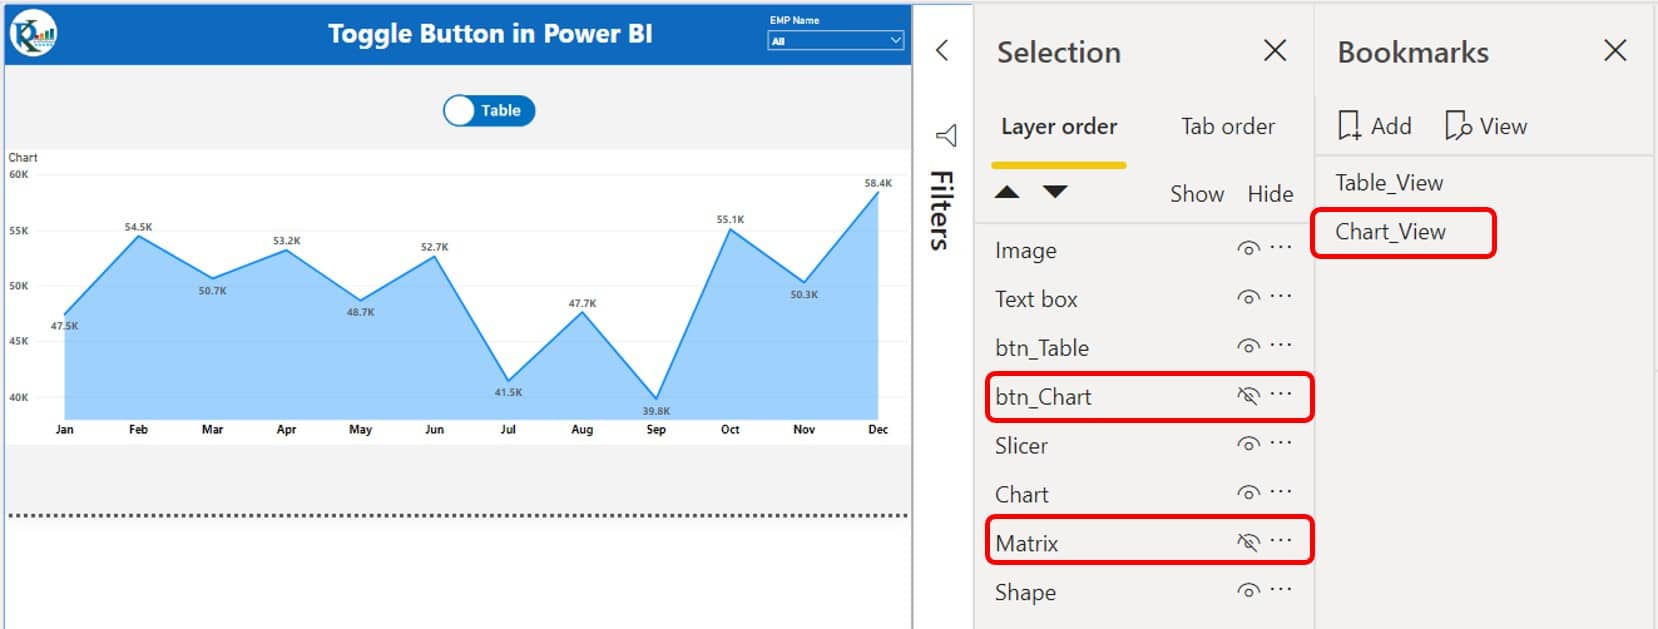
Open the selection pane from View >> Selection. To create the Table view bookmarks, hide the table button and chart from the Selection pane.
Open the Bookmarks pane from View >> Bookmarks. Add a bookmark for the table view. Use a consistent name such as Table_View, then select that same bookmark in the table button’s action.
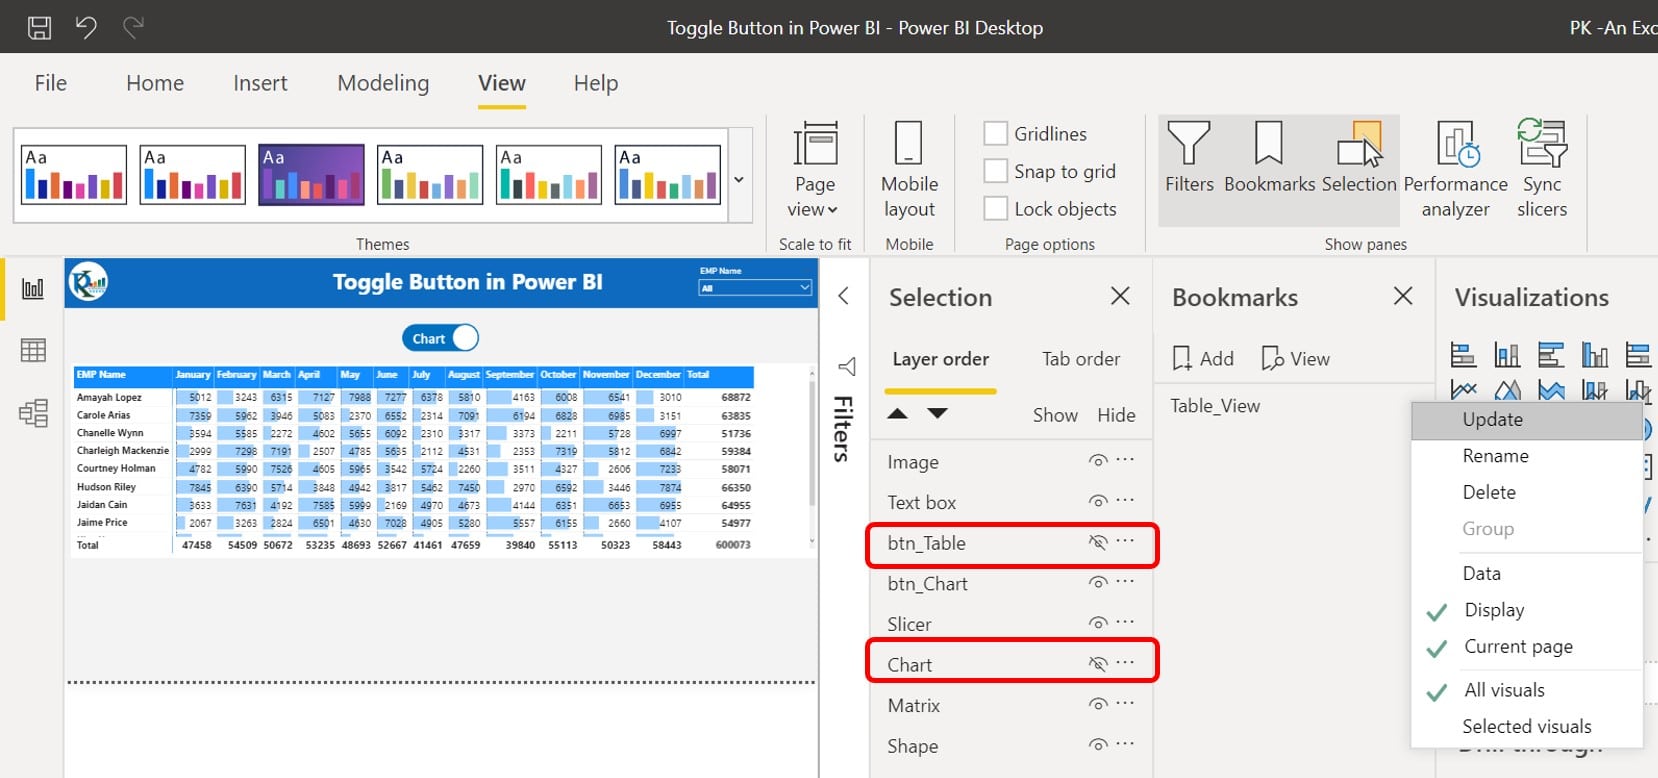
Now hide the chart button and matrix and show the table button and chart from the selection pane. Add a bookmark and rename it with Chart_View.
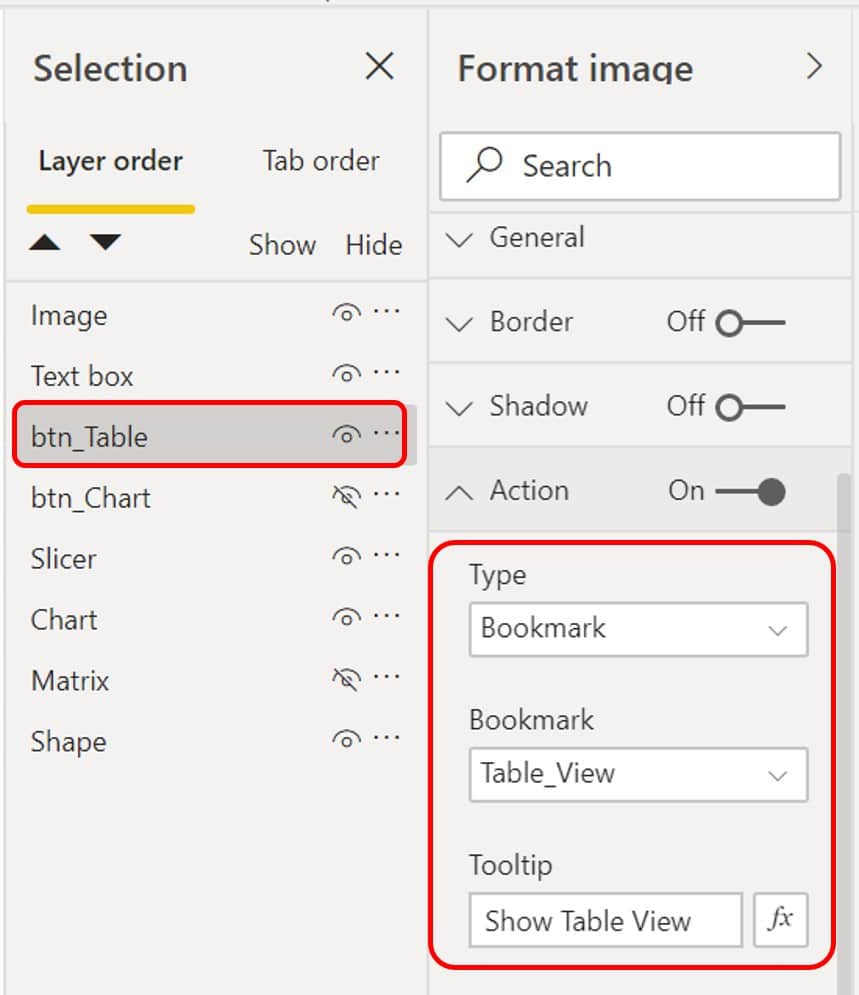
Select the table button in the selection pane and add an action as a bookmark. Select the bookmark you created for the table view (Table_View in this explanation).
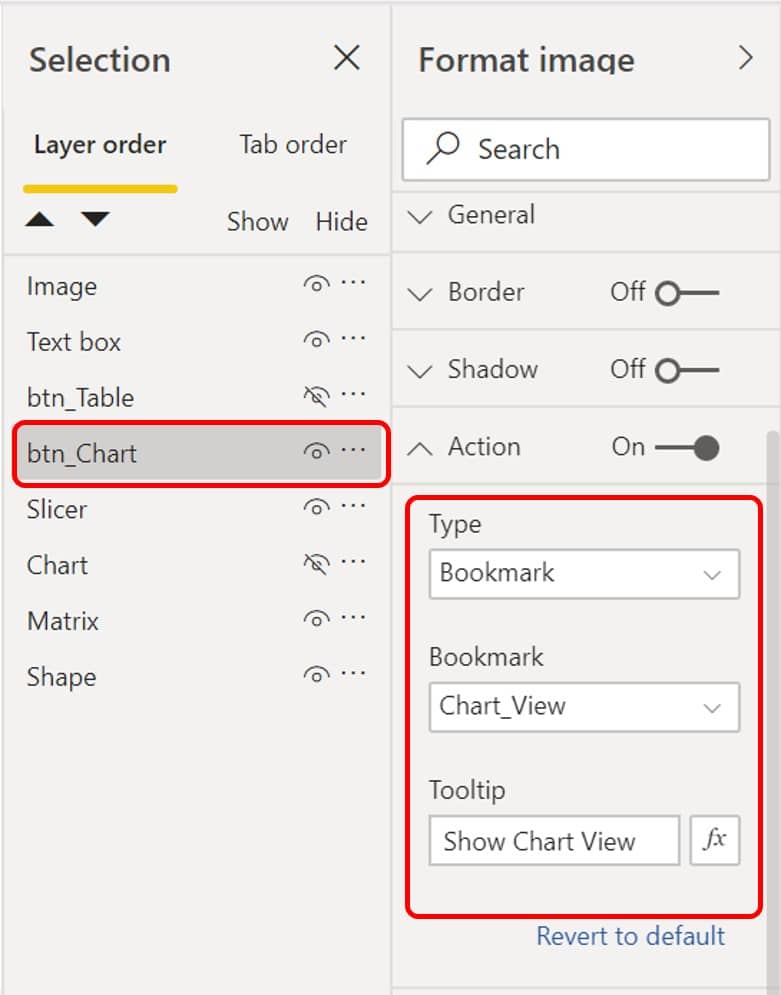
Now select the chart button in the selection pane and add an action as a bookmark. Select the Chart_View bookmark.
Now you can keep both buttons on top of each other. Now, these buttons will work like a toggle button to show the Chart and Table.