New: NextGenTemplates Academy - video courses on Excel formulas with AI and Pivot Tables & dashboards. Early-bird: 20% off with code EARLYBIRD20 - first 20 orders only. See the courses →
  • Learn Excel (Free Course)
    • 1. Shortcut Keys
    • 2. Fill & Flash Fill
    • 3. Find & Replace
    • 4. Sort & Filter
    • 5. Formulas & Functions
    • 6. Data Validation
    • 7. Conditional Formatting
    • 8. Basic Charts
    • 9. Advanced Charts
    • 10. Pivot Tables
    • 11. Excel Dashboards
    • 12. VBA Course
    • 13. Excel Formulas with AI
  • Templates
  • Tutorials
    • Charts and Visualization
    • VBA
    • Excel Tips and Tricks
    • Excel Dashboards
    • Power Pivot & DAX
  • Power BI
  • Template Store
    • Ready to Use Templates
  • Courses
  • Academy
    • Excel + AI Mastery: 100 Formulas
    • Excel Pivot Tables & Dashboards
  • About Us
  • Contact Us

PK: An Excel Expert

Transforming Data into Decisions

Tag: Bookmark in Power BI

Energy Consumptions Dashboard
Power BI

Energy Consumptions Dashboard in Power BI

March 1, 2022March 27, 2024 PKComments Off on Energy Consumptions Dashboard in Power BI
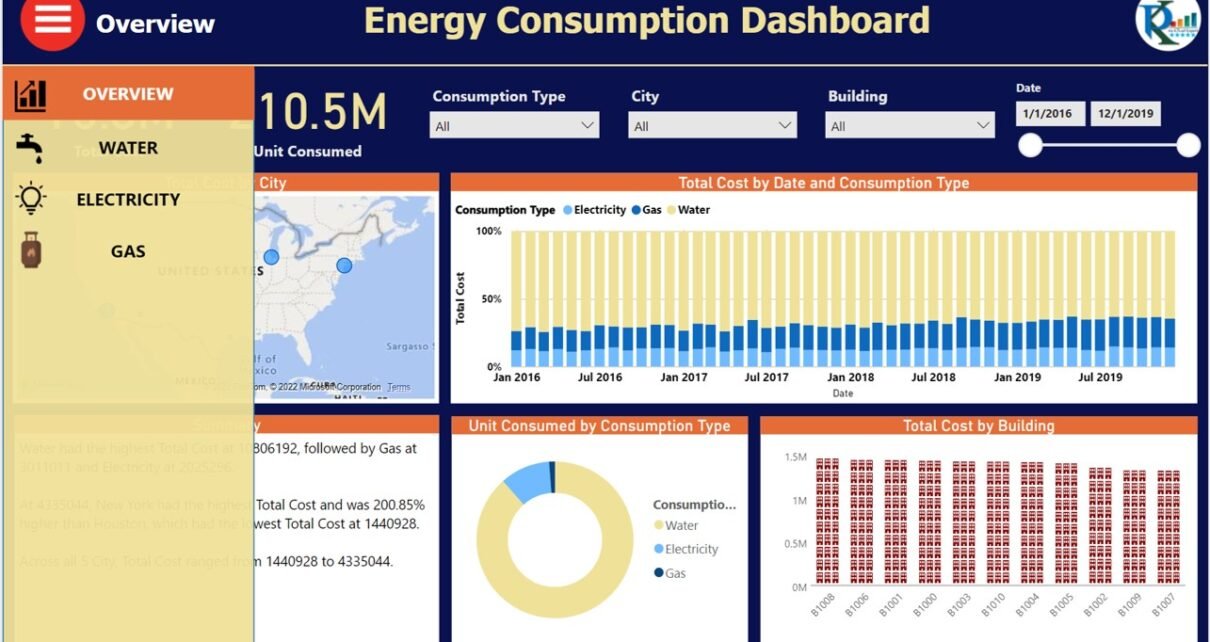
We have created this Energy Consumptions Dashboard in Microsoft Power BI. We have explained step by step data transformation in Power Query, Creation of the Relationship between fact & dimension
Read More
Infographics in Power BI
Power BI

Power BI Infographic Designer: Cards and Chart Examples

April 18, 2021October 10, 2026 PKComments Off on Power BI Infographic Designer: Cards and Chart Examples
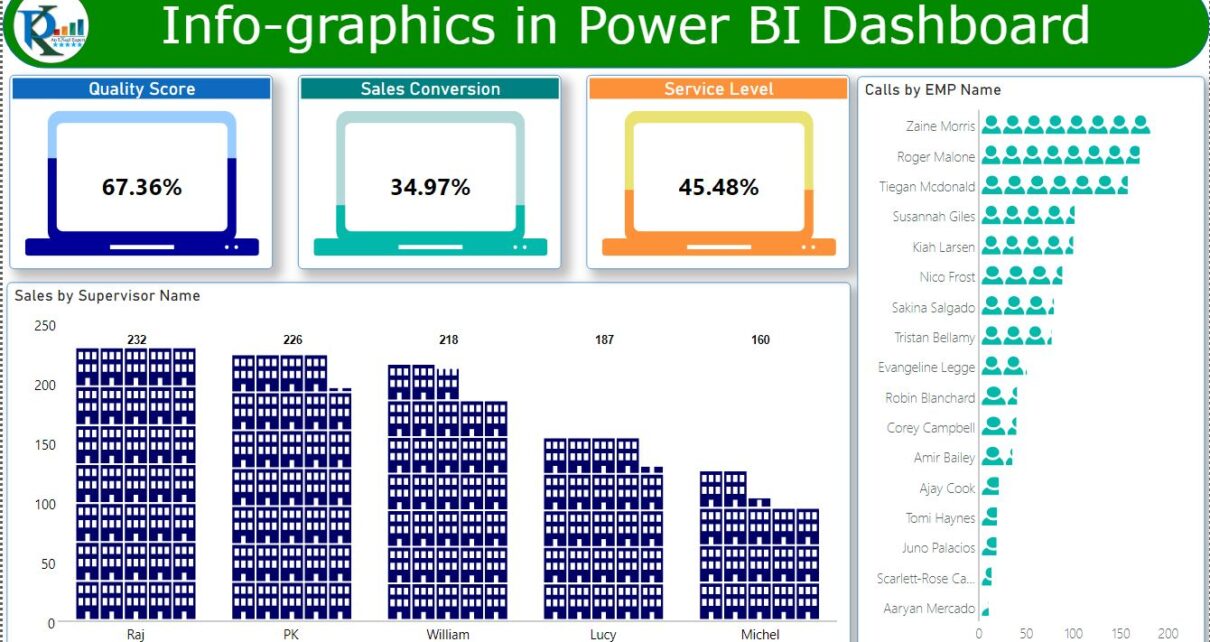
This Power BI example uses Infographic Designer to display cards, column charts and bar charts with icons. The dashboard screenshot shows the finished visual design; the video and practice file
Read More
Table view in Excel
Power BI VBA

Custom Toggle Button in Excel and Power BI

August 9, 2020October 10, 2026 PKComments Off on Custom Toggle Button in Excel and Power BI
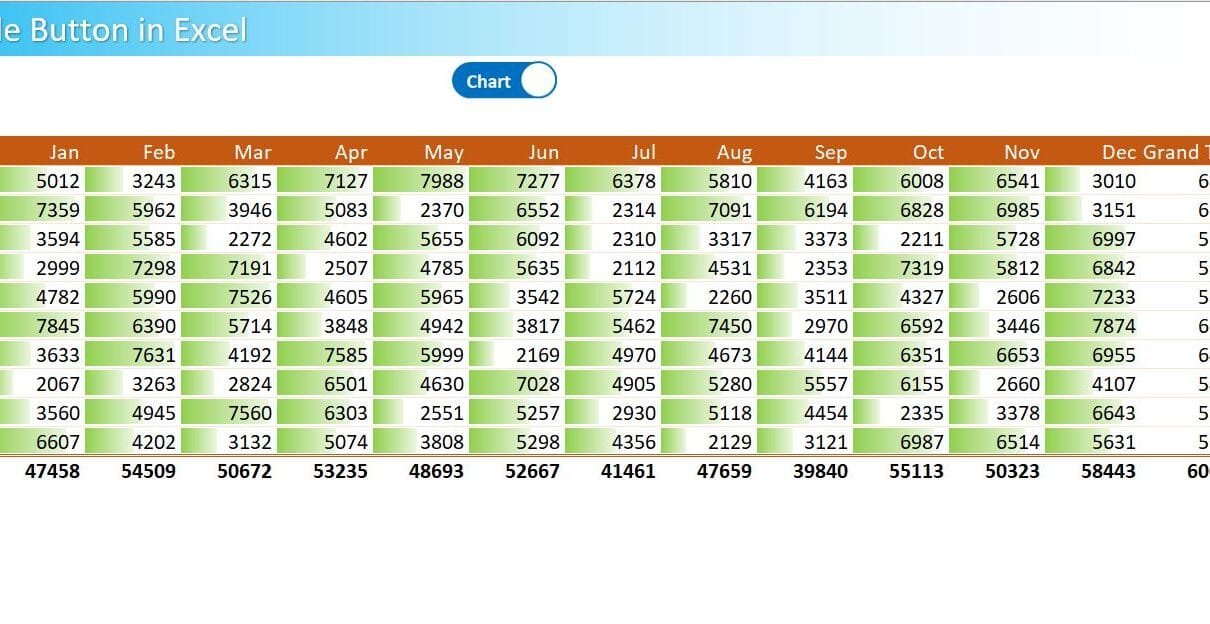
A custom toggle button in Excel and Power BI lets readers switch between a chart and a table in the same dashboard area. This tutorial demonstrates two implementations: Excel VBA
Read More
Sales Dashboard in Power BI: Design, Publish and Share
Power BI

Sales Dashboard in Power BI: Design, Publish and Share

May 22, 2019October 9, 2026 PKComments Off on Sales Dashboard in Power BI: Design, Publish and Share
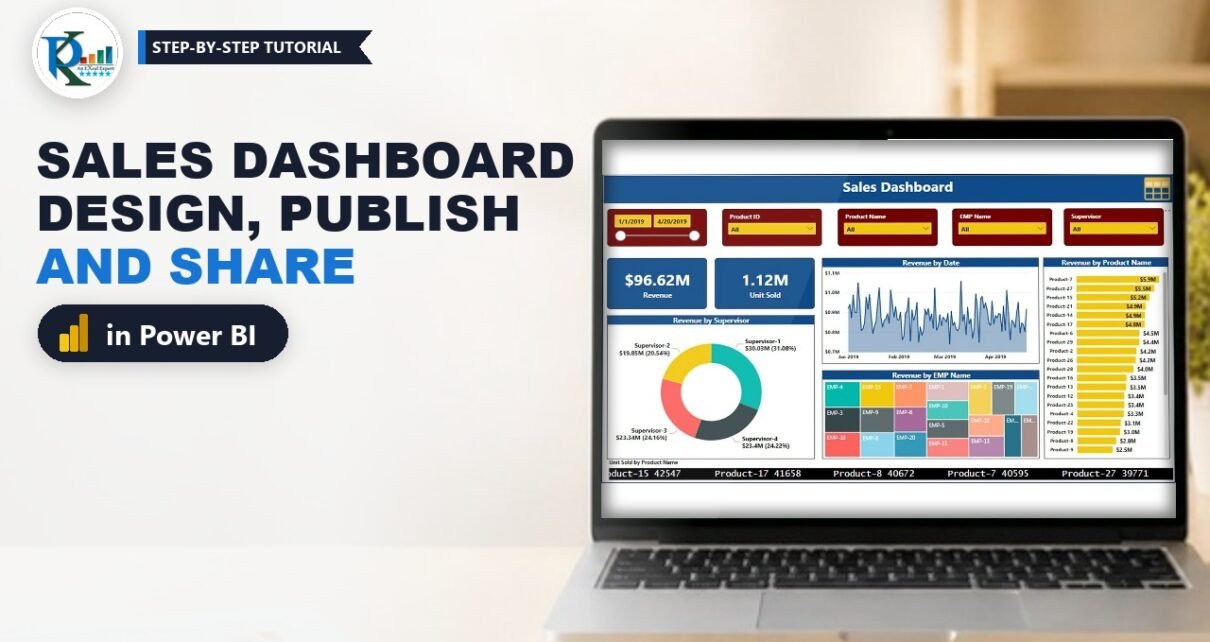
A sales dashboard in Power BI turns three plain Excel tables into an interactive report your team can open in a browser. In this tutorial you build the full project
Read More
  • Learn Excel (Free Course)
    • 1. Shortcut Keys
    • 2. Fill & Flash Fill
    • 3. Find & Replace
    • 4. Sort & Filter
    • 5. Formulas & Functions
    • 6. Data Validation
    • 7. Conditional Formatting
    • 8. Basic Charts
    • 9. Advanced Charts
    • 10. Pivot Tables
    • 11. Excel Dashboards
    • 12. VBA Course
    • 13. Excel Formulas with AI
  • Templates
  • Tutorials
    • Charts and Visualization
    • VBA
    • Excel Tips and Tricks
    • Excel Dashboards
    • Power Pivot & DAX
  • Power BI
  • Template Store
    • Ready to Use Templates
  • Courses
  • Academy
    • Excel + AI Mastery: 100 Formulas
    • Excel Pivot Tables & Dashboards
  • About Us
  • Contact Us
Copyright © 2023 PK-AnExcelExpert.com - Privacy Policy