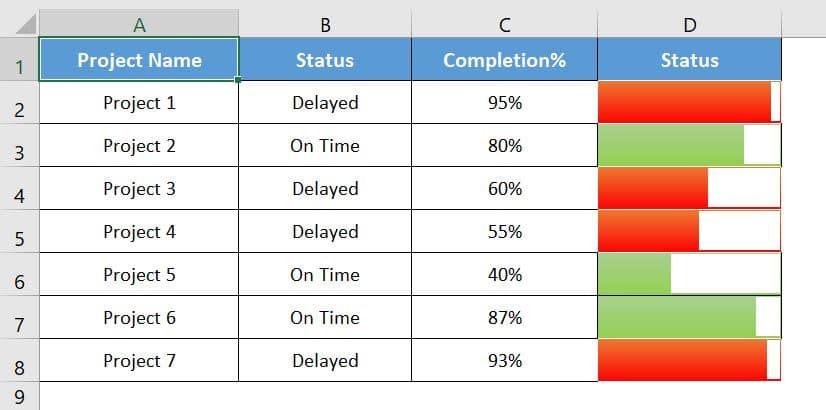
In the article, you will learn how to create Multicolor Filling Bars in Excel Cells without using Chart. You can use such visualization to display the project completion status with red color for delayed and green color for on time. Or you can use this trick to show the service level or Quality score with Red, Amber, and Green color with filling bars.
See our Project Management Dashboard
Multicolor Filling Bars in Excel Cells Without using Chart
Click to buy Multicolor Filling Bars in Excel Cells Without using Chart
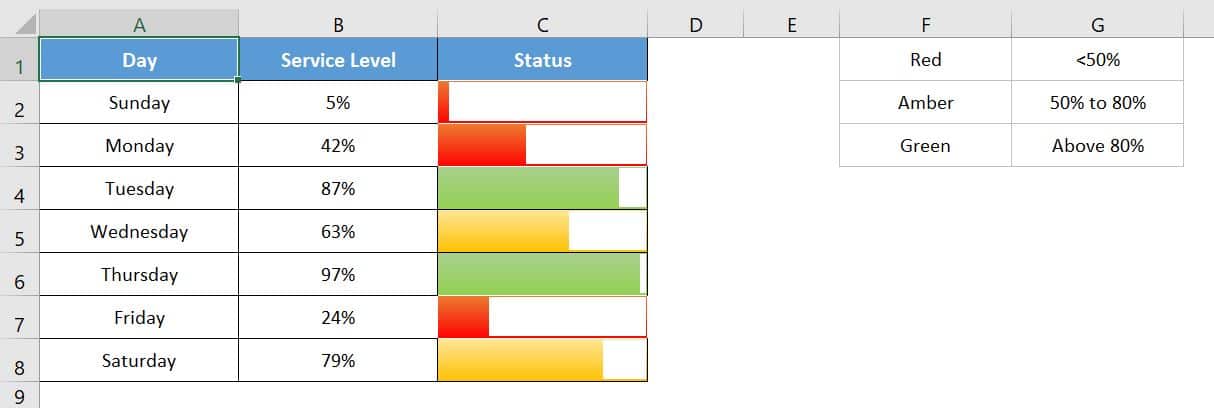
Dynamic Data bars for Service Level with RAG-
Click to buy Multicolor Filling Bars in Excel Cells Without using Chart
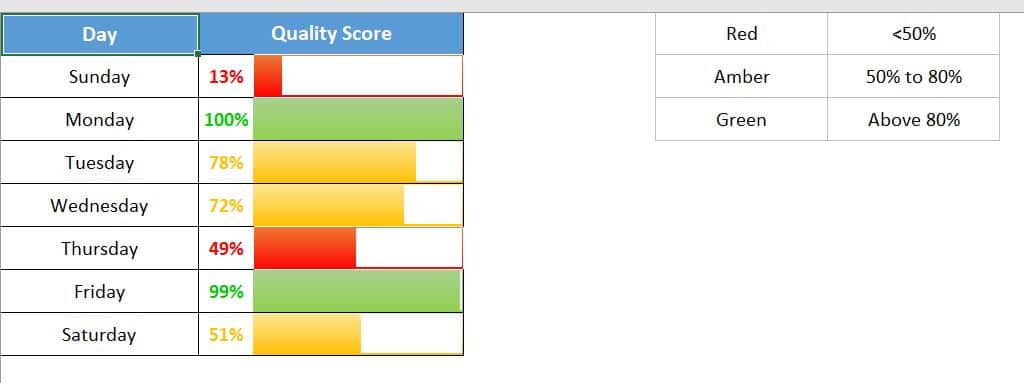
Dynamic Data bars for Quality Score with RAG-
Click to buy Multicolor Filling Bars in Excel Cells Without using Chart
Visit our YouTube channel to learn step-by-step video tutorials
Watch the step by step video tutorial:
we have used two types of conditional formatting to create such data bars.
Click to buy Multicolor Filling Bars in Excel Cells Without using Chart
- Fill Background color
- Data Bar
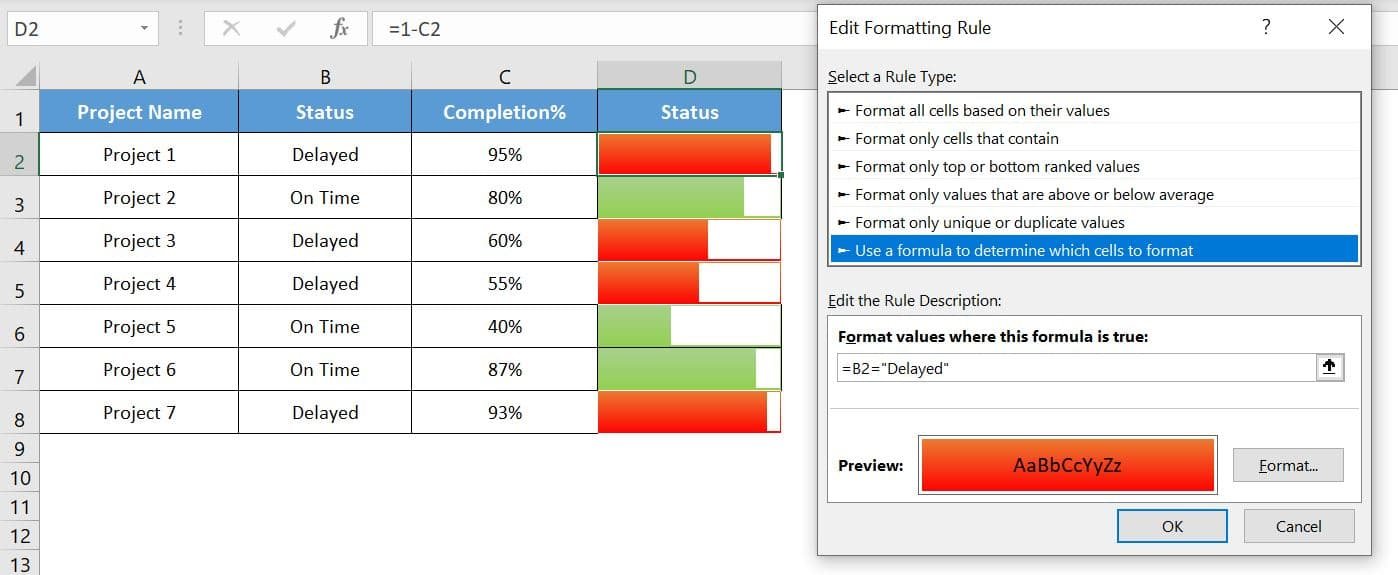
In the status column (Column D), we put the formula “=100%-C2” and fill it down.
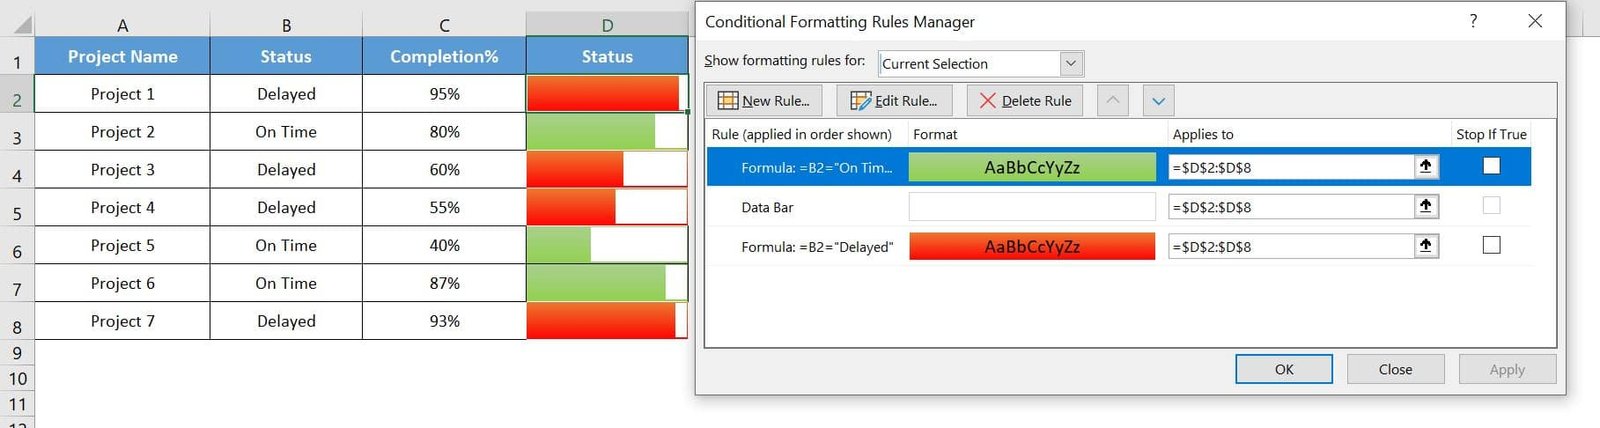
First conditional formatting we put to fill the background color on the base of Column B.
- For “On Time”, we put green color.
- For “Delayed”, we put red color.
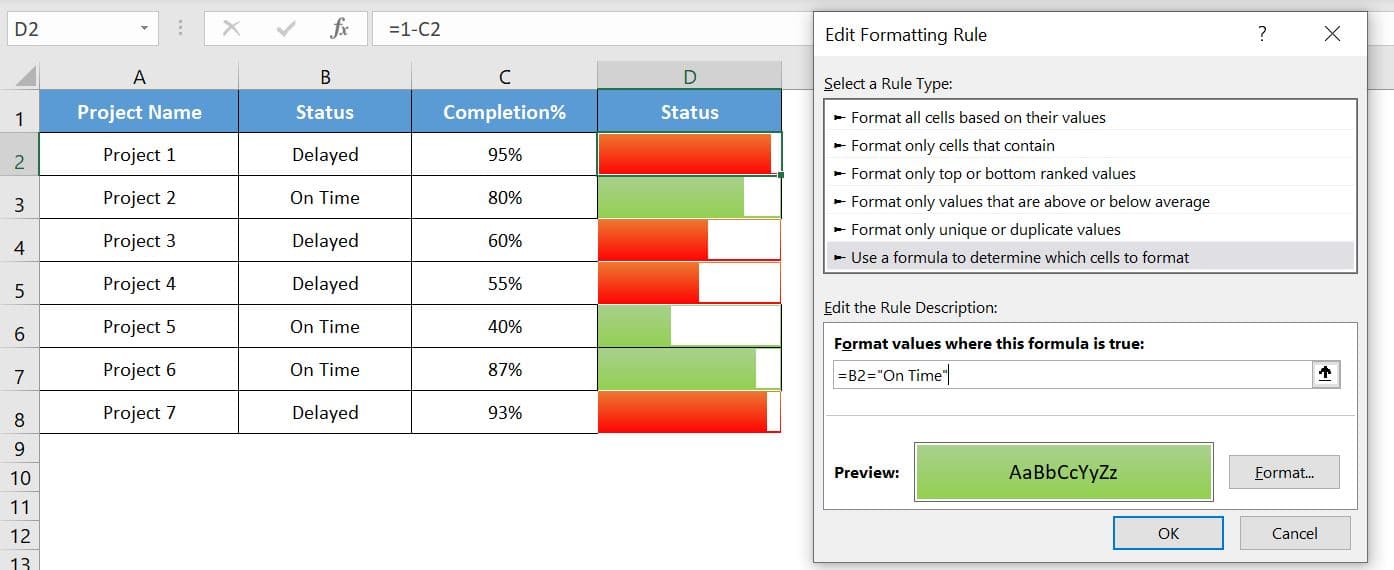
Then we put the Data Bar Conditional formatting with below setting-
- Check Show Bar only.
- Take “Type” as “Number” for Minimum and Maximum.
- Put 0 for minimum and 1 for maximum.
- Select color as white.
- Select Bar Direction Right-to-Left
- Click on OK
Click to buy Multicolor Filling Bars in Excel Cells Without using Chart