An Employee Rating Table in Excel can be a powerful template to visualize and track employee performance across various parameters. So, instead of displaying simple numerical ratings, you can use symbols and Conditional Formatting to make the table more engaging and visually appealing. In this article, we will walk you through creating an Employee Rating Table using drop-down list and conditional formatting with icon sets.
Create Datapoints:
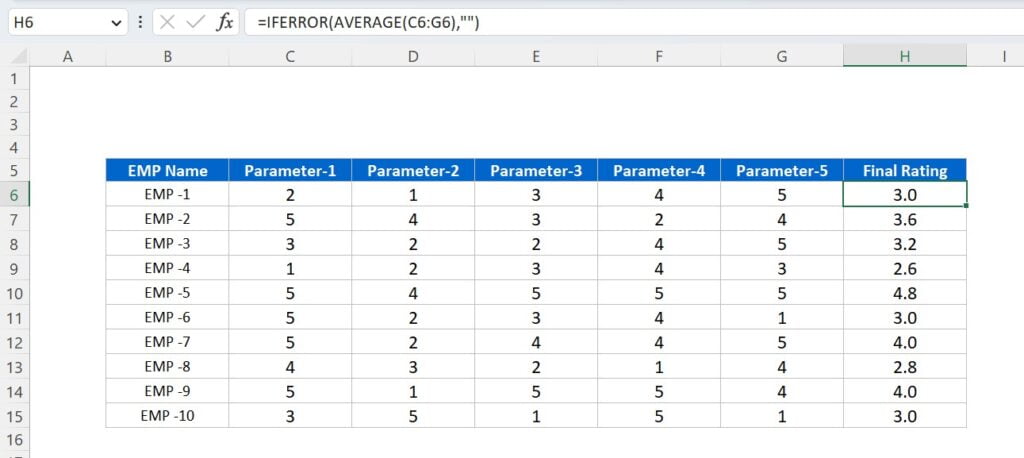
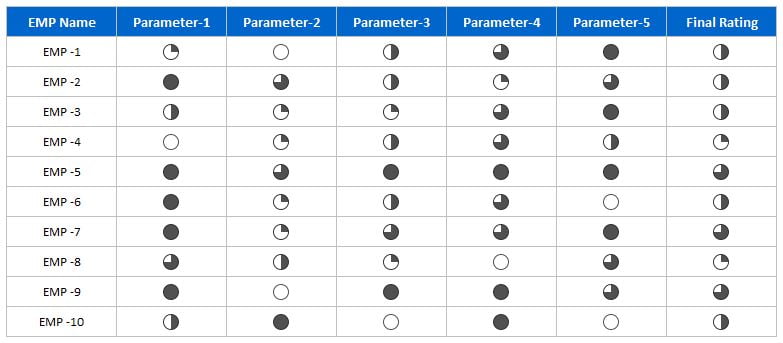
First, let’s create an Employee Rating Table with data points for ten employees. Here, we will have five ratings here from 1 to 5. Certainly, the final rating is the average of the ratings for the five parameters.
Below is the snapshot of the sample data we have entered-
Click to buy Employee Rating Table in Excel
How to Create Rating Drop-Down?
To create a drop-down list for rating selection, below are the steps-
- Step 1: Select the range wherein you want the drop-down list to appear (C6 to H15).
- Step 2: Go to the “Data” tab.
- Step 3: Click on “Data Validation” in the Data Tools group.
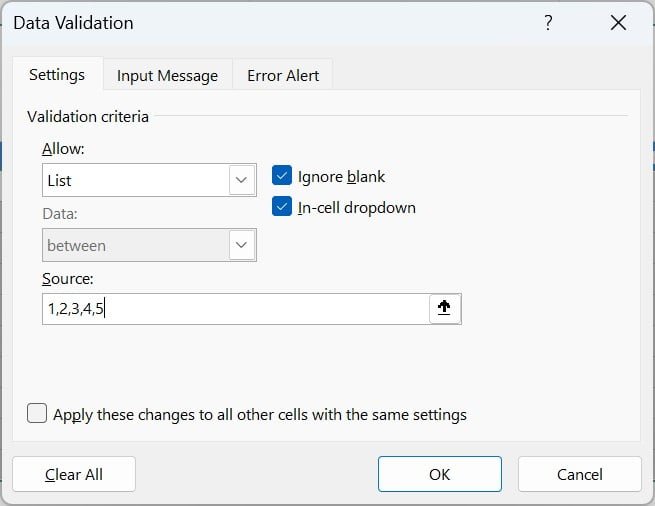
- Step 4: In the Data Validation dialog box, select “List” from the “Allow” menu.
- Step 5: Finally, in the “Source” field, type “1,2,3,4,5” (without quotes) and click “OK.”
Now, each cell in the range C6 to H15 will have a drop-down menu with ratings from 1 to 5.
How to Apply Icon Set Conditional Formatting?
To apply the 5 Quarters Icon Set conditional formatting to the rating cells, below are the steps-
- Step 1: Select the range wherein you want the icon set to appear (C6 to H15).
- Step 2: Go to the “Home” tab in the Excel ribbon.
- Step 3: Click on “Conditional Formatting” in the Styles group.
- Step 4: Hover over “Icon Sets” and select the “5 Quarters” icon set.
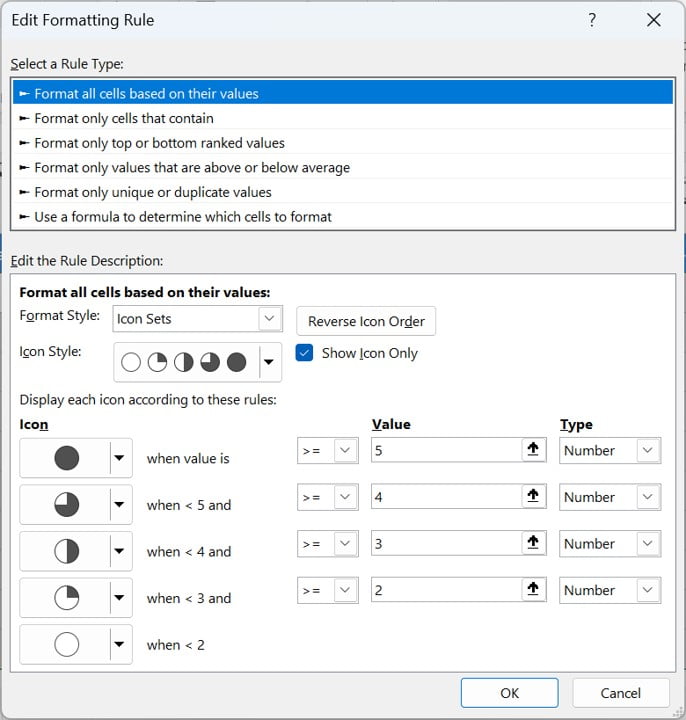
- Step 5: To customize the icon set, click on “Conditional Formatting” again and choose “Manage Rules.”
- Step 6: Select the rule for the 5 Quarters icon set and click “Edit Rule.”
- Step 7: Finally, define the value ranges for each icon. For example, for a rating of 1, a blank circle will appear, and for a rating of 5, a fully filled circle will appear. Adjust the values and click “OK.”
Now, the selected range will display icons based on the rating values.
Advantages of Employee Rating Table in Excel:
Using an Employee Rating Table in Excel offers several advantages:
Easy visualization:
The use of symbols and conditional formatting makes it easier to comprehend employee performance at a glance.
Customizable:
The table is highly customizable, allowing you to modify parameters, rating scales, and visual elements to suit your needs.
Data validation:
Drop-down lists ensure that ratings entered are within the defined range and eliminate errors.
Dynamic updating:
Finally, as ratings are updated, the final rating column automatically recalculates averages, ensuring accurate performance tracking.
Tips for Customizing and Enhancing Your Rating Table:
- Add more parameters or change existing ones to better align with your organization’s performance evaluation criteria.
- Use different icon sets or create custom icons to better represent your rating
Scale and organizational culture
- Firstly, incorporate color scales or data bars in conditional formatting to provide an additional layer of visual information.
- Secondly, freeze the top row to keep headers visible when scrolling through a large dataset.
- Thirdly, add a column for employee titles or departments to enable filtering and sorting based on these criteria.
Using the Employee Rating Table for Performance Management:
Certainly, the Employee Rating Table in Excel can be a valuable tool for performance management. Here are some ways to utilize it effectively:
- Identify high-performing employees for recognition and rewards.
- Detect patterns of underperformance and address them through targeted coaching, training, or performance improvement plans.
- Facilitate meaningful discussions during performance reviews by providing clear, objective data on employee performance.
- Analyze trends in employee performance over time to inform strategic decisions related to talent development and workforce planning.
- Eventually, use the table as a basis for generating reports or dashboards to share with team leaders or upper management.
Conclusion:
In conclusion, creating an engaging and visually appealing Employee Rating Table in Excel can greatly improve the way you track and analyze employee performance. Moreover, by incorporating drop-down lists and conditional formatting with icon sets, you can create a dynamic, customizable, and user-friendly tool for performance management. Most importantly, follow the steps given in this guide and consider the tips provided for customizing and enhancing your rating table to maximize its effectiveness in your organization.
Visit our YouTube channel to learn step-by-step video tutorials
Watch the step-by-step video tutorial:
Click to buy Employee Rating Table in Excel