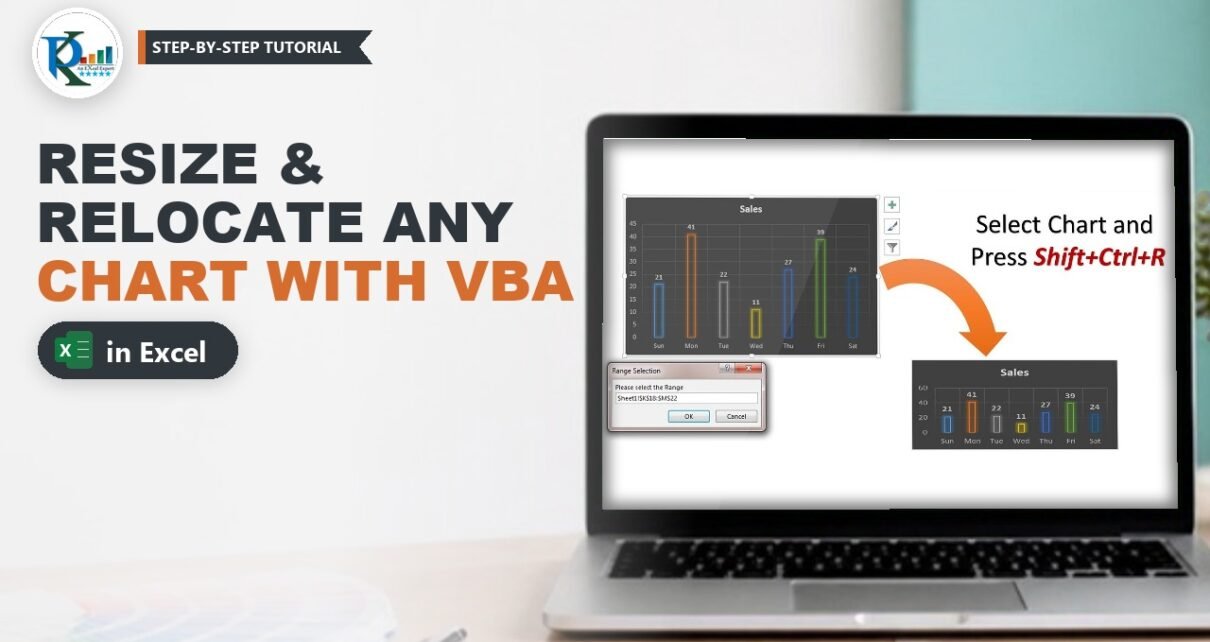
Want to resize and relocate a chart using an Excel range in one keystroke instead of dragging its corners around? In this tutorial you build a short VBA macro that does exactly that. Select any chart, press Ctrl+Shift+R, select a range with the mouse and the chart jumps to that range and takes its exact size. Select a range on a different worksheet and the chart moves there too. It is a small trick, but it saves a lot of fiddling when you line up charts on a report or a dashboard.

⬇️ Download the Resize Chart Workbook
.zip containing a macro-enabled .xlsb · 2 sample charts · shortcut Ctrl+Shift+R already assigned
Watch the Video Tutorial
PK first demonstrates the shortcut on a pie chart and a column chart, including moving a chart to another sheet, then explains the macro line by line and assigns the shortcut key.
What You Will Build
- A Resize_Chart macro that fits the selected chart to any range you pick.
- A range picker made with
Application.InputBoxType 8, so you select the target area with the mouse. - Built-in validation that warns you when no chart is selected.
- Cross-sheet moves: pick a range on another sheet and the chart moves there.
- A keyboard shortcut, Ctrl+Shift+R, to run it in a second.
The Sample Workbook
The download has four sheets. Sheet1 holds a small table in A1:B8 with daily sales: Sun 21, Mon 41, Tue 22, Wed 11, Thu 27, Fri 39 and Sat 24. Two charts use that data: a 3-D pie chart and a dark column chart. Sheet2 to Sheet4 are empty, so you can practise moving the charts between sheets. The file is saved as a macro-enabled binary workbook (.xlsb), so click Enable Content when you open it.
Resize and Relocate a Chart: How It Works
Step 1: Select the chart and press Ctrl+Shift+R
Click once on any chart so it is active, then press Ctrl+Shift+R. A box titled Range Selection asks you to Please select the Range.
Step 2: Select the target range
Drag over the cells where the chart should sit, for example a block of 7 rows by 5 columns, and click OK. The chart moves to the top-left corner of that range and stretches or shrinks to its exact height and width.
In the video PK fills a range with a light colour first and then fits the chart to it. When you move the chart aside afterwards, the coloured block is exactly underneath: the chart covered it perfectly.
Step 3: Move a chart to another sheet
Run the shortcut again, but this time click the Sheet2 tab while the Range Selection box is open and select a range there. Click OK and the chart is moved to Sheet2, already sized to the range. You can do the same with Sheet3 or Sheet4.
The VBA Code
Open the Visual Basic Editor with Developer → Visual Basic or Alt+F11, insert a module (Insert → Module) and paste this macro. It is the exact code from the workbook:
Sub Resize_Chart()

Dim cht As Chart

On Error Resume Next
    Set cht = ActiveChart
On Error GoTo 0

If cht Is Nothing Then
    MsgBox "Please select the chart"
    Exit Sub
End If

Dim rng As Range
Set rng = Application.InputBox("Please select the Range", "Range Selection", Type:=8)

'Chart Object is the parent of Chart

cht.Parent.Top = rng.Top
cht.Parent.Left = rng.Left
cht.Parent.Height = rng.Height
cht.Parent.Width = rng.Width

cht.Location xlLocationAsObject, rng.Parent.Name   'Worksheet name is the parent of range

End Sub
How the Code Works, Line by Line
1. Find the selected chart
Dim cht As Chart creates a variable for the chart, and Set cht = ActiveChart points it at the chart you selected. If no chart is selected, that line could raise an error, so it sits between On Error Resume Next and On Error GoTo 0. The first tells VBA to skip the error; the second turns normal error handling back on straight away.
2. Validate the selection
If no chart was selected, cht is still Nothing. The If cht Is Nothing block shows the message Please select the chart and stops the macro with Exit Sub. That is the macro’s validation step.
3. Ask for the range
Application.InputBox(..., Type:=8) opens a box where you can select cells with the mouse. Type 8 means a cell reference, as a Range object, which is why the result goes into a Range variable with Set. The prompt is Please select the Range and the title is Range Selection. If you are new to this box, read the VBA.InputBox vs Application.InputBox tutorial first.
4. Copy the range’s position and size
Here is the key idea. A chart on a worksheet lives inside a container called a ChartObject, and it is the container you move and resize, not the chart itself. In VBA the ChartObject is the parent of the chart, so cht.Parent gives you that container. The four lines set its Top, Left, Height and Width to the same values as the selected range, so the chart lands exactly on top of the cells.
5. Move it to the range’s worksheet
cht.Location xlLocationAsObject, SheetName places the chart as an embedded object on the sheet you name. The macro does not know the sheet name, but it knows the range, and the parent of a range is its worksheet. So rng.Parent.Name returns the name of the sheet you selected the range on. If you stayed on the same sheet, the name is the same and the chart simply stays where the previous lines put it.
Assign the Shortcut Key Ctrl+Shift+R
- Go to Developer → Macros (or View → Macros → View Macros).
- Select Resize_Chart and click Options.
- In the Shortcut key box type a capital R. Excel shows it as Ctrl+Shift+R.
- Click OK and close the Macro dialog.
Using a capital letter adds Shift to the shortcut, which keeps Excel’s own Ctrl+R (Fill Right) working. In the downloaded workbook this shortcut is already assigned.
Common Errors and Fixes
The errors below and the Tips section are additions from general VBA practice; they are not covered in the video.
Run-time error 424 when you click Cancel
On Cancel, Application.InputBox returns False instead of a range, and Set rng = False fails with Object required. Guard the line like this:
On Error Resume Next
Set rng = Application.InputBox("Please select the Range", "Range Selection", Type:=8)
On Error GoTo 0
If rng Is Nothing Then Exit Sub
Error on a chart sheet
The macro is built for charts embedded on a worksheet. On a separate chart sheet the parent of the chart is the workbook, which has no Top or Left property, so the macro stops. Move the chart onto a worksheet first with Chart Design → Move Chart → Object in.
The shortcut does nothing
Macros are disabled, or the workbook holding the macro is not open. Enable content, and keep the file saved as .xlsb or .xlsm so the code is not lost.
Tips
- To use the shortcut in every workbook, store the macro in your Personal Macro Workbook (PERSONAL.XLSB).
- Plan dashboards on the grid: colour the target blocks first, then fit each chart to its block, just like in the video.
- For a quick manual alternative, hold Alt while you drag or resize a chart and it snaps to the cell gridlines.
- Microsoft documents the container object in the ChartObject object reference.
Want It Ready-Made?
If you want finished macro tools rather than building each one, the Excel VBA Tools & Utilities Pack on NextGenTemplates.com bundles eight premium VBA templates. For ready-to-use chart designs, browse the Excel charts and visualization templates.
Related Tutorials
- VBA.InputBox vs Application.InputBox in Excel VBA (All 7 Types)
- Make Selected Shapes, Charts and Pictures the Same Size with One Click
- Useful Excel Shortcut Keys
- Free Excel Dashboard Templates and Tutorials
- Learn Excel VBA Step by Step: PK’s VBA Course
Frequently Asked Questions
How do I resize a chart to fit a range of cells in Excel?
Set the chart object’s Top, Left, Height and Width to the same properties of the range. The Resize_Chart macro in this tutorial does that for any range you select with the mouse.
Why does the code use cht.Parent instead of cht?
An embedded chart sits inside a ChartObject, and only the ChartObject has a position and size on the sheet. The ChartObject is the parent of the chart, so cht.Parent is what you move and resize.
Can the macro move a chart to another worksheet?
Yes. Select the target range on any sheet while the Range Selection box is open. The Location method then places the chart on that sheet, using the range’s parent to get the sheet name.
How do I set the Ctrl+Shift+R shortcut?
Open Developer, Macros, select Resize_Chart, click Options and type a capital R in the Shortcut key box. The capital letter makes it Ctrl+Shift+R.
What happens if no chart is selected?
The macro shows the message Please select the chart and stops, because the chart variable is still Nothing.
About the Author
PK is a Microsoft Excel expert and trainer and the founder of PK: An Excel Expert and NextGenTemplates.com. He has been teaching Excel, VBA, Power Query and Power BI since 2016 on his YouTube channel.
Conclusion
With fewer than 20 lines of VBA you can resize and relocate a chart using an Excel range: ActiveChart finds the chart, Application.InputBox Type 8 lets you pick the cells, the chart’s parent takes the range’s position and size, and Location moves it to the range’s sheet. Assign Ctrl+Shift+R and lining up charts on any report becomes a two-second job. Download the workbook and try it on the sample charts.