Managing projects can often be a daunting task, particularly when it comes to keeping track of progress and presenting it in a visually engaging way. This is where animated progress circle charts come into play. These charts provide a visually appealing and easily understandable representation of project completion status. In this article, we will explore how to create stunning animated progress circle charts for project tracking in Excel. Additionally, we will discuss the advantages of using these charts, the opportunities for improvement, and the best practices to follow.
Two Versions for Enhanced Visual Appeal: Black and White Backgrounds
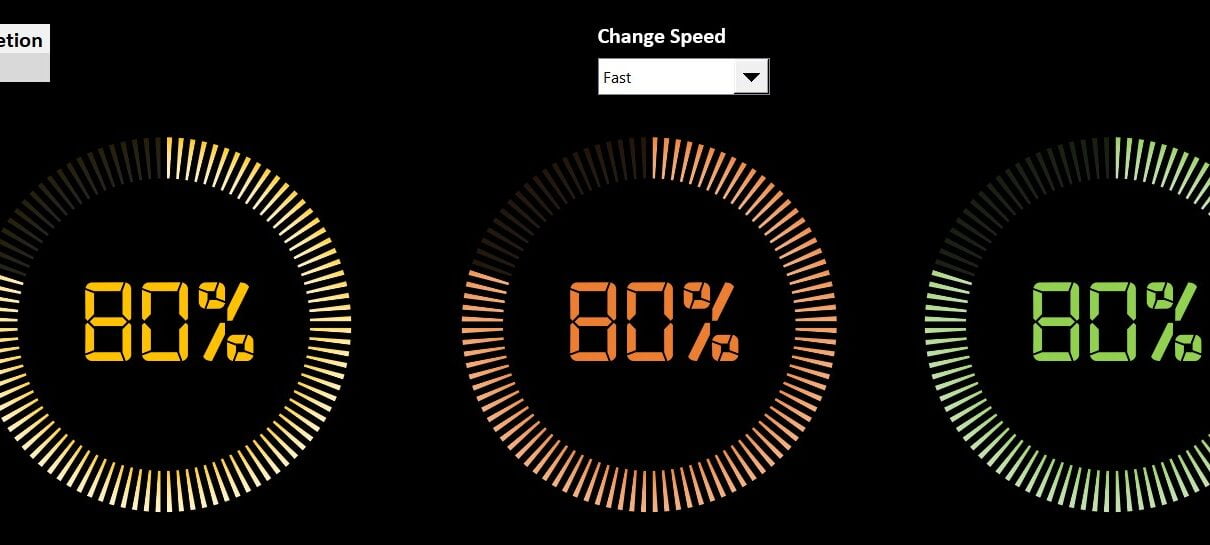
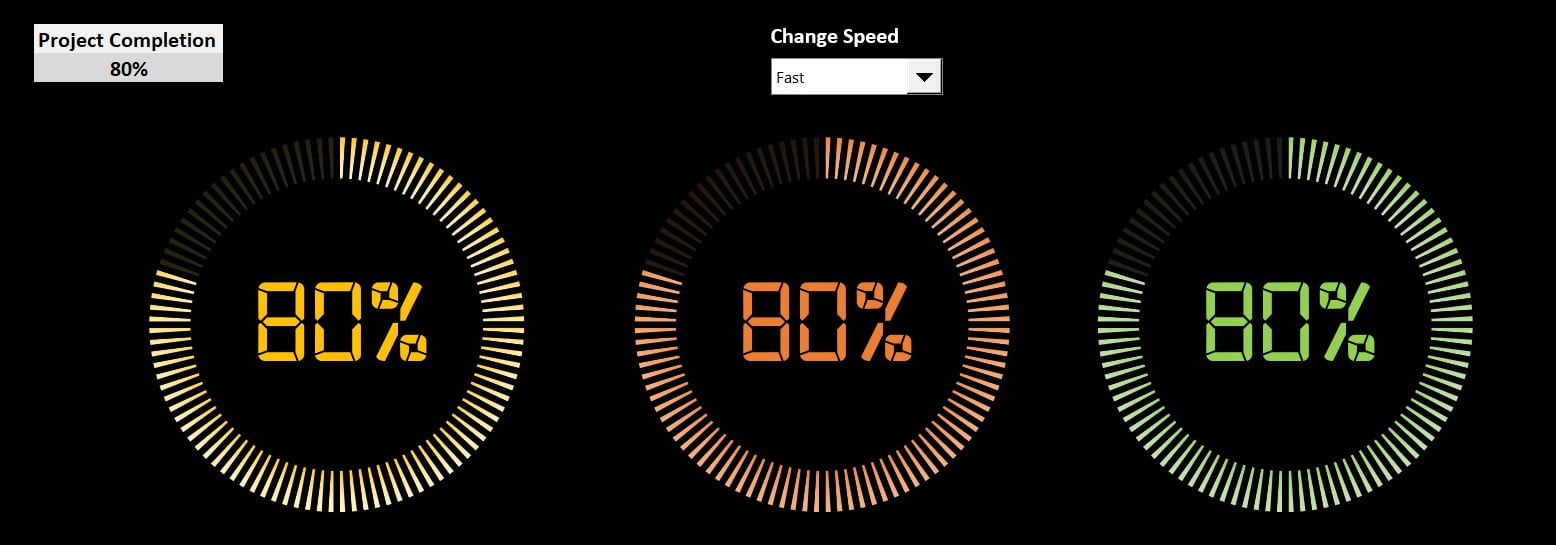
Black Background Version
Click to buy Excel Magic: Stunning Animated Progress Circle Charts for Project Tracking
The black background version of the animated progress circle chart offers a sleek, modern look. Notably, the contrast between the dark background and vibrant progress circles creates a visually striking effect, drawing attention to the project’s progress. Consequently, this version is ideal for presentations with a dark theme or for those looking to create a bold visual statement.
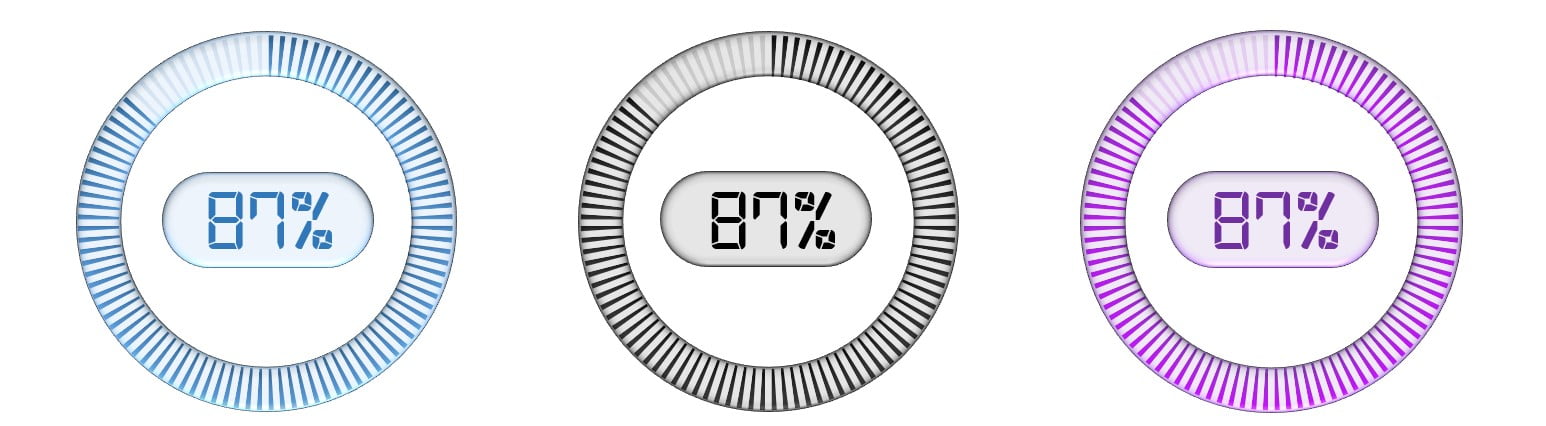
White Background Version
Click to buy Excel Magic: Stunning Animated Progress Circle Charts for Project Tracking
The white background version of the animated progress circle chart provides a clean, minimalist aesthetic. With a lighter background, the focus remains on the progress circles, allowing for easy interpretation of the project’s status. Consequently, this version is well-suited for presentations with a light theme or for those preferring a more subtle visual approach.
By offering two distinct versions of the animated progress circle chart, you can cater to diverse visual preferences and presentation styles. Whether you opt for the bold, modern look of the black background version or the clean, minimalist appeal of the white background version, both charts are designed to effectively communicate project progress and engage your audience. Ultimately, choose the version that best aligns with your project’s visual identity and enhance your project tracking experience.
Creating Animated Progress Circle Charts for Project Tracking in Excel
Combining Doughnut and Pie Charts
To create an animated progress chart, we have used a combination of Doughnut and Pie charts. This combination allows for a visually engaging and dynamic representation of project progress.
Customizing Animation Speed with a Form Control ComboBox
To give users control over the animation speed, we have incorporated a Form Control ComboBox. This allows users to choose between Fast, Medium, and Slow animation speeds.
Using VBA Code to Animate the Chart
The following VBA code has been used to animate the chart:
Option Explicit

Private Sub Worksheet_Change(ByVal Target As Range)

If Target.Address = "$B$3" Then

Dim i As Integer

Dim Speed_Value As Integer

If ActiveSheet.Range("Q1").Value = "Fast" Then
Speed_Value = 200
ElseIf ActiveSheet.Range("Q1").Value = "Medium" Then
Speed_Value = 500
Else
Speed_Value = 1000
End If

For i = 0 To Target.Value * Speed_Value
VBA.DoEvents
ActiveSheet.Range("D2").Value = i / Speed_Value
Next i


End If

End Sub
Explanation of the VBA code:
- The code initially checks if the target cell address is “$B$3”. If so, it proceeds with the animation.
- Next, it initializes two variables, ‘i’ and ‘Speed_Value’.
- Based on the selected animation speed, it assigns the appropriate value to ‘Speed_Value’.
- Subsequently, a loop runs from 0 to the target value multiplied by ‘Speed_Value’, updating the value in cell “D2” with each iteration. This creates the animation effect.
Displaying Data Labels with Digital Font
To make the data labels stand out, we have used a digital font. A text box is created over the chart, connected to cell D2, and the font is changed to a digital font.
You can download and install the digital font from this link:
https://www.1001fonts.com/digital-fonts.html
Advantages of Animated Progress Circle Charts
Instantly Understandable:
Progress circle charts are an easy-to-understand visual representation of project completion status. They provide a clear overview of project progress at a glance.
Engaging Visuals:
The animated nature of these charts captures the attention of viewers, making it more likely for them to engage with the content.
Customizable:
Animated progress circle charts can be tailored to match your project’s specific needs, including colors, styles, and animation speed.
Opportunity for Improvement in Project Tracking
Real-Time Updates:
By integrating these charts into your project management dashboard, you can allow for real-time progress updates, facilitating more efficient decision-making.
Advanced Analytics:
Incorporating additional data points into the chart can provide deeper insights into project performance.
Collaboration:
Animated progress circle charts can be shared across teams, fostering communication and collaboration on project progress.
Best Practices for Animated Progress Circle Charts
Keep It Simple:
Avoid cluttering the chart with too much information. Focus on the key project progress metrics.
Choose the Right Animation Speed:
Ensure the animation speed is not too fast or too slow, making it easy for viewers to understand the progress.
Consistent Styling:
Ensure that the chart’s design is consistent with your organization’s branding and other project visuals.
Conclusion
First and foremost, animated progress circle charts are an effective tool for visually representing project completion status. In addition, by following the steps outlined in this article, you can create stunning and engaging progress circle charts in Excel to significantly enhance your project tracking capabilities. Moreover, by understanding the advantages of these charts and implementing best practices, you can improve project management efficiency and collaboration across your team.
Consequently, using progress circle charts can positively impact your project management efforts. Therefore, it’s crucial to take advantage of this powerful tool to effectively communicate your project’s progress. As a result, take your project tracking to the next level with these visually appealing and customizable animated progress circle charts, which will ultimately lead to better project outcomes and increased team satisfaction.
Frequently Asked Questions
Q. What are Animated Progress Circle Charts?
Animated Progress Circle Charts are visually engaging charts that display project completion status in a circular format. Utilizing a combination of Doughnut and Pie charts, they create an appealing and easy-to-understand visual representation of project progress.
Q. Why should I use Animated Progress Circle Charts for Project Tracking?
These charts provide several advantages, including easy comprehension of project status, visually engaging presentation, and customization options. Moreover, they can also improve project management efficiency by offering real-time updates and fostering collaboration across teams.
Q. How do I customize the animation speed in the progress circle chart?
The animation speed can be customized using a Form Control ComboBox. Users can select between Fast, Medium, and Slow animation speeds to suit their preferences.
Q. Can I use a different font for the data labels?
Yes, you can use any font for the data labels. In the example provided, we used a digital font to create a unique visual effect. However, you can choose any font that aligns with your project’s visual identity.
Q. How do I choose between the black and white background versions of the progress circle chart?
Initially, the choice between the black and white background versions depends on your project’s visual identity and personal preference. Furthermore, the black background version offers a bold, modern look, whereas the white background version provides a clean, minimalist aesthetic. Subsequently, you should choose the version that best fits your presentation style and project branding.
In addition, considering the visual impact of the chosen background is essential for ensuring a cohesive and engaging presentation. Consequently, taking the time to carefully evaluate each option will ultimately lead to a more polished and professional end result. Thus, by selecting the appropriate background, you can effectively enhance your project’s overall visual appeal and successfully convey your message.
Q. Can I integrate the progress circle chart into my existing project management dashboard?
Yes, you can easily integrate the animated progress circle chart into your existing project management dashboard. By doing so, you can benefit from real-time progress updates, advanced analytics, and improved communication and collaboration within your team.
Q. Is it possible to add more data points to the progress circle chart?
Absolutely. The progress circle chart can be customized to incorporate additional data points, providing deeper insights into project performance. However, it’s essential to avoid cluttering the chart with too much information to maintain clarity and simplicity.
Visit our YouTube channel to learn step-by-step video tutorials
Watch the step-by-step video tutorial:
Click to buy Excel Magic: Stunning Animated Progress Circle Charts for Project Tracking