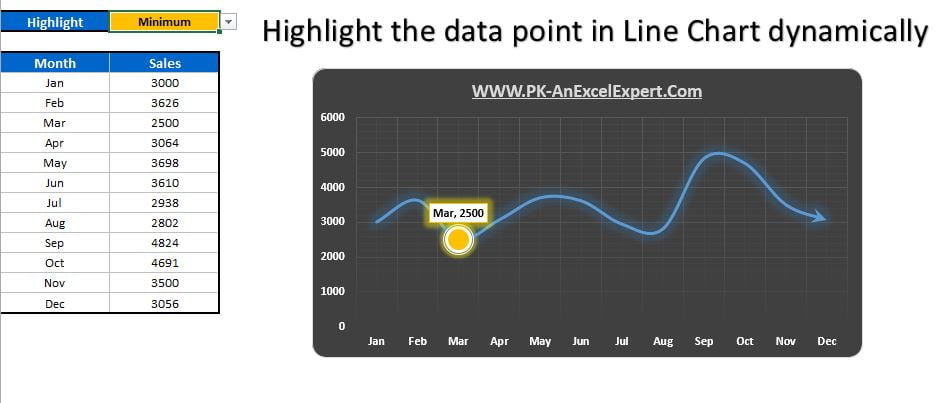
In this chart we have explained how to Highlight the Specific data point in a Line Chart Dynamically. You can highlight the Minimum, Maximum and Selected data points in a beautiful line chart. This chart can be used in Business Dashboard or Presentation.
Highlight the Specific data point in a Line Chart Dynamically
Minimum data point:
Below is the snapshot to highlight Minimum data point on the line chart. You can select Minimum in the Highlight drop-down.
Click to buy Highlight the Specific data point in a Line Chart Dynamically
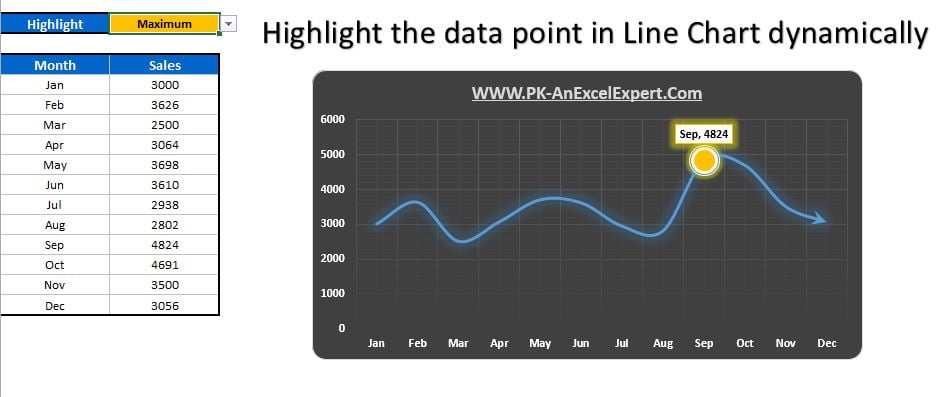
Maximum data point:
Below is the snapshot to highlight Maximum data point on the line chart. You can select Maximum in the Highlight drop-down.
Click to buy Highlight the Specific data point in a Line Chart Dynamically
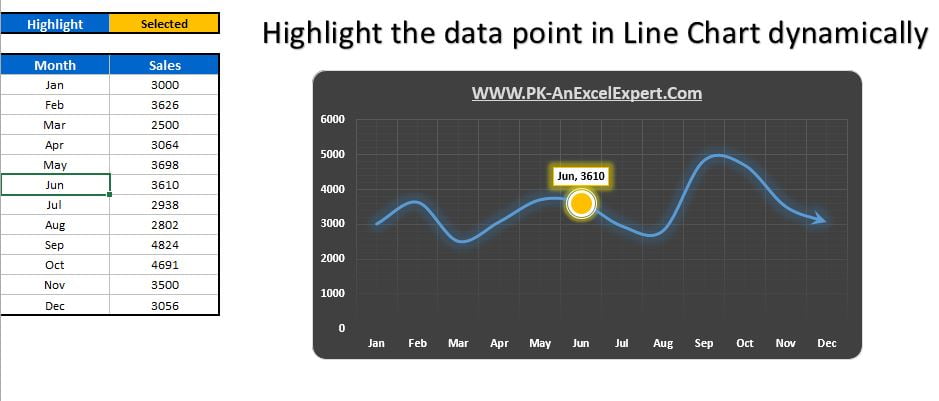
Selected data point:
Below is the snapshot to highlight Selected data point on the line chart. You can select Selected in the Highlight drop-down. Now you can click on any month that month will be highlighted in the chart.
Visit our YouTube channel to learn step-by-step video tutorials
Click to buy Highlight the Specific data point in a Line Chart Dynamically
Watch the step-by-step video tutorial:
Click to buy Highlight the Specific data point in a Line Chart Dynamically