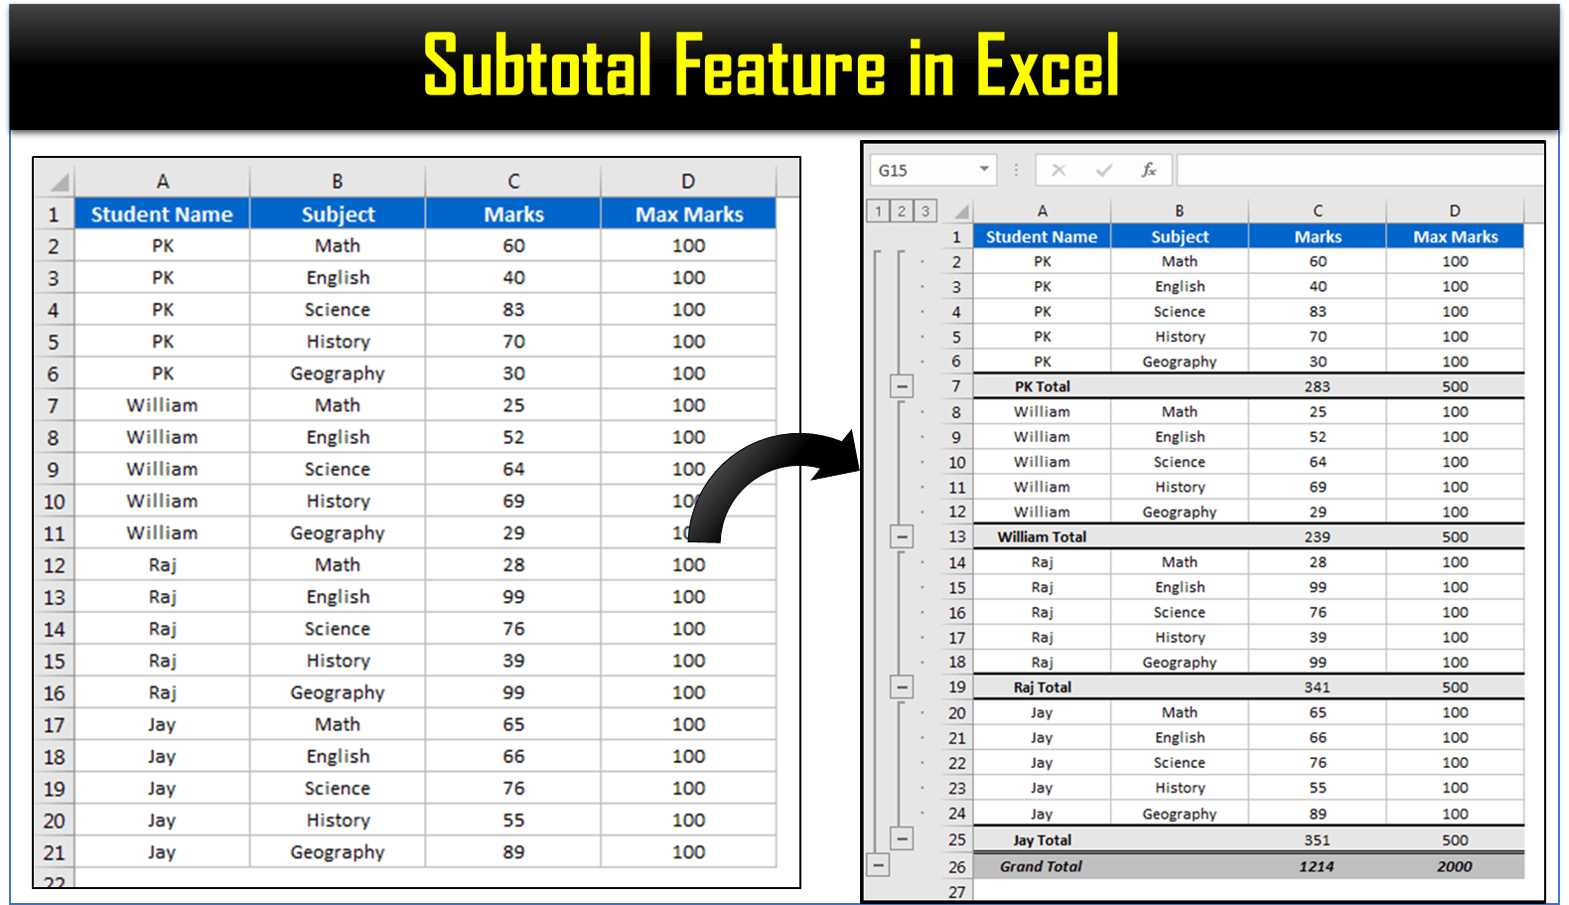
The Subtotal feature in Excel adds a total after every group in a sorted list, adds a grand total at the bottom and builds an outline, so you can collapse the sheet to just the totals with one click. In this tutorial you will build the same student-wise marks report twice: first by hand with the SUBTOTAL function and Group, so you understand what happens behind the scenes, then in seconds with Data > Subtotal. You will also see what the Summary below data and Page break between groups options do.
⬇️ Download the Practice File
3 sheets: Student wise marks, With Subtotal, Sales · .xlsx (no macros)
Watch the Video Tutorial
In the video PK builds the subtotal report manually with SUBTOTAL and Group, recreates it in one step with the Subtotal command, then shows the summary-position and page-break options on a sales list.
What You Will Build
- A total row after each student (PK Total, William Total, Raj Total, Jay Total) for Marks and Max Marks.
- A grand total that ignores the student totals, so nothing is counted twice.
- A three-level outline: level 1 shows the grand total, level 2 the student totals and level 3 every row.
- Clean formatting for the total rows using the visible-cells-only trick.
- Printed reports with one group per page.
The Sample Data
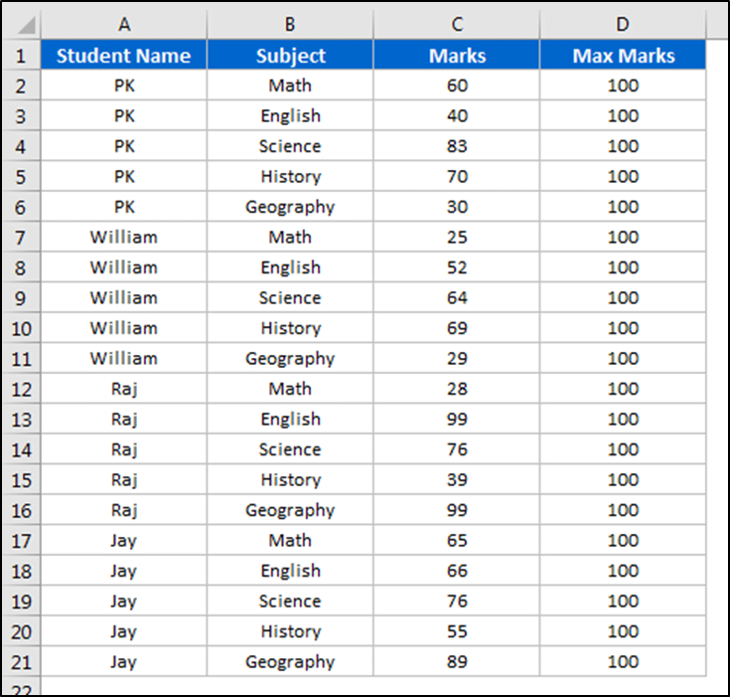
The Student wise marks sheet has four columns in A1:D21: Student Name, Subject, Marks and Max Marks. Each of the four students (PK, William, Raj and Jay) has five subjects: Math, English, Science, History and Geography, each out of 100.
One rule matters before anything else: the data must be sorted by the column you want to group on. Subtotal starts a new group every time the value in that column changes, so if PK appears in two separate places, you get two PK totals.
Part 1 – Build the Subtotal Report Manually
Doing it once by hand shows you exactly what the Subtotal command creates for you.
Step 1: Copy the data and insert total rows
Copy the data to a new sheet (PK also turns off View > Gridlines for a cleaner look). Insert a blank row after each student and type the labels PK Total, William Total, Raj Total and Jay Total in column A, then Grand Total under the last row. The total rows end up in rows 7, 13, 19 and 25, with the grand total in row 26.
Step 2: Add the SUBTOTAL formulas
In the PK Total row enter:
C7  =SUBTOTAL(9,C2:C6)

D7  =SUBTOTAL(9,D2:D6)
Copy the same pattern to the other total rows (C13 uses C8:C12, C19 uses C14:C18 and C25 uses C20:C24). For the grand total use SUBTOTAL again over the whole block:
C26  =SUBTOTAL(9,C2:C24)

D26  =SUBTOTAL(9,D2:D24)
How the formula works
- The first argument,
9, tells SUBTOTAL to sum. Other numbers give other calculations, such as 1 for Average and 2 for Count. - The big advantage: SUBTOTAL ignores any other SUBTOTAL results inside its range. The grand total range includes PK Total, William Total and Raj Total, but they are skipped, so the result is the correct 1214 marks out of 2000.
- If you use
SUMfor the grand total instead, it adds the student totals as well as the marks and returns 2428, exactly double. That is why every total in this report uses SUBTOTAL.
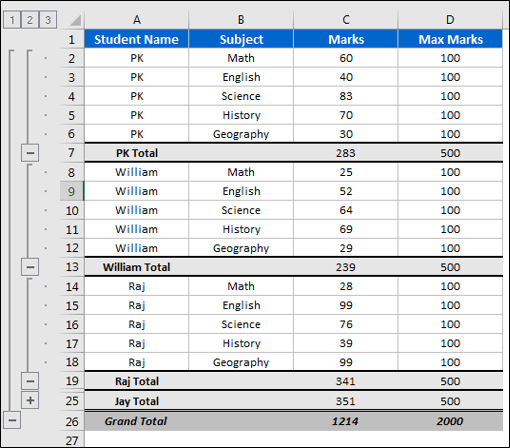
The student totals are 283 for PK, 239 for William, 341 for Raj and 351 for Jay, each out of 500.
Step 3: Group the rows to build the outline
Select rows 2 to 25 (click a cell range and press Shift+Space to select the entire rows), then go to Data > Group. This first group lets you collapse everything down to the Grand Total. Next, select each student’s subject rows (2 to 6 for PK, 8 to 12 for William and so on) and click Group again for each one.
The numbers 1, 2 and 3 appear at the top left. Click 1 to see only the grand total, 2 to see the student totals and 3 to see every row. The plus and minus buttons open or close a single student.
Step 4: Format the grand total
Select the Grand Total row cells, remove the borders first (Home > Borders > No Border, or Alt, H, B, N), add a dark grey fill, make the text bold and italic, then use More Borders to add a double line at the top.
Step 5: Format only the visible total rows
Click outline level 2 so only the student totals and the grand total are visible. Select the range and then select visible cells only, otherwise your formatting also lands on the hidden subject rows:
- Press Alt+; (Alt and semicolon), or
- Go to Home > Find & Select > Go To Special (or press Ctrl+G and click Special) and choose Visible cells only.
Now apply a light grey fill, remove the borders and add a top and bottom border. Click level 3 again and only the total rows are formatted.
Part 2 – Use the Subtotal Feature in Excel (the Fast Way)
With a long list the manual method is slow. The Subtotal command does Steps 1 to 3 in one go.
Step 6: Open the Subtotal dialog
Click anywhere in the sorted data (or select it) and go to Data > Subtotal, in the Outline group.
Step 7: Choose the settings
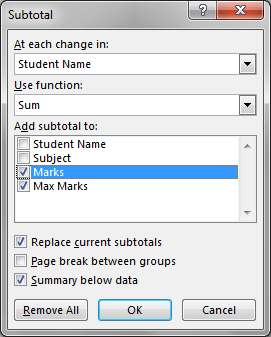
- At each change in: Student Name – a new total starts whenever the name changes.
- Use function: Sum.
- Add subtotal to: tick Marks and Max Marks.
- Replace current subtotals: ticked (it makes no difference the first time).
- Summary below data: ticked, so totals appear under each group.
Click OK. Excel inserts the four student total rows and the Grand Total, writes the same SUBTOTAL(9,...) formulas you typed by hand and builds the 1-2-3 outline automatically.
Step 8: Format the totals
The only thing Subtotal does not do is formatting. Repeat Steps 4 and 5: click level 1 and style the Grand Total, then click level 2, press Alt+; and style the student totals. The With Subtotal sheet in the practice file shows the finished result.
Part 3 – More Subtotal Options
The Sales sheet lists sales for five employees (Emp-1 to Emp-5) across three locations, sorted by Employee Name. Use it to try the remaining options.
Step 9: Summary below data (totals on top)
Open Data > Subtotal, choose Employee Name, Sum and Sales, and untick Summary below data. The Grand Total now appears at the top, and each employee’s total sits above that employee’s rows. Tick the option again (with Replace current subtotals ticked) to move the totals back below the data.
Step 10: Page break between groups
Without this option, a print preview (Ctrl+P) shows the whole list on one page. Open Subtotal again, tick Page break between groups and click OK. Now the print preview has five pages, one per employee.
Removing and Extending Subtotals (Addition)
These points are additions to the video, based on standard Excel behaviour.
- Remove subtotals: open Data > Subtotal and click Remove All. The total rows and the outline disappear and your original list returns.
- Other calculations: change Use function to Count, Average, Max or Min to get those per group instead of a sum.
- Two levels of subtotals: sort by two columns, run Subtotal on the first, then run it again on the second with Replace current subtotals unticked, so the first set stays.
- Filtered lists: SUBTOTAL always skips rows hidden by a filter. Use 109 instead of 9 if you also want it to skip rows you hid manually. Keep 9 in an outlined report like this one: collapsing a group hides its rows, so with 109 the totals would change when you collapse the outline.
Modern Excel Alternative (Addition)
In Microsoft 365 you can get student totals with one formula on another sheet, without changing the source list at all:
=GROUPBY('Student wise marks'!A2:A21,'Student wise marks'!C2:D21,SUM)GROUPBY lists each student once with the summed Marks and Max Marks and adds a total row, and it updates as the data changes. A PivotTable does the same in every Excel version.
Common Errors and Fixes
The same name gets several totals
The data is not sorted by the grouping column. Click Remove All, sort by that column (Data > Sort A to Z) and run Subtotal again.
The grand total is double the real total
The grand total uses SUM, which also adds the group totals. Use =SUBTOTAL(9,range) so the group totals are ignored.
The Subtotal button is greyed out
Your data is an Excel Table. Subtotal only works on a normal range, so use Table Design > Convert to Range first, or use the Total Row and a PivotTable instead. (Addition.)
Formatting spreads to the hidden rows
You formatted the selection without choosing visible cells only. Press Alt+; after selecting and before formatting.
Tips
- Collapse to level 2 and copy with Alt+; to paste just the totals into a summary sheet.
- Use Page break between groups when you print a report per person, branch or region.
- Microsoft’s reference for the SUBTOTAL function lists every function number.
Want It Ready-Made?
If you need finished reports and trackers rather than building them from scratch, browse the Excel templates on NextGenTemplates.com. To go from subtotals to PivotTables, slicers and full dashboards step by step, join the video course Excel Pivot Tables and Dashboards.
Related Tutorials
- Subtotal Magic in Excel – Quick Guide
- GROUPBY and PIVOTBY Functions in Excel with Real-World Examples
- 10 Useful Pivot Table Tips
- Excel Tips: Sort Data by a Custom List
- COUNTIF and SUMIF Tricks with Specific Conditions
Frequently Asked Questions
Where is the Subtotal feature in Excel?
It is on the Data tab, in the Outline group, next to Group and Ungroup. Click inside a sorted list and choose Subtotal to open the dialog.
Why do I need to sort the data before using Subtotal?
Subtotal starts a new group every time the value in the chosen column changes. If the list is not sorted, the same name appears in several blocks and gets several separate totals.
Why does SUBTOTAL give the right grand total when SUM doubles it?
SUBTOTAL ignores other SUBTOTAL results inside its range, so the group totals are skipped. SUM adds everything, including the group totals, which doubles the result.
What does Summary below data do?
When it is ticked, each total appears under its group and the grand total is at the bottom. When it is unticked, the totals and the grand total move above the data.
How do I print each group on a separate page?
Tick Page break between groups in the Subtotal dialog. Excel inserts a page break after every group, so each employee or student prints on its own page.
How do I remove subtotals in Excel?
Click inside the list, open Data, Subtotal and click Remove All. The total rows and the outline are removed and the original data stays.
About the Author
PK is a Microsoft Excel expert and trainer and the founder of PK: An Excel Expert and NextGenTemplates.com. He has been teaching Excel, Power Query and Power BI since 2016 on his YouTube channel.
Conclusion
The Subtotal feature in Excel turns a sorted list into a grouped report in one step: a SUBTOTAL formula after every group, a grand total that never double-counts and a 1-2-3 outline to show or hide the detail. Building it once by hand shows why it works; after that, Data > Subtotal, a little formatting with Alt+; and the page-break option give you a print-ready report in under a minute.