Crafting a Project Plan (Gantt Chart) in Excel can initially appear to be an intimidating task. This is particularly true for those who are not well-versed with the nuances of this multi-faceted tool. However, when armed with the correct guidance and a touch of patience, it’s entirely possible for anyone to successfully create an efficient Gantt Chart. Consequently, this article is here to serve as your comprehensive guide to creating a Gantt Chart in Excel, demonstrating the simplest methods of crafting a Gantt chart, and outlining the best practices that should be followed.
What is a Project Plan (Gantt Chart)?
Before we dive into the nitty-gritty details, it’s crucial to kick things off by clearly defining what a Gantt Chart is. In essence, a Gantt Chart is a visual depiction of a project timeline. It effectively displays the start and end dates of various tasks within a given project. For project managers, it’s an incredibly beneficial tool, as it aids them in scheduling, coordinating, and tracking specific tasks associated with a project.
Why Excel for a Gantt Chart?
MS Excel is a widely accessible and user-friendly tool. Its versatility and power make it one of the best platforms for creating Gantt Charts. You can use Excel to create a simple Gantt Chart or even complex ones with dynamic functionalities. The possibilities are endless!
How to Create a Project Plan (Gantt Chart) in Excel?
Creating a Gantt Chart in Excel doesn’t require any special templates or add-ons. It can be done using the standard Excel functionalities. Here’s a simple guide on how to create a Gantt Chart in Excel:
Click to buy Project Plan Gantt Chart in Excel
Start by Identifying Your Tasks:
Firstly, list down all the tasks associated with your project. This includes everything from the inception to the project’s completion. Your task list serves as the foundation for your Gantt Chart.
Determine Task Durations:
Next, estimate the time it will take to complete each task. This could be in hours, days, or even months, depending on the scope of your project.
Create a Basic Excel Gantt Chart:
Now that you have your task list, durations, and Status, you can start creating your Gantt Chart in Excel. Follow the instructions given in below Video to learn how to create gantt chart using Excel sheet.
Click to buy Project Plan Gantt Chart in Excel
Customize Your Gantt Chart:
Excel allows you to customize your Gantt Chart to suit your preferences. You can change colors, add task descriptions, and even include progress bars.
Advantages of Creating a Gantt Chart in Excel
The following are some advantages of creating a Gantt chart in Excel:
- Versatility: You can customize your Gantt Chart to suit your project’s needs.
- Accessibility: MS Excel is a widely used tool, making it easy for anyone in the team to understand and update the Gantt Chart.
- Control: Creating your own Gantt Chart gives you full control over its appearance and functionality.
- Cost-Effective: There’s no need for expensive project management software. Excel is a cost-effective solution for creating Gantt Charts.
Opportunities for Improvement in Excel-based Gantt Chart
While Excel offers a great platform for creating Gantt Charts, there’s always room for improvement. Here are a few areas that could use some enhancing:
- Automation: Automating the process of updating and maintaining the Gantt Chart can significantly improve efficiency.
- Integration: Integrating your Gantt Chart with other project management tools can provide a more holistic view of the project.
- Collaboration: Enabling real-time updates and edits from multiple team members can foster better collaboration and coordination.
Best Practices for Creating a Gantt Chart in Excel
While Excel offers a robust platform for creating Gantt charts, adhering to some best practices can make the process smoother and more effective. Here are some:
Keep It Updated:
Your Gantt chart should reflect the current state of your project. Regularly update it to reflect completed tasks, changes in task duration, or shifts in deadlines.
Color-Code Tasks:
Use different colors for different types of tasks or different project phases. This can make your Gantt chart easier to read and understand.
Include Key Details:
Make sure to include all relevant information, such as task names, start and end dates, and task dependencies.
Don’t Overcomplicate:
While it’s important to include key details, don’t overcomplicate your Gantt chart with unnecessary information. Keep it simple and easy to understand.
How to Use Our Excel-based Gantt Chart
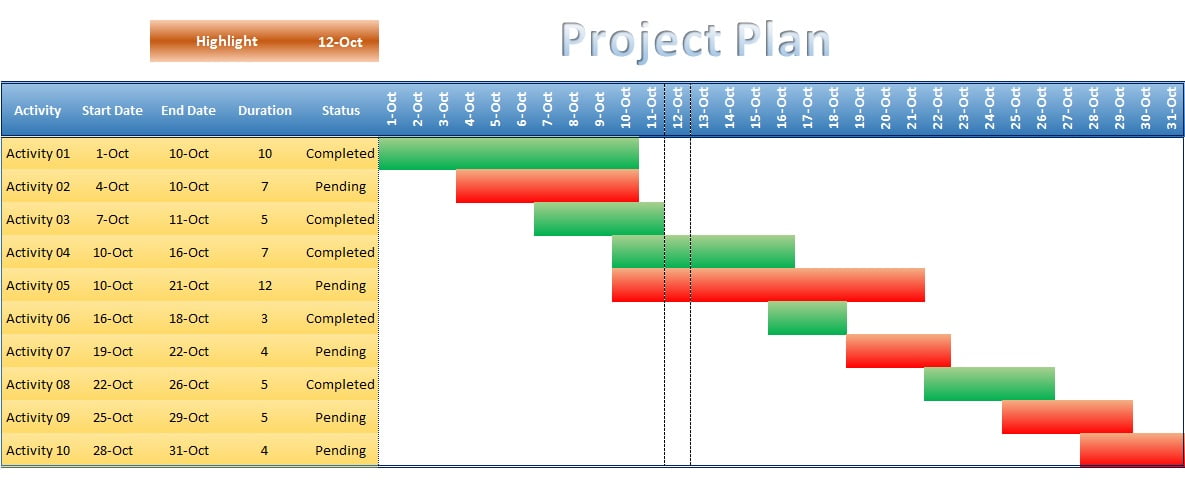
Our Excel-based Gantt chart stands as a flexible and user-friendly tool, one that can easily be adapted to a multitude of project management scenarios. Not only is it straightforward to customize, but it also comes equipped with a plethora of beneficial features. This includes conditional formatting and an especially handy highlight option that grants you the ability to mark any specific date.
In addition to this, we’ve integrated a status feature that serves as an indicator for the completion status of a task. Tasks that have been successfully marked as “completed” will be displayed in a vibrant green color, whereas “pending” tasks are shown in a more urgent red hue.
It’s important to note that our Gantt chart is meticulously protected to circumvent any accidental changes from occurring. However, in the event that you need to make adjustments, you can swiftly unprotect the worksheet using the Alt+T+P+P command sequence. Thankfully, there’s no need for you to remember a password.
Conclusion
In conclusion, utilizing MS Excel to craft a Project Plan (Gantt Chart) can be a transformative strategy for effective project management. The simplicity of creating a Gantt chart, whether from a Gantt chart smartsheet template or from scratch, alongside the customization options, makes Excel a user-friendly platform. Our Excel-based Gantt chart, a flexible project management spreadsheet, is equipped with unique features such as conditional formatting and a status highlight option, allowing it to double as a quick Gantt chart or a yearly Gantt chart template in Excel. The dynamic nature of the chart, automatically reflecting project schedule changes, positions it as a prime Gantt chart automatic in Excel. With the best practices shared in this guide, you can transform your Gantt chart into a comprehensive project management solution. So, here’s to creating your ultimate Excel Gantt chart, serving as an invaluable resource in your project management toolkit!
Frequently Asked Questions
Q. What is the easiest way to create a Gantt chart?
Undeniably, the most straightforward way to construct a Gantt chart is by employing MS Excel. All you need to do is list your tasks, make an estimate of their duration, and utilize the bar chart function to generate the Gantt chart.
Q. How can I create a Gantt chart in Excel without using any templates?
Absolutely, it is entirely possible to create a Gantt chart in Excel without the use of templates. You just need to note down your tasks, specify their start and end dates, and take advantage of the bar chart function to construct your Gantt chart.
Q. What are the best practices for creating a Gantt chart in Excel?
The most effective practices when designing a Gantt chart in Excel encompass utilizing a template, ensuring regular updates, color-coding tasks, incorporating all pertinent details, and steering clear of over-complication.
Q. How can I use your Excel-based Gantt chart in my project management tasks?
Our Excel-based Gantt chart is a versatile and user-friendly instrument that you can conveniently customize to meet your project management requirements. It is equipped with several beneficial features such as conditional formatting, a highlight option, and a status feature.
Also see our other Project Plan charts
- Dynamic Hourly Project Planner (Gantt Chart)
- Data-Driven Gantt Chart in PowerPoint with Conditional Formatting
- Power Gantt Chart (Project Planner) for Project Management
- Dynamic Project Planner (Gantt Chart) in Excel
- Quick Gantt Chart
- To-do list for multiple Projects with Summary
- Project Management Issue Tracker Form
- Project Management Dashboard
Click to buy Project Plan Gantt Chart in Excel
Visit our YouTube channel to learn step-by-step video tutorials
Click to buy Project Plan Gantt Chart in Excel