Using Gantt charts for project management is not a new concept. Still, with the advent of advanced Excel features, creating a dynamic hourly Gantt chart has become more accessible than ever. This article will guide you through the process of creating an hourly Gantt chart template in Excel, providing you with a robust tool to manage your projects effectively.
Click to buy Dynamic Hourly Gantt Chart for Projects
What is an Dynamic Hourly Project Planner (Gantt chart)?
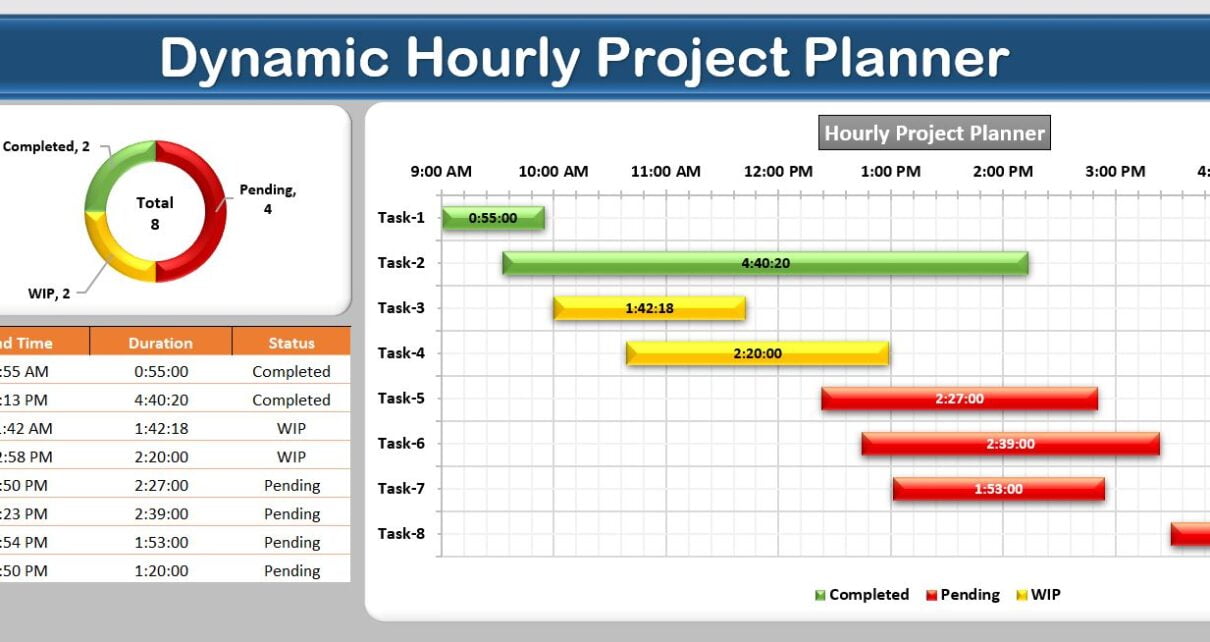
A Gantt chart is a horizontal bar chart used in project management to illustrate a project schedule. An hourly Gantt chart, as the name suggests, breaks down tasks into hourly intervals, offering a microscopic view of your project timeline.
Why Use an Hourly Gantt Chart Excel Template?
Better Task Management:
The hourly Gantt chart excel template allows project managers to plan tasks on an hour-to-hour basis. This granularity can be beneficial in managing tasks that require high precision.
Improved Resource Allocation:
By visualizing tasks at an hourly level, project managers can ensure optimal resource allocation, reducing inefficiencies and wastage.
Enhanced Communication:
Gantt charts provide a visual representation of the project timeline, making it easier to communicate the project plan, progress, and changes to all stakeholders.
Proactive Issue Identification:
An hourly Gantt chart helps identify potential bottlenecks and conflicts early, enabling proactive issue resolution.
How to Create a Dynamic Hourly Gantt Chart in Excel?
Before we delve into the process of creating an Excel hourly Gantt chart, let’s understand the main components of the template we are about to build.
Click to buy Dynamic Hourly Gantt Chart for Projects
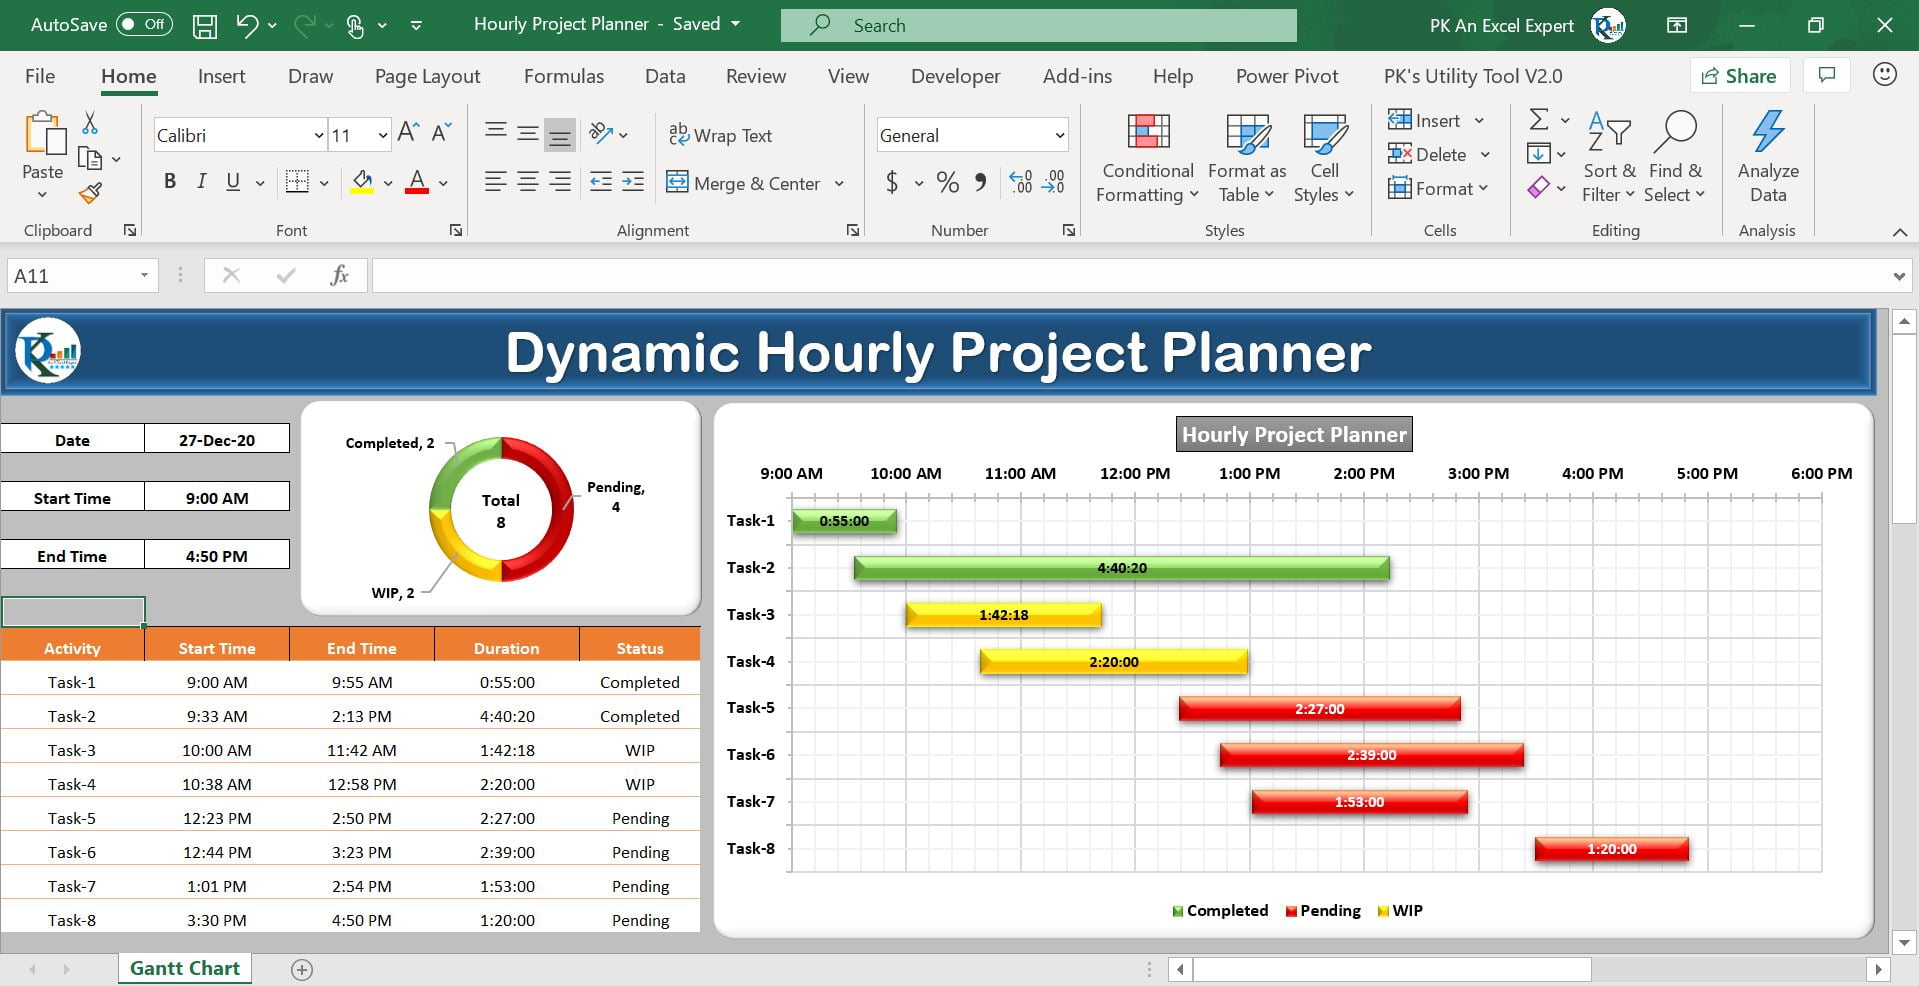
Top Section
The top section displays the Date, Project Start Time, and Project End Time. By default, the ‘Date’ is set to the current date using the TODAY() function in Excel. However, you can modify it according to your project’s needs. The Project Start Time and Project End Time are determined using the MIN and MAX functions from the Start Time and End Time columns in the data table.
Data Section
The Data Section of the template consists of five columns:
- Activity: This column is for inputting the tasks involved in your project.
- Start Time: Input the starting time of each task here.
- End Time: This column is for inputting the ending time of each task.
- Duration: This field is auto-calculated based on the Start Time and End Time.
- Status: This column allows you to mark the task as Pending, In Progress, or Completed.
You can add a new activity, and it will automatically reflect on the chart.
Hourly Gantt Chart
The Hourly Gantt Chart is a dynamic section that adjusts automatically according to the data input in the data table section. We have used conditional formatting to depict the Pending, In Progress, and Completed tasks differently on the chart.
Steps to Create the Hourly Gantt Chart
The specific steps to create the hourly Gantt chart are covered in our comprehensive video tutorial embedded below-
Click to buy Dynamic Hourly Gantt Chart for Projects
Best Practices for Using an Hourly Gantt Chart Excel Template
- Consistent Updates: Ensure that the hourly Gantt chart is regularly updated to reflect the current status of the project accurately.
- Flexible Scheduling: Allow for flexibility in scheduling to accommodate unexpected changes and delays.
- Clear Communication: Ensure all stakeholders understand how to read and interpret the Gantt chart.
Opportunities for Improvement in Dynamic Hourly Project Planning
While dynamic hourly project planning using an Excel Gantt chart offers several benefits, there’s always room for improvement:
- Integration with Other Tools: The current Excel template can be further enhanced by integrating it with other project management tools for better tracking and reporting.
- Automation: Automating the data input process can save considerable time and reduce the chances of human error.
- Visual Enhancements: While functionality is paramount, visual enhancements can improve user experience and readability.
Frequently Asked Questions
Q: Can I use the hourly Gantt chart template for a project spanning multiple days?
A: Indeed, you can certainly use the template for projects that span over multiple days. However, it’s crucial to note that you might need to adjust the chart’s date and time settings to accurately reflect the project’s actual timeline.
Q: How can I share the hourly Gantt chart with my team?
A: Since the Gantt chart is an Excel file, it can be easily shared with your team. You can do this via email, cloud storage, or even through various project management tools. Just ensure that all stakeholders have the necessary permissions to view or edit the file.
Q: Can I customize the hourly Gantt chart template?
A: Absolutely! The hourly Gantt chart template is fully customizable. This means you can add new columns, change the formatting, or even modify formulas according to your project’s requirements.
Q: Can the Gantt chart handle tasks that span less than an hour?
A: Yes, it can. You have the flexibility to adjust the Start Time and End Time in the data table to reflect tasks that take less than an hour.
Q: How can I handle overlapping tasks in the Gantt chart?
A: When it comes to overlapping tasks, they can be represented as separate bars on the Gantt chart. This useful feature helps visualize task dependencies and potential bottlenecks.
Conclusion
In conclusion, an Excel hourly Gantt chart can truly be an invaluable tool for project managers. It provides a granular view of project tasks, thereby making it easier to manage resources, communicate project status, and proactively identify potential issues. Even though the current Excel template offers robust functionality, there’s always room for improvement and customization according to specific project needs. Armed with the best practices and tips provided in this article, you’ll be equipped to make the most of this powerful project management tool.
Download our fully dynamic Project Management Dashboard
Visit our YouTube channel to learn step-by-step video tutorials
Click to buy Dynamic Hourly Gantt Chart for Projects