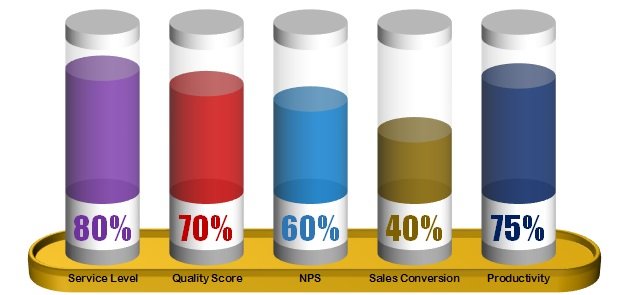
This is incredibly beautiful and stunning Chart to display multiple KPI Metrics together. In this example we have used 5 KPI metrics – Service Level, Quality Score, NPS, Sales Conversion and Productivity. You can any other metric in this chart. It can make your dashboard, report, or presentation more visually attractive.
A Stunning Chart to display the 5 KPI Metrics together
Click to buy A Stunning Chart to display the 5 KPI Metrics together
Visit our YouTube channel to learn step-by-step video tutorials
Watch the step-by-step tutorial:
Click to buy A Stunning Chart to display the 5 KPI Metrics together