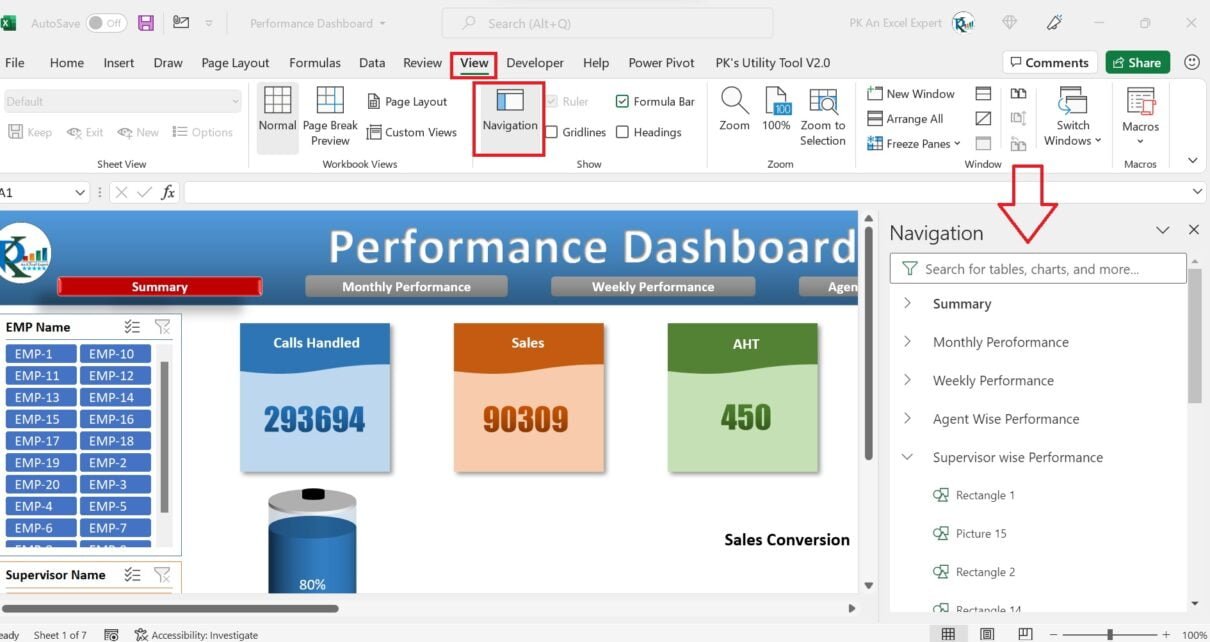
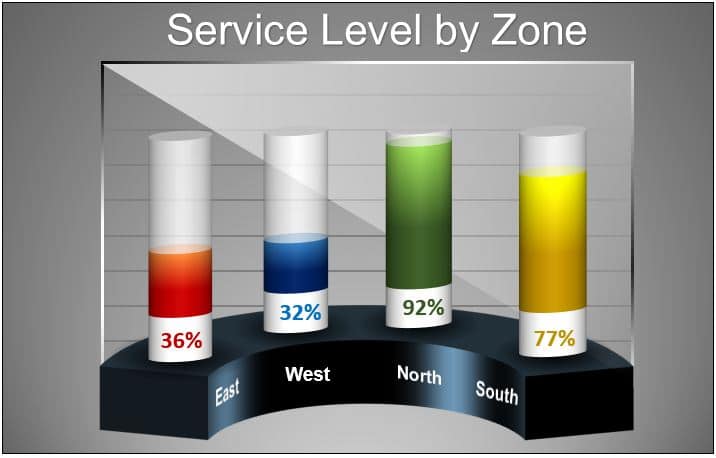
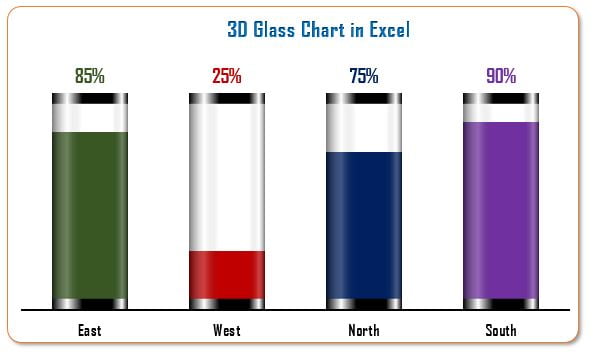
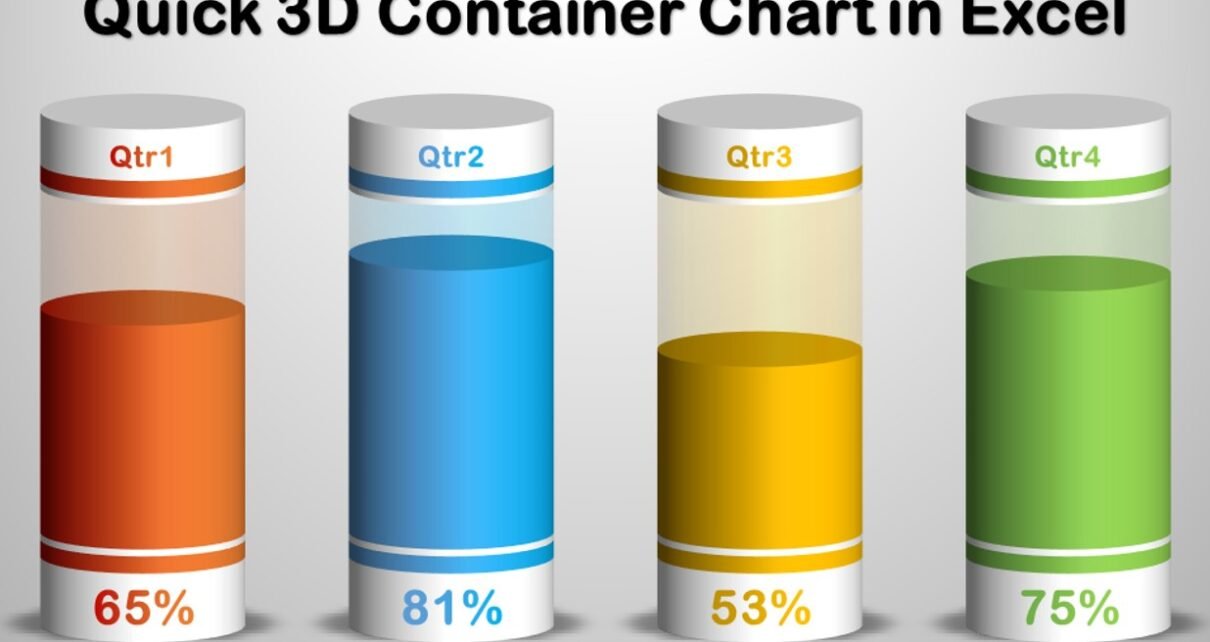
• Advanced Excel
    • Shortcut Keys
    • Useful Formulas
    • Basic Charts
    • Advanced Chart
    • Sort and Filter
    • Pivot Table
    • Data Validation
    • Conditional Formatting
    • Auto Fill and Flash Fill
  • VBA Course
  • Products
    • PK’s Utility Tool V2.0
    • PK’s Utility Tool V1.0
    • Task Management
    • AMS V1.0
    • AMS V2.0
    • Sale/Purchase Software
    • PK’s Function Kit
  • Blogs
    • Charts and Visualization
    • VBA
    • Excel Tips and Tricks
    • Templates
  • Excel Dashboard
    • Sales Dashboard
    • Process Dashboard
    • Performance Dashboard
    • PM Dashboard
    • Outbound Dashboard
    • Incentive Dashboard
    • Zonal Dashboard in Excel
    • Quick Dashboard
  • Power BI
  • About Us
  • Contact Us

PK: An Excel Expert

Online Excel Tutorials

Tag: 3D Shapes

Animated Filled Spheres
Power Point Visualization

Animated Filled Spheres in Power Point

September 23, 2019September 23, 2019 PKComments Off on Animated Filled Spheres in Power Point
3D Glass Chart
Charts and Visualization

3D Glass Chart in Excel

February 20, 2019February 20, 2019 PKComments Off on 3D Glass Chart in Excel
Digital Clock
Excel Tips and Tricks VBA

Innovation: Digital Clock in Excel

December 16, 2018December 16, 2018 PK0
Informative KPI Indicator
Charts and Visualization

Informative KPI Indicator Chart (Version-1)

November 30, 2018November 30, 2018 PK0
Slide Meter Chart (Ver-3)
Charts and Visualization

Slide Meter Chart (Version-3)

November 8, 2018November 8, 2018 PK0
Slide Meter Chart (Ver-2)
Charts and Visualization

Slide Meter Chart (Version-2)

November 7, 2018November 7, 2018 PK0
Slide Meter Chart
Charts and Visualization

Slide Meter Chart – Version 1

November 4, 2018November 4, 2018 PK0
3D KPI Indicator
Charts and Visualization

3D KPI Indicator in Excel

September 30, 2018September 30, 2018 PK0
Filling Stacked Column Chart
Charts and Visualization

Filling Stacked Column Chart in Excel

September 23, 2018September 23, 2018 PK0
Comparison between two teams
Charts and Visualization

Comparison info-graphics in excel

July 9, 2018July 9, 2018 PK0

Posts navigation

1 2 Next

Top Categories

  • Charts and Visualization (102)
  • Dashboard (5)
  • Excel Tips and Tricks (35)
  • Power BI (12)
  • Power Pivot (11)
  • Power Point Visualization (4)
  • Predictive Analytics (3)
  • Templates (31)
  • VBA (61)

Read More about..

  • Advanced Excel
  • VBA Course
  • Dashboard
  • Chart and Visualization
  • VBA Tips
  • Excel Tips and Trics
  • Our Excel Products
  • About US
  • Contact Us


Subscribe to our Newsletter


Download Free Dashboards

  • Project Management Dashboard
  • Zonal Dashboard
  • Sales Dashboard
  • Outbound Dashboard
  • A Quick Dashboard
  • C-SAT Dashboard
  • Performance Dashboard
  • Process Dashboard
  • Incentive Dashboard

Recent Posts

  • Annual Leave Tracker with Daily/Monthly View in Excel
  • Stylish Attendance Tracker with Symbols
  • Transport Cost Optimization Using Solver in Excel
  • What-If Analysis (Goal Seek, Scenario Manager and Data Table) in Excel
  • Dynamic Pivot Table with Multiple Tables using Power Query
  • Vertical and Circular Bullet Chart in Excel
  • Inventory Management Template for Store
  • 10 Pro Tips for Excel Charts
  • Dynamic Hourly Project Planner (Gantt Chart)
  • Price Fetching Tool from Amazon and Flipkart
Copyright © 2018 PK-AnExcelExpert.com - Privacy Policy