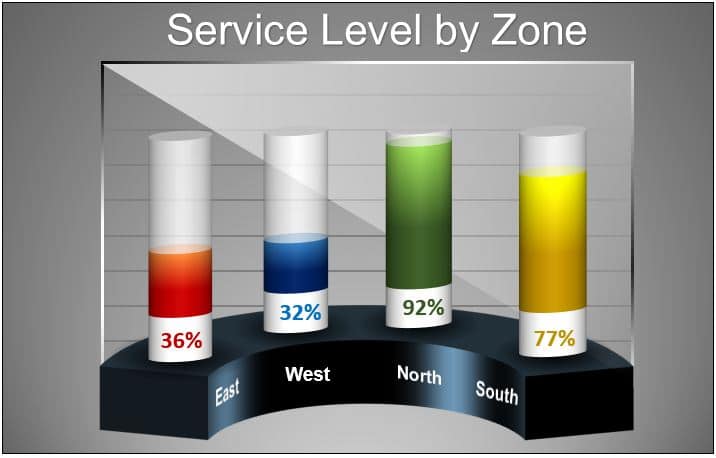
In this article, we have created a beautiful 3D visualization in Excel using 3D Column charts and Excel Shapes. You can use this visualization in your business dashboard or business Presentations. We’re diving into the cool waters of 3D visualization in Excel, and trust me, it’s easier than you think!
Why Go 3D?
Imagine you’re presenting your latest sales figures. Now, you could show a flat chart, but where’s the fun in that? With 3D, your data doesn’t just sit there; it reaches out and grabs your audience. It’s all about:
- Seeing the Big Picture: Comparing data becomes a breeze when it’s popping out at you. A 3D chart gives you a holistic view of your data, allowing for an immediate visual comparison across different variables. It’s like watching a movie in IMAX versus your old TV at home – the experience is incomparable.
- Spotting Trends: Trends tend to hide in 2D, but in 3D? They’re clear as day. The added depth brings nuances to light that might otherwise be missed. It’s like having a detective magnifying glass that highlights clues leading to insightful conclusions.
- Keeping Eyes Glued: A stunning 3D chart is like a good movie; nobody’s dozing off! When your presentation has that extra pizzazz, you’ll keep your audience engaged and eager to see what comes next.
Click to buy Beautiful 3D Visualization in Excel
Building 3D Visualization in Excel
Alright, let’s roll up our sleeves and get to charting:
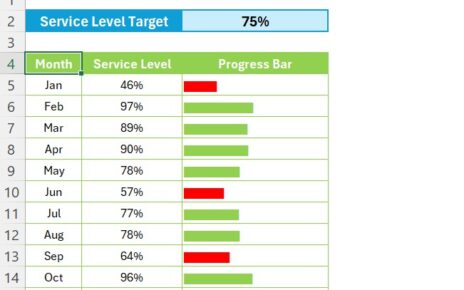
- Pick Your Data: Grab those numbers that are begging to be seen. Whether it’s sales, demographics, or performance metrics, choose data that will benefit from a multidimensional view.
- Chart It Up: Head over to ‘Insert’, click on ‘Column or Bar Chart’, and pick ‘3D Column’. Excel will work its magic and transform your flat data into a dynamic 3D visualization.
- Make It Yours: Time to play dress-up with your chart. Add some color, slap on labels, make it shine! Customize your chart with different colors for each series to differentiate them clearly. Use labels to make sure each data point is easily understood.
Sprucing Up with Shapes
Excel Shapes are like the cherry on top:
- Shape It Up: Hit ‘Insert’, click ‘Shapes’, and choose your shape. From arrows pointing out significant trends to stars highlighting key achievements, shapes can direct attention where you want it.
- Style It: Right-click that shape and make it pretty. Size, color, effects—it’s all in your hands. Match them with your company’s branding or the theme of your presentation for that professional touch.
Bringing It All Together
Got your masterpiece ready? Let’s put it out there:
- Dashboard Time: Slide that beauty into your Excel dashboard for all to see. Dashboards are powerful tools that compile various data visualizations onto one screen for easy monitoring.
- Showtime: Presenting? Copy-paste into PowerPoint or go live from Excel. Either way, you’re set to impress with visuals that stand out.
Wrapping It Up
And there you have it! You’re now armed with the know-how to turn those snooze-worthy sheets into a 3D extravaganza. Remember, it’s not just about the numbers; it’s about the story they tell. So go ahead, give your data the stage it deserves—in glorious 3D!
Visit our YouTube channel to learn step-by-step video tutorials
Watch the step by step video tutorial:
Click to buy Beautiful 3D Visualization in Excel