New: NextGenTemplates Academy - video courses on Excel formulas with AI and Pivot Tables & dashboards. Early-bird: 20% off with code EARLYBIRD20 - first 20 orders only. See the courses →
  • Learn Excel (Free Course)
    • 1. Shortcut Keys
    • 2. Fill & Flash Fill
    • 3. Find & Replace
    • 4. Sort & Filter
    • 5. Formulas & Functions
    • 6. Data Validation
    • 7. Conditional Formatting
    • 8. Basic Charts
    • 9. Advanced Charts
    • 10. Pivot Tables
    • 11. Excel Dashboards
    • 12. VBA Course
    • 13. Excel Formulas with AI
  • Templates
  • Tutorials
    • Charts and Visualization
    • VBA
    • Excel Tips and Tricks
    • Excel Dashboards
    • Power Pivot & DAX
  • Power BI
  • Template Store
    • Ready to Use Templates
  • Courses
  • Academy
    • Excel + AI Mastery: 100 Formulas
    • Excel Pivot Tables & Dashboards
  • About Us
  • Contact Us

PK: An Excel Expert

Transforming Data into Decisions

Tag: 3D Column

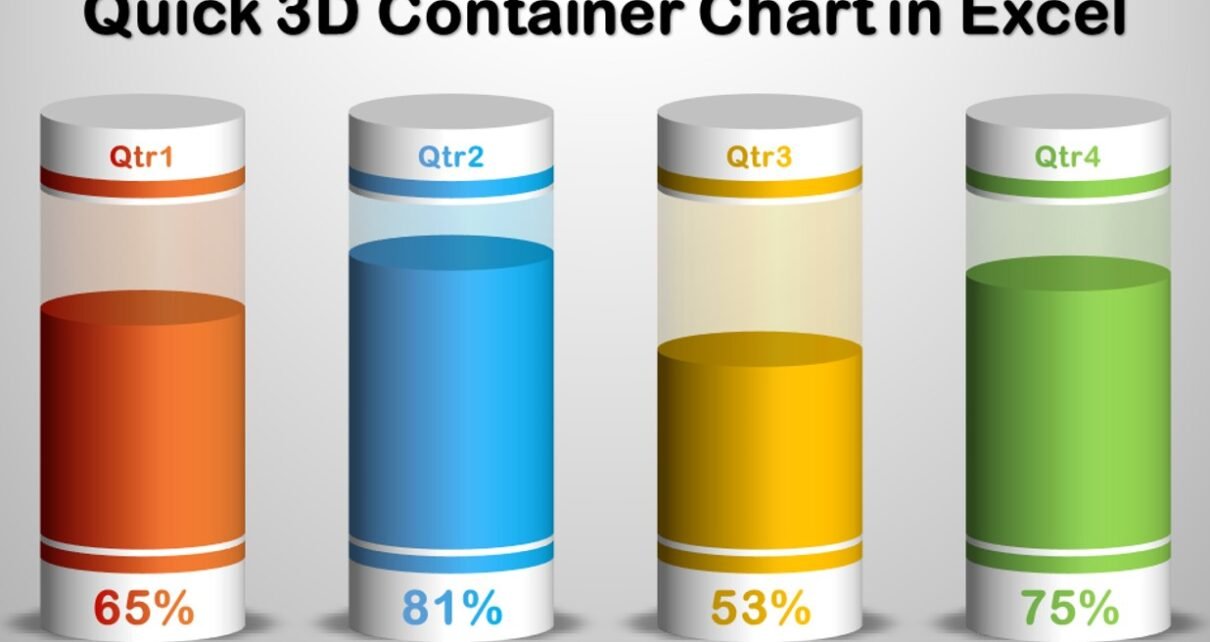
Quick 3D Container Chart
Charts and Visualization

Quick 3D Container chart in Excel

January 3, 2023February 20, 2025 PKComments Off on Quick 3D Container chart in Excel
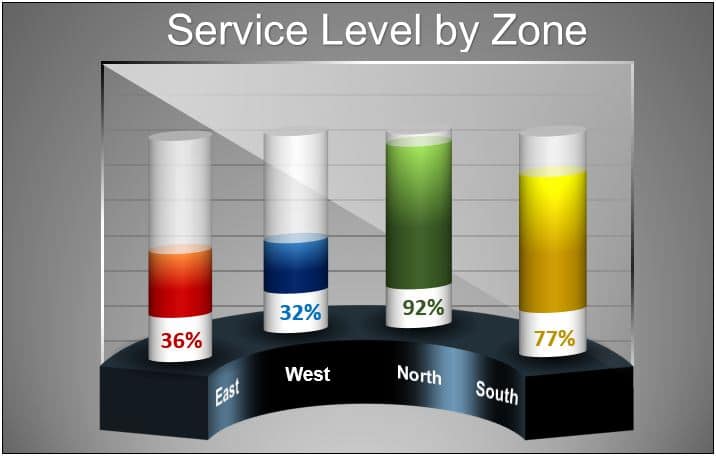
In this article, we have created a beautiful 3D container chart in Microsoft Excel. We have used a 3D Stacked column chart to create this chart. You can use this
Read More
3D Charts for Weekly Sale
Charts and Visualization

3D Chart for Weekly Sale in Excel

September 26, 2021March 2, 2025 PKComments Off on 3D Chart for Weekly Sale in Excel
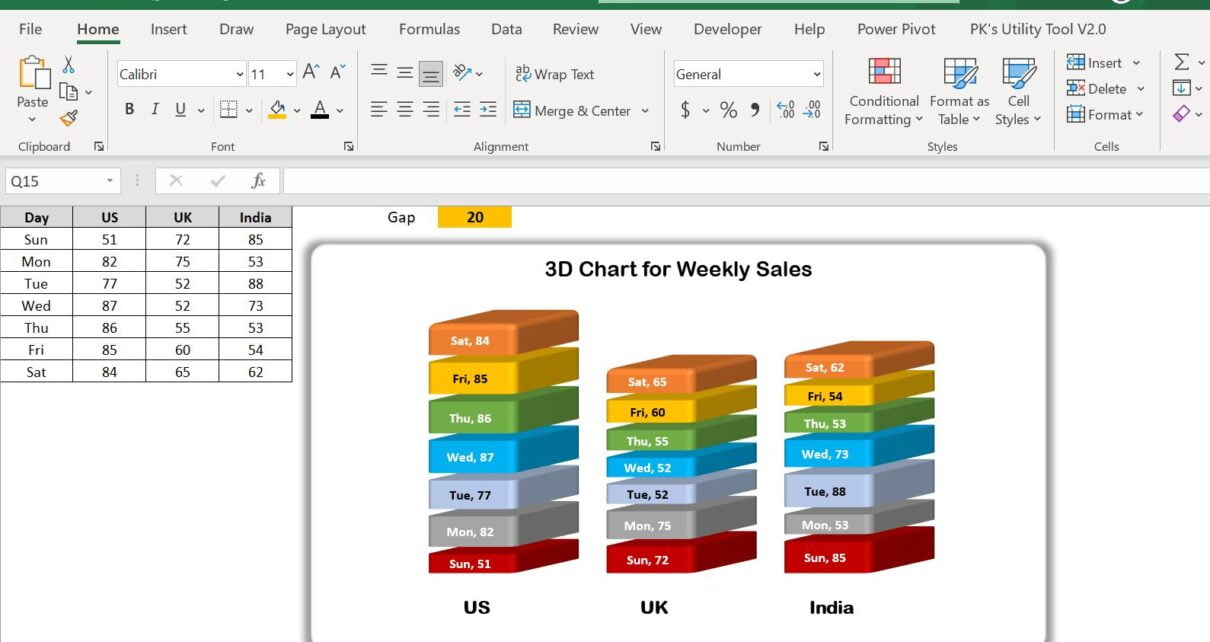
Data visualization is a robust strategy for presenting and analyzing vast amounts of data, uncovering trends, patterns, and relationships that may have been previously concealed. 3D charts are a distinctive
Read More
3D Visualization in Excel
Charts and Visualization

Beautiful 3D Visualization in Excel

February 9, 2020March 3, 2025 PKComments Off on Beautiful 3D Visualization in Excel
In this article, we have created a beautiful 3D visualization in Excel using 3D Column charts and Excel Shapes. You can use this visualization in your business dashboard or business
Read More
3D Filled Pyramids Chart in Excel for KPI Percentages
Charts and Visualization

3D Filled Pyramids Chart in Excel for KPI Percentages

May 12, 2019October 9, 2026 PKComments Off on 3D Filled Pyramids Chart in Excel for KPI Percentages
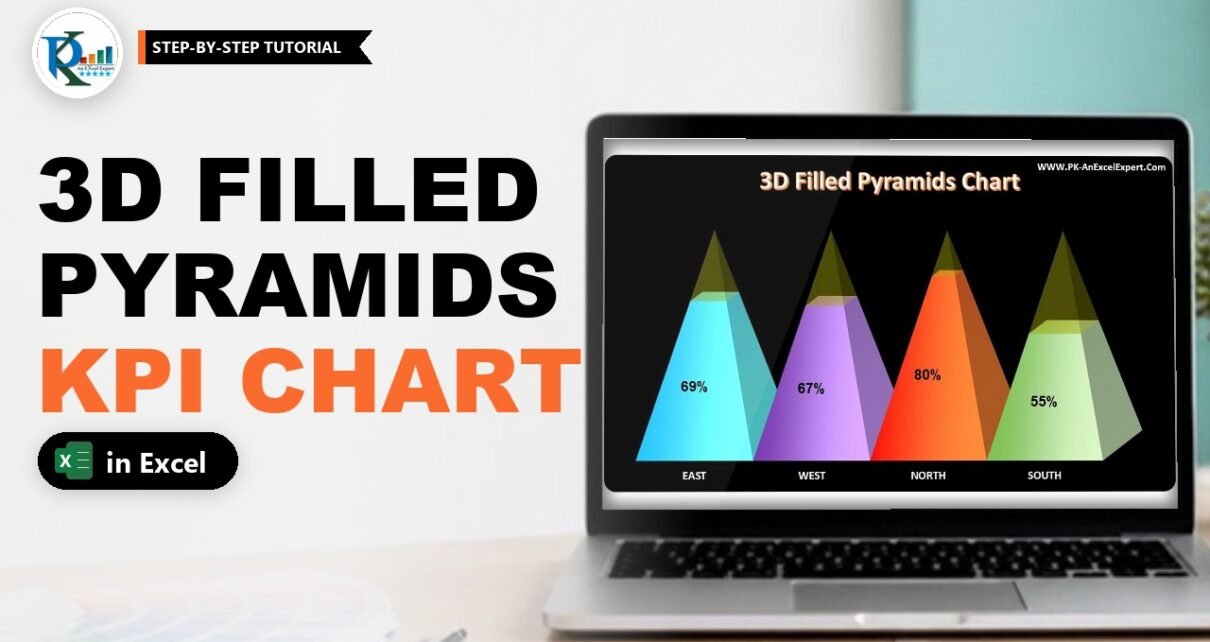
A 3D filled pyramids chart in Excel turns a KPI percentage into a pyramid that fills up from the bottom, like liquid in a glass. Each category gets its own
Read More
3D Glass Chart
Charts and Visualization

3D Glass Chart in Excel

February 20, 2019March 4, 2025 PKComments Off on 3D Glass Chart in Excel
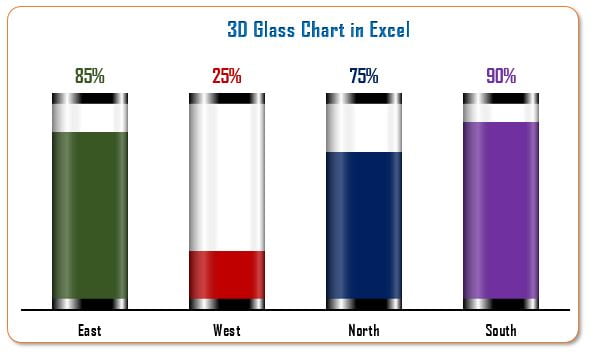
I am back with a very innovative and Informative chart that is 3D Glass Chart in Excel. This chart can be used to display a KPI metrics like Service Level,
Read More
  • Learn Excel (Free Course)
    • 1. Shortcut Keys
    • 2. Fill & Flash Fill
    • 3. Find & Replace
    • 4. Sort & Filter
    • 5. Formulas & Functions
    • 6. Data Validation
    • 7. Conditional Formatting
    • 8. Basic Charts
    • 9. Advanced Charts
    • 10. Pivot Tables
    • 11. Excel Dashboards
    • 12. VBA Course
    • 13. Excel Formulas with AI
  • Templates
  • Tutorials
    • Charts and Visualization
    • VBA
    • Excel Tips and Tricks
    • Excel Dashboards
    • Power Pivot & DAX
  • Power BI
  • Template Store
    • Ready to Use Templates
  • Courses
  • Academy
    • Excel + AI Mastery: 100 Formulas
    • Excel Pivot Tables & Dashboards
  • About Us
  • Contact Us
Copyright © 2023 PK-AnExcelExpert.com - Privacy Policy