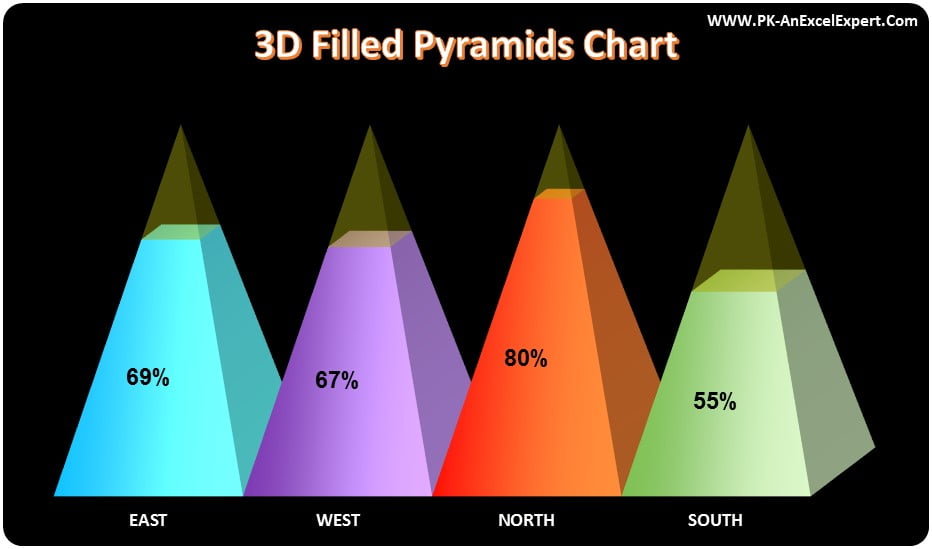
3D Filled Pyramids chart have been designed to display the KPI metrics like Sales Conversion, Service Level or any other KPI in percentage. You can display multiple categories on horizontal axis like we have displayed 4 different Zones – EAST, WEST, NORTH and SOUTH. We have used gradient fill for each zone which makes it more attractive.
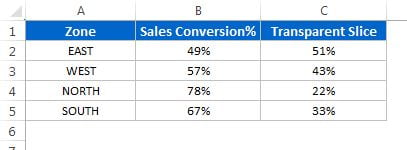
Below is the data set for 3D pyramid Chart-
3D Filled Pyramids Chart in Excel
Below is the snapshot of the 3D Filled Pyramids Chart in Excel.
Click to buy 3D Filled Pyramids Chart in Excel
Visit our YouTube channel to learn step-by-step video tutorials
Watch step by step video tutorial:
Click to buy 3D Filled Pyramids Chart in Excel