Project management is a complex task that involves multiple aspects, including planning, execution, control, and closure. Among the crucial elements of successful project management is the use of timeline charts, more specifically, the horizontal timeline chart. With the advent of technological tools, creating such visual aids has become more accessible and efficient. In this guide, we will focus on creating a Horizontal Timeline Chart using a Scatter chart in Excel. This can be an excellent resource for creating a gantt chart with a timeline, a tool often hailed for its practicality in project management.
Understanding the Horizontal Timeline Chart in Excel
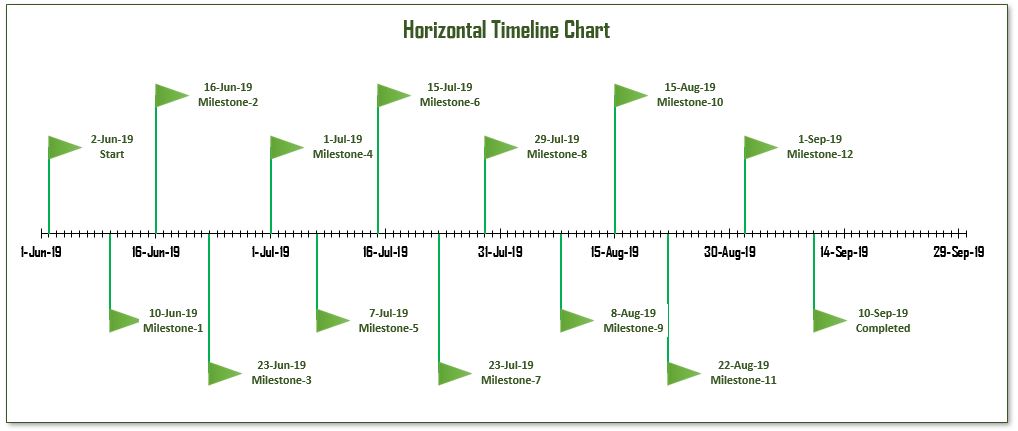
In our previous article, we created a Vertical Timeline Chart using a Scatter chart. Here, we take a different approach, crafting a Horizontal Timeline Chart using a scatter chart in Excel. This chart, much like the gantt timeline, is dynamic. When you add a new milestone in the table, it reflects on the chart automatically.
Steps to Create a Horizontal Timeline Chart in Excel
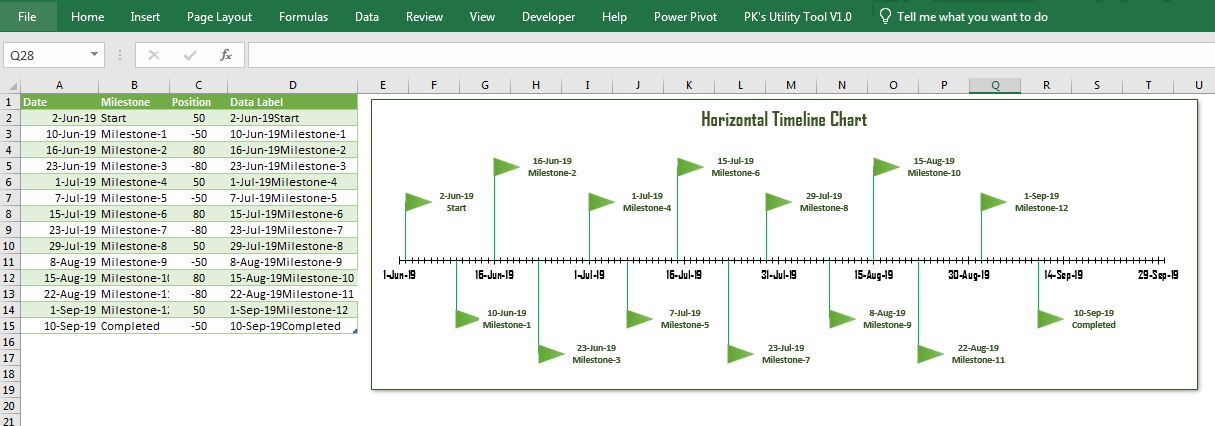
Horizontal Timeline Chart
Click to buy Horizontal Timeline Chart using Scatter chart in Excel
Gather Your Project Information
To create a project management timeline chart, first, compile all your project data. This should include project tasks, task duration, start date, end date, and milestones.
Create Your Data Table in Excel
Next, create a table in Excel that incorporates all your project information. This table will be the backbone of your timeline gantt chart.
Insert a Scatter Chart
Once your data table is ready, head to the ‘Insert’ tab in Excel. From there, select ‘Scatter Chart.’ Ensure to choose the ‘Scatter with Straight Lines’ option.
Customize Your Scatter Chart
To transform your scatter chart into a timeline gantt chart, you’ll need to adjust the axis, add data labels, format the data series, and finally, incorporate the milestones.
Visit our YouTube channel to learn step-by-step video tutorials
Watch the step-by-step video tutorial:
Click to buy Horizontal Timeline Chart using Scatter chart in Excel
Advantages of Using a Horizontal Timeline Chart in Excel for Project Management
- Visual Clarity: A project timeline gantt chart provides a clear visual representation of tasks, making it easy to comprehend project timelines.
- Efficient Tracking: With a gantt timeline in Excel, you can efficiently track project progress and adjust schedules as needed.
- Dynamic and Adaptable: Excel’s gantt chart with milestones template is dynamic and adapts to the changes you make in the data table.
- Easy Sharing: As a universally accepted tool, Excel allows for easy sharing and collaboration.
- Cost-Effective: Using Excel for creating a timeline gantt chart is a cost-effective solution, especially when compared to high-cost project management tools.
Opportunities for Improvement in Creating a Horizontal Timeline Chart in Excel
While creating a horizontal timeline chart in Excel has numerous advantages, there are areas for improvement.
- User Interface: Excel’s interface can be complex for beginners. A more user-friendly design would enhance its usability.
- Automation: The process of creating a chart could be further simplified with more automation features.
- Integration: More seamless integration with other project management tools could enhance Excel’s efficiency as a project management tool.
Best Practices for Creating a Horizontal Timeline Chart in Excel
- Consistent Updating: Ensure to regularly update your data table to reflect changes in your project schedule.
- Color Coding: Use color-coding for different tasks or milestones to enhance visual comprehension.
- Data Verification: Always double-check your data to avoid errors in your timeline gantt chart.
- Use Templates: If you frequently create timeline charts, consider using a gantt chart roadmap template to save time.
Conclusion
Creating a Horizontal Timeline Chart using a Scatter chart in Excel can be an effective way to manage your projects. It provides a visual overview of your project schedule, aids in tracking progress, and is dynamic to changes. While there are areas for improvement, with the right practices, you can optimize its usage to your advantage.
Frequently Asked Questions
Q. What exactly is a horizontal timeline chart in Excel?
In essence, a horizontal timeline chart in Excel serves as a visual representation of project tasks, which are neatly plotted against time.
Q. Moving on to creating a gantt chart with a timeline in Excel, how does one go about it?
Initially, you start by using a scatter chart. Following this, you’ll need to adjust the axis, after which you can add data labels. Subsequently, you need to format the data series and, finally, incorporate milestones. By doing these steps, you can successfully create a gantt chart with a timeline in Excel.
Q. Why should they use a gantt timeline in Excel?
Firstly, a gantt timeline in Excel provides unmistakable visual clarity. Secondly, it aids in efficient tracking and, most importantly, it is dynamic. Additionally, it allows for easy sharing and, to top it all off, it is a cost-effective solution.
Q. Turning to the opportunities for improvement when creating a horizontal timeline chart in Excel, what could be better?
There is certainly room for growth. For instance, improvements can be made in Excel’s user interface. Also, it would benefit from enhancements in automation features. Lastly, a more seamless integration with other project management tools could escalate Excel’s efficiency.
Q. What are the best practices one should adopt when creating a horizontal timeline chart in Excel?
To ensure efficiency, regularly updating your data is key. In addition to that, using color-coding aids visual comprehension. Furthermore, always make sure to double-check your data to avoid errors. Last but not least, using a gantt chart roadmap template can save considerable time and effort.
Creating a project timeline gantt chart is an essential skill in today’s fast-paced, result-oriented project management environments. Mastering the art of using Excel for this purpose can give you an edge, enhancing your productivity and the overall success of your projects.
Click to buy Horizontal Timeline Chart using Scatter chart in Excel