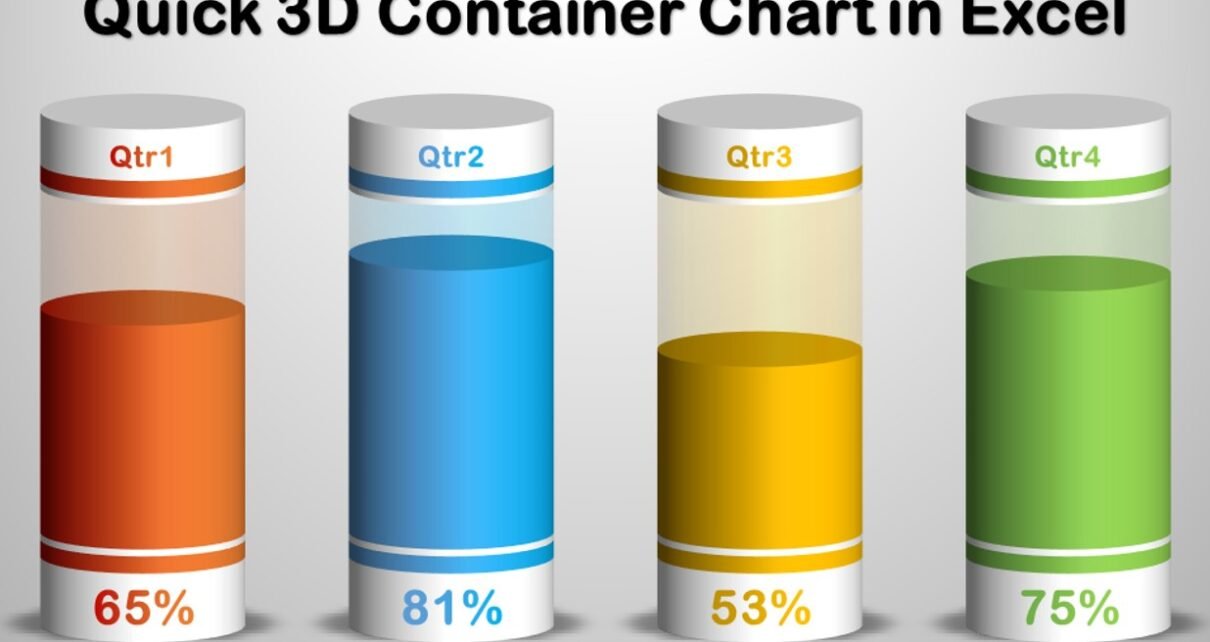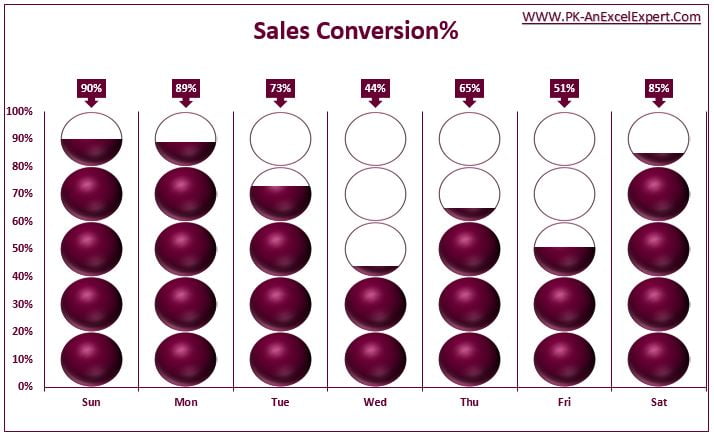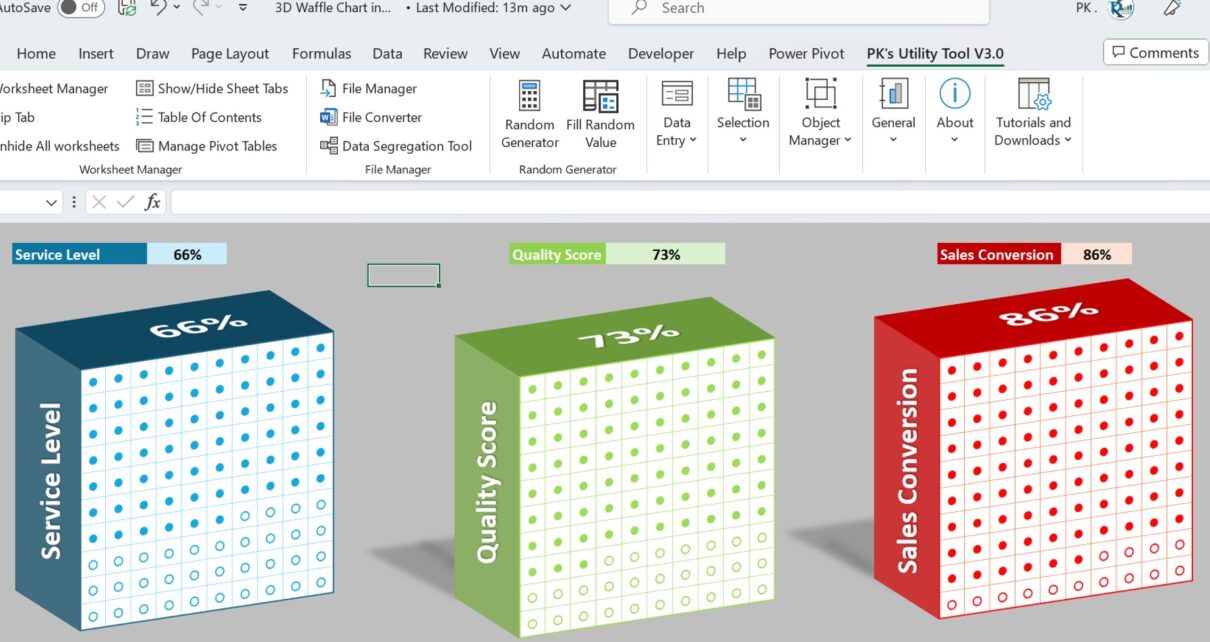
Mind-Blowing Excel Hack: 3D Waffle Charts in Just Steps
Introduction to 3D Waffle Charts in Excel Did you know that you can create stunning 3D waffle charts directly in Excel? This underutilized chart type not only looks great but
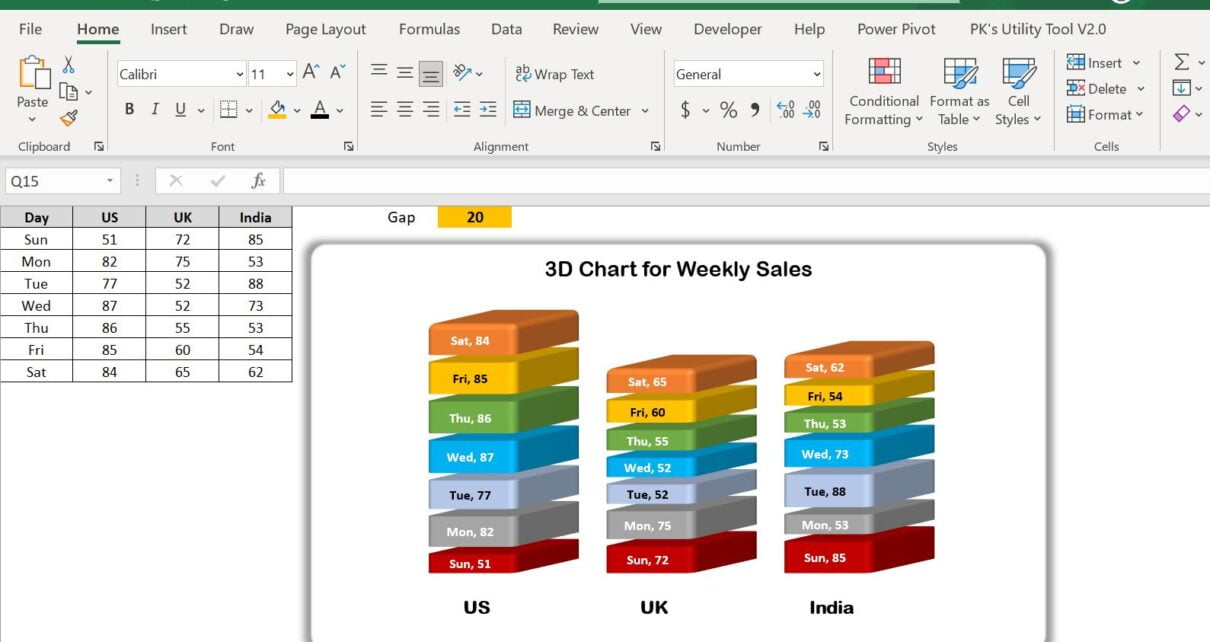
Transforming Data into Decisions