Informative KPI Indicator Chart in Excel (Version 1)
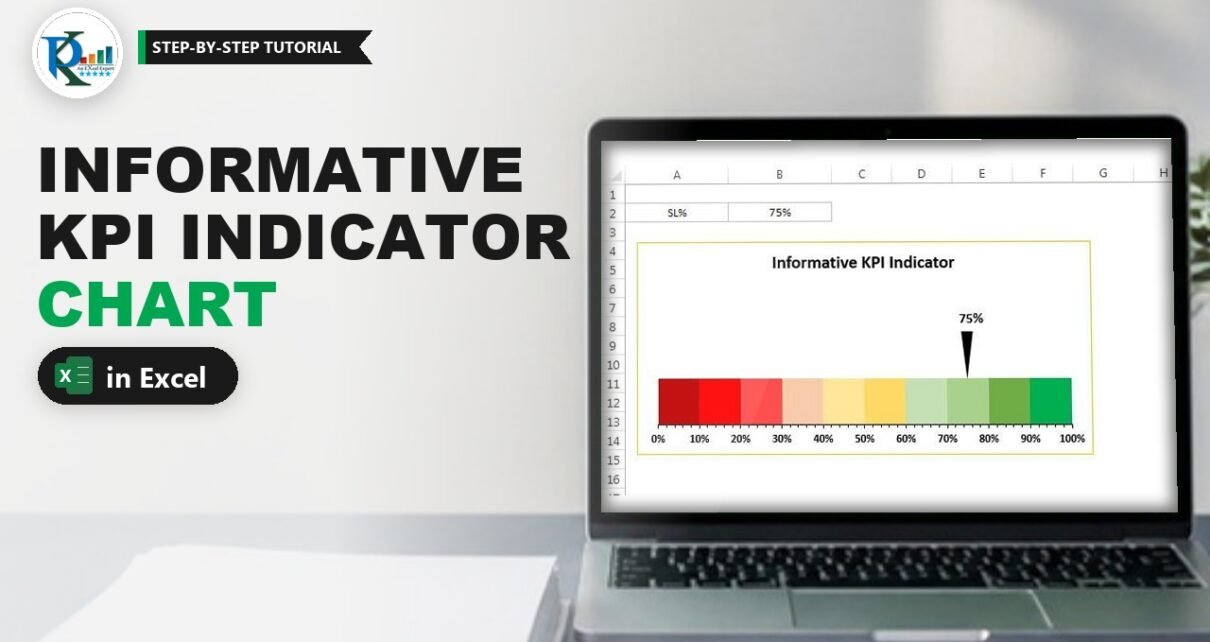
An informative KPI indicator chart shows a single KPI on a red-amber-green scale with an arrow that points to the current value. PK builds it on ten 10% slices, from
Transforming Data into Decisions