Excel is a powerful tool for creating a wide range of charts and infographics. including Truck Graph to show Occupancy or workload. In this blog post, we will look at the
PKComments Off on Make same size of selected shapes/Charts/Pictures using single click
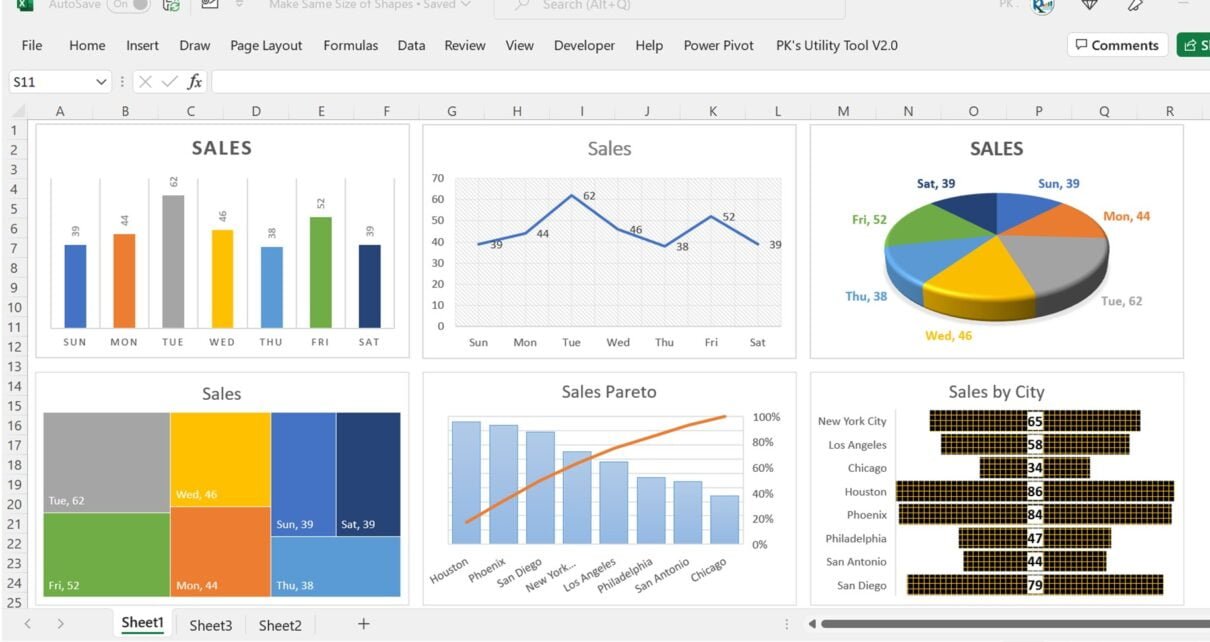
In this article, we have created a macro to make the same size of the selected shapes, charts, or pictures. It will change the size accordingly to first object in
PKComments Off on 10 Super Tips in Microsoft Excel
In the article, you will learn 10 super tips in Microsoft Excel. You can improve you productivity in Excel using these tips- Learn 10 Pivot table useful tips- 10 Super
PKComments Off on Custom Toggle Button in Excel and Power BI
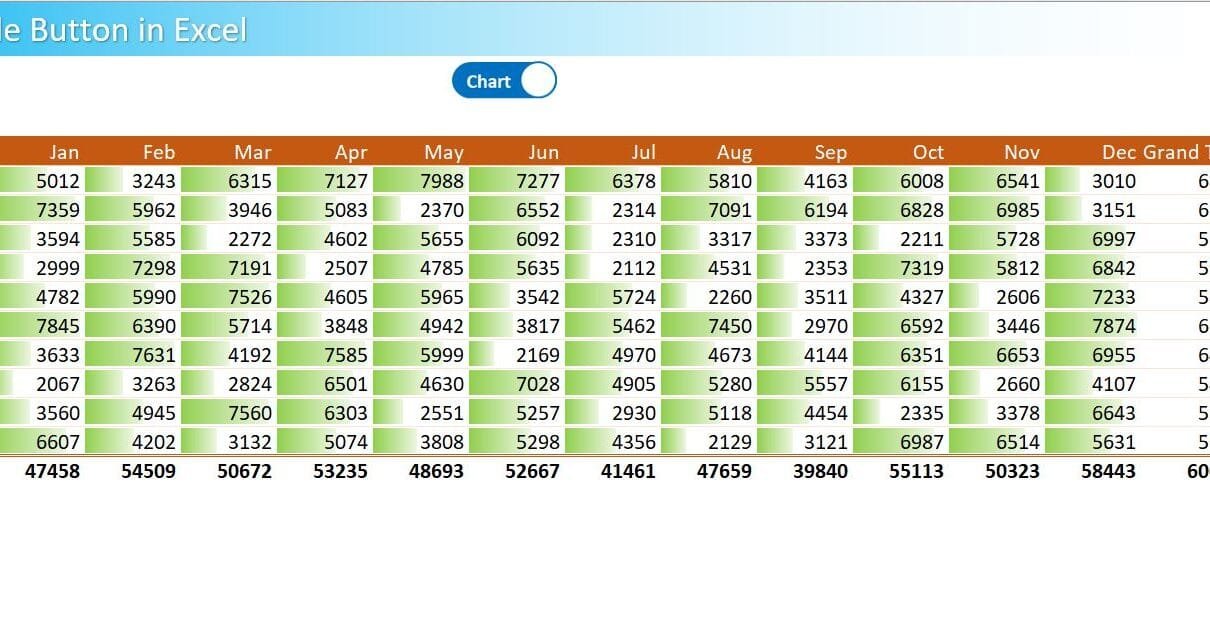
In this article, we have created a custom Toggle Button in Excel and Power BI to toggle the Chart and Table on click of this toggle button. This trick could be
PKComments Off on Smart Chart with Laptop Shape in Excel
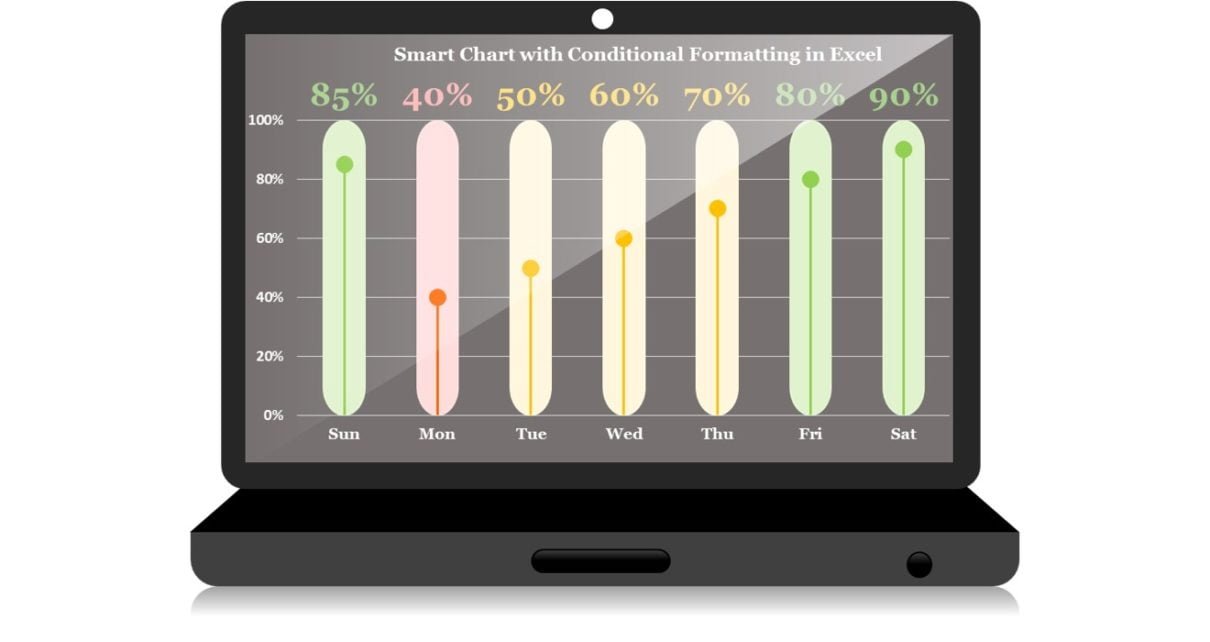
In this article, we have created a beautiful and smart chart with Conditional formatting in Microsoft Excel. We have create a laptop shape also using Excel shapes. We have placed
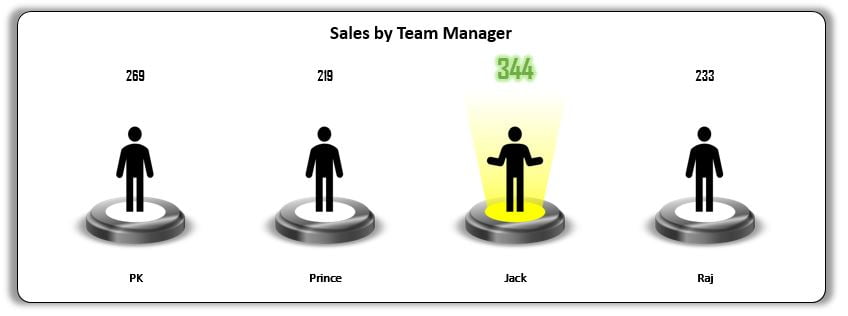
PKComments Off on Spotlight Visualization in Excel (Part-2)
This is the second part of Spotlight visualization. Here we have used spotlight to highlight top performer in the chart. We have created a Column Chart for Team Manager wise
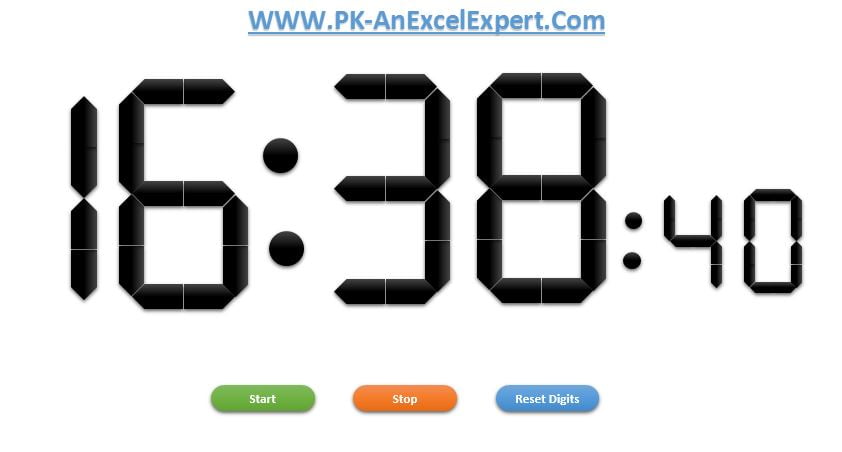
This time we have developed an innovative and stunning Digital Clock in Excel. We have created this using Excel auto shapes and VBA. Digital Clock in Excel [caption id="attachment_7136" align="aligncenter"
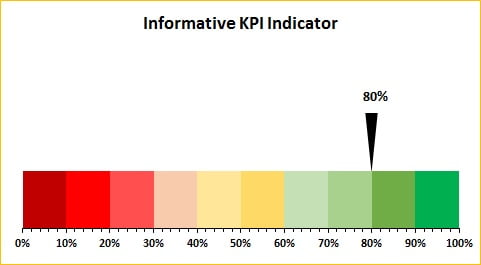
I am back with one more stunning and Informative KPI Indicator Chart. In this chart I have used a RAG color pallet in 10 slices (10% each). Here I have
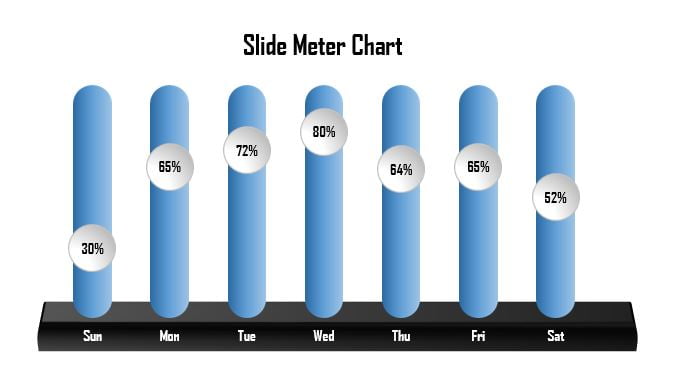
Slide Meter Chart is very useful and eye catching chart to show the KPI metrics performance. This chart has been designed with the help of Column Chart, Line Chart and
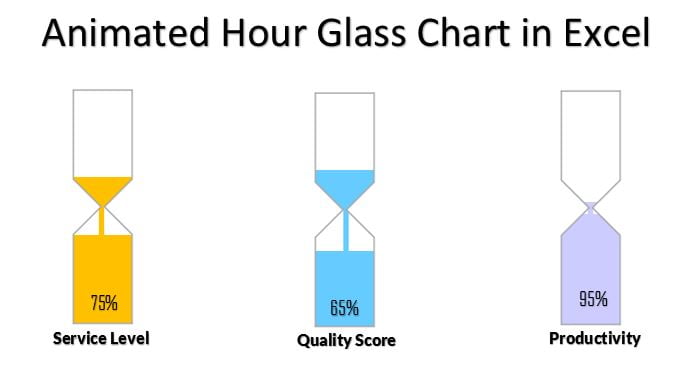
Animated Hour Glass Chart in Excel has been designed to display the KPI metrics like – Service Level, Quality Score, and Productivity etc. Whenever the value of metric will be
This website uses cookies to improve your user experience, analyze site traffic and serve targeted ads in accordance with our Privacy PolicyACCEPT
Privacy & Cookies Policy
Privacy Overview
This website uses cookies to improve your experience while you navigate through the website. Out of these cookies, the cookies that are categorized as necessary are stored on your browser as they are essential for the working of basic functionalities of the website. We also use third-party cookies that help us analyze and understand how you use this website. These cookies will be stored in your browser only with your consent. You also have the option to opt-out of these cookies. But opting out of some of these cookies may have an effect on your browsing experience.
Necessary cookies are absolutely essential for the website to function properly. This category only includes cookies that ensures basic functionalities and security features of the website. These cookies do not store any personal information.
Any cookies that may not be particularly necessary for the website to function and is used specifically to collect user personal data via analytics, ads, other embedded contents are termed as non-necessary cookies. It is mandatory to procure user consent prior to running these cookies on your website.