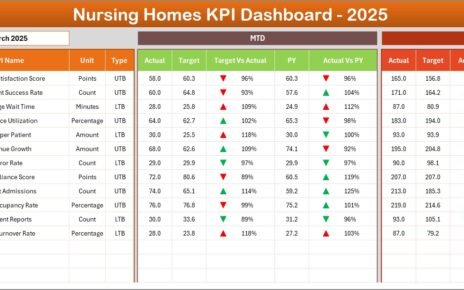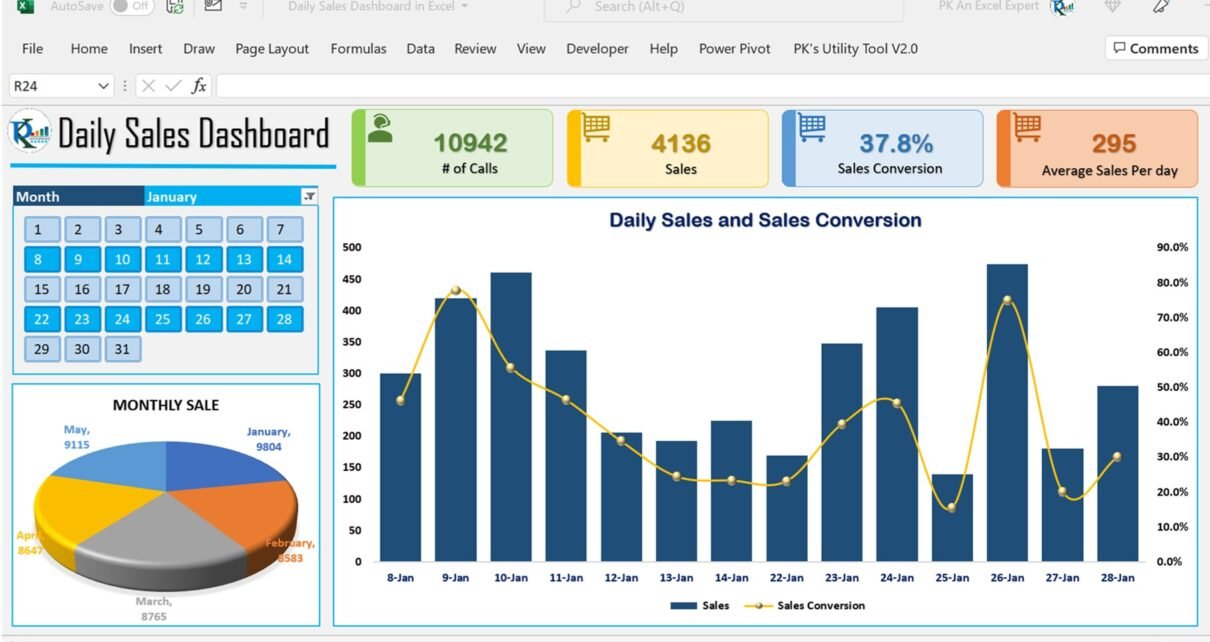
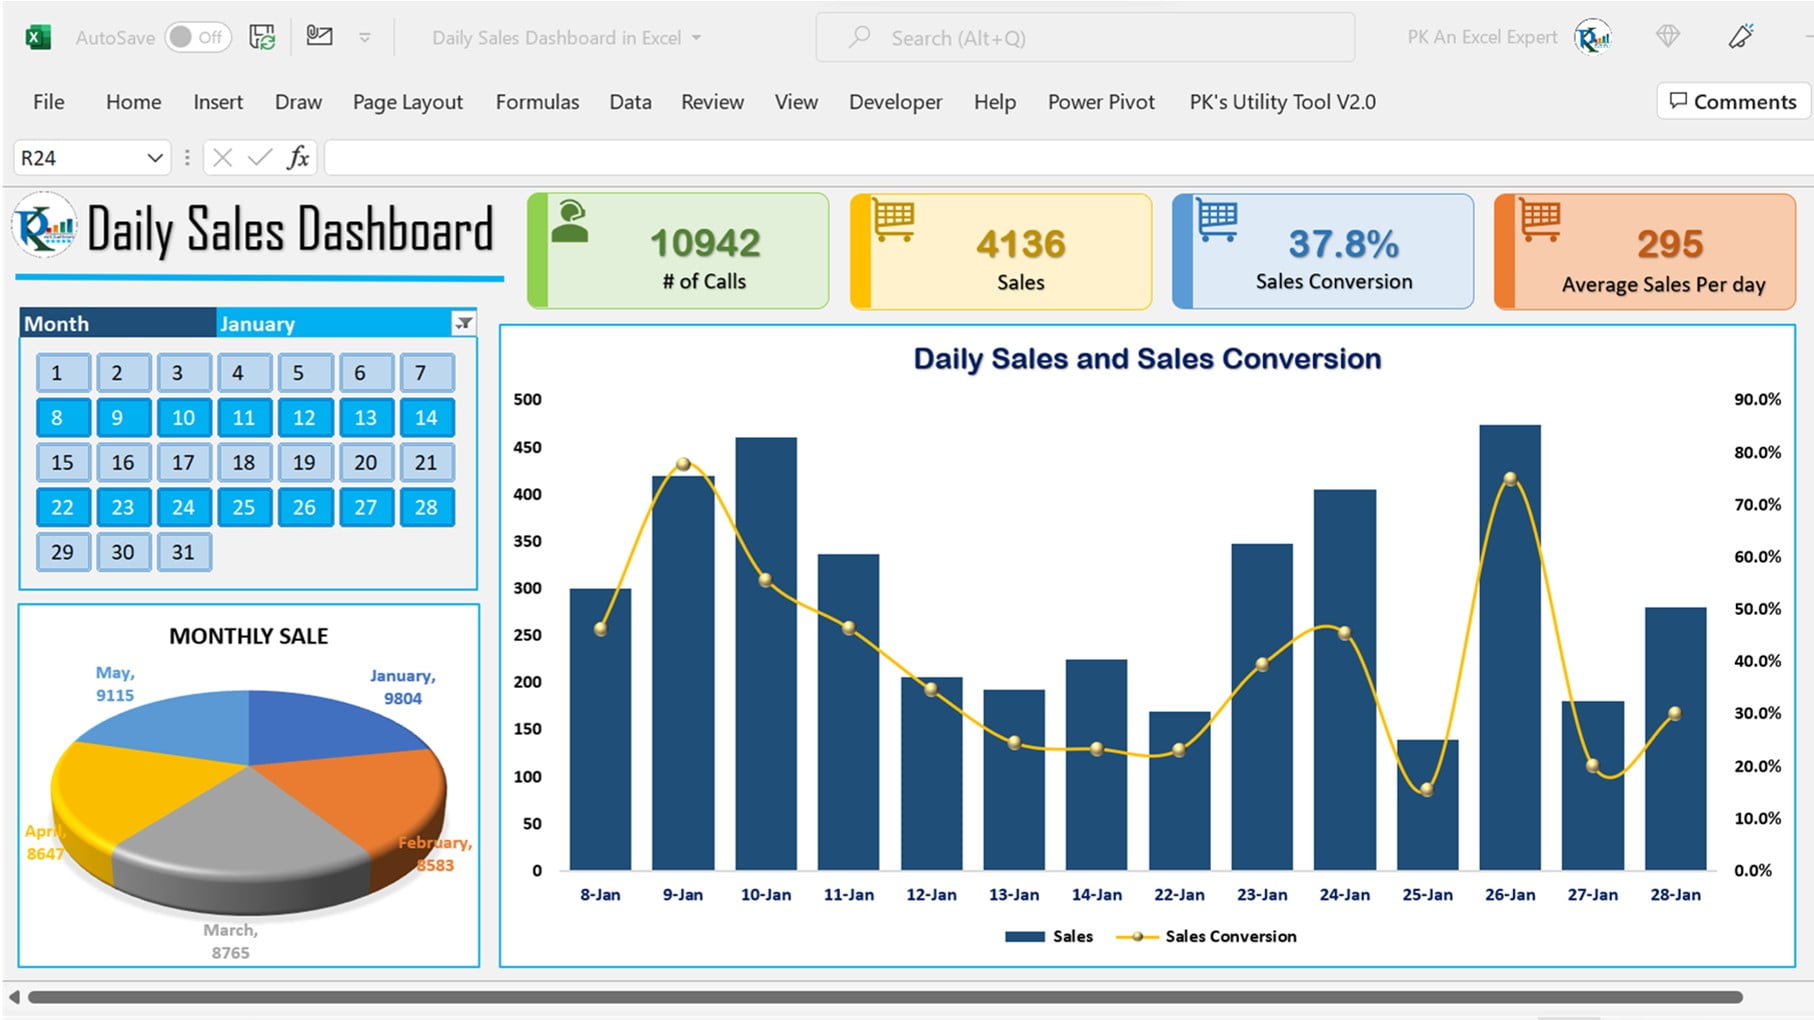
Daily Sales dashboard is quite useful template to track your daily sales. we have created a Daily Sales Dashboard to analyze the Daily Sales trends. We have displayed 4 metrics in this dashboard. You can modify the template as
Click to buy Daily Sales Dashboard
# Of Calls:
The number of calls made by tele callers to generate the sale.
Sales:
Number of Sales made by tele callers.
Sales Conversion:
Sales conversion is the ratio of Sales and Calls.
Average Sales Per Day:
Average sales made by telecallers in a day.
Daily Sales Dashboard in Excel
Click to buy Daily Sales Dashboard
Download our Other dashboards-
- Annual Sales Calendar for Sales Dashboard in Excel
- Comparative Analysis Dashboard in Excel
- KPI Dashboard with Tooltip in Excel
- Dynamic Dashboard with Tablet and Mobile shape in Excel
- Performance Dashboard
- Top/Bottom Analysis dashboard in Excel
- Fully Automated Excel dashboard with multiple source files
- C-SAT Dashboard
- Outbound Dashboard in Excel
Watch the step-by-step video tutorial:
Click to buy Daily Sales Dashboard
Visit our YouTube channel to learn step-by-step video tutorials