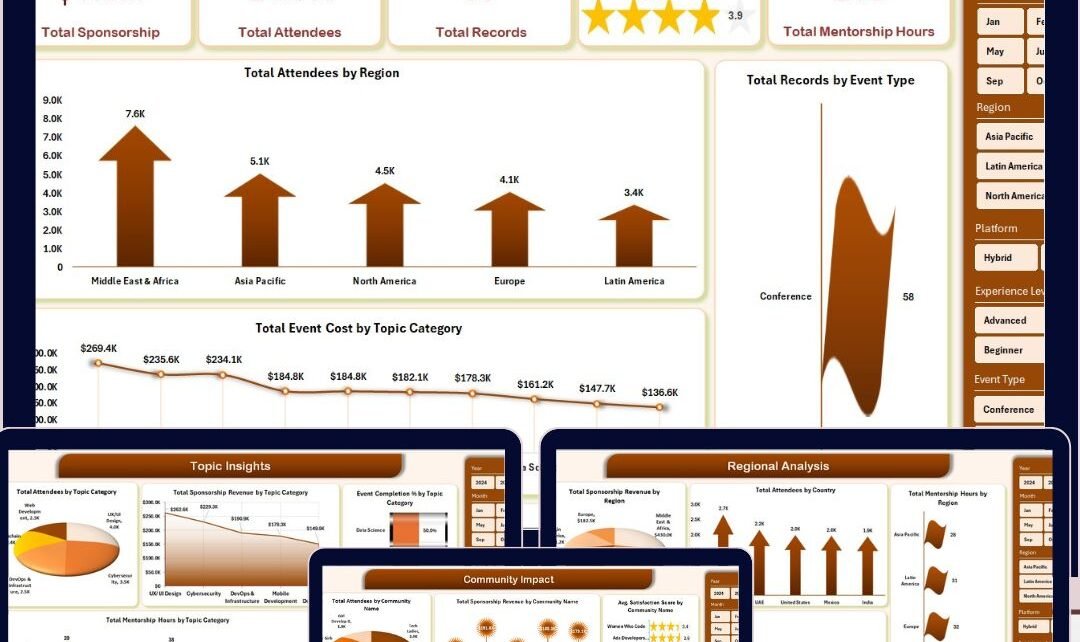
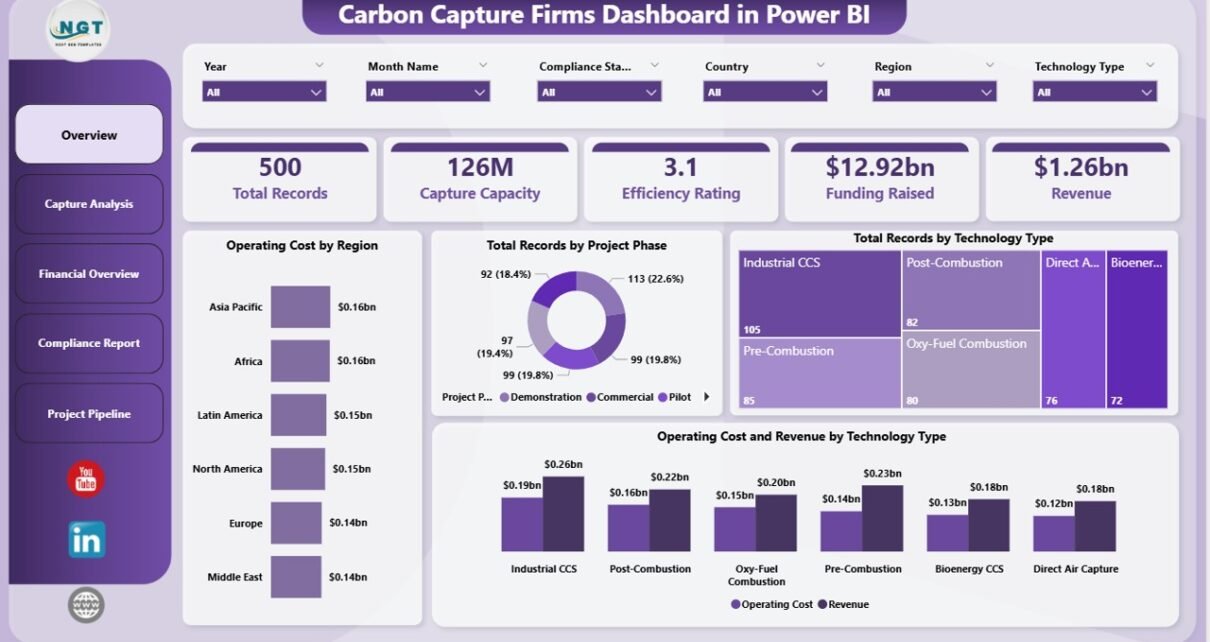
• Advanced Excel
    • Shortcut Keys
    • Useful Formulas
    • Basic Charts
    • Advanced Chart
    • Sort and Filter
    • Pivot Table
    • Data Validation
    • Conditional Formatting
    • Auto Fill and Flash Fill
    • Find and Replace
  • VBA Course
  • Products
    • Restaurant Management
    • PK’s Utility Tool V2.0
    • PK’s Utility Tool V1.0
    • Task Management
    • AMS V1.0
    • AMS V2.0
    • Sale/Purchase Software
    • PK’s Function Kit
  • Blogs
    • Charts and Visualization
    • VBA
    • Excel Tips and Tricks
    • Templates
  • Excel Dashboard
    • Sales Dashboard
    • Process Dashboard
    • Performance Dashboard
    • Project Management
    • Outbound Dashboard
    • Incentive Dashboard
    • Zonal Dashboard in Excel
    • Quick Dashboard
  • Free Templates
  • Power BI
  • About Us
  • Contact Us

PK: An Excel Expert

Excel, VBA and Power BI tutorials

Tag: Dashboard

3D Glass Chart in Power BI
Power BI

Power BI dashboard with 3D Glass Chart

January 23, 2023January 23, 2023 PKComments Off on Power BI dashboard with 3D Glass Chart
Sparklines in Power BI
Power BI

Sparklines in Power BI

May 17, 2022May 17, 2022 PKComments Off on Sparklines in Power BI
Daily Sales Dashboard
Dashboard

Daily Sales Dashboard in Excel

April 5, 2022April 5, 2022 PKComments Off on Daily Sales Dashboard in Excel
Comparative Analysis Dashboard in Excel
Dashboard Power Pivot

Comparative Analysis Dashboard in Excel

June 20, 2021June 20, 2021 PKComments Off on Comparative Analysis Dashboard in Excel
Infographics in Power BI
Power BI

Infographics in Power BI dashboard

April 18, 2021May 3, 2021 PKComments Off on Infographics in Power BI dashboard
Row Level Security in Power BI
Power BI

Static and Dynamic Row Level Security in Power BI

October 25, 2020October 25, 2020 PKComments Off on Static and Dynamic Row Level Security in Power BI
Tablet and Mobile layout Dashboard
Dashboard

Dynamic Dashboard with Tablet and Mobile shape in Excel

May 17, 2020May 17, 2020 PKComments Off on Dynamic Dashboard with Tablet and Mobile shape in Excel
Excel Dashboard With Multiple Source Files
Dashboard Power Pivot

Fully Automated Excel dashboard with multiple source files

April 12, 2020April 12, 2020 PKComments Off on Fully Automated Excel dashboard with multiple source files
Northwind Dashboard
Dashboard Power BI

Beautiful Power BI Dashboard with Northwind Database

March 24, 2020June 30, 2020 PKComments Off on Beautiful Power BI Dashboard with Northwind Database
AI Based Visual in Power BI
Power BI

Artificial Intelligence based visuals in Power BI

March 15, 2020March 16, 2020 PKComments Off on Artificial Intelligence based visuals in Power BI

Posts navigation

1 2 Next

Top Categories

  • Charts and Visualization (126)
  • Dashboard (8)
  • Excel Tips and Tricks (54)
  • Power BI (19)
  • Power Pivot (14)
  • Power Point Visualization (5)
  • Predictive Analytics (3)
  • Templates (49)
  • VBA (75)

Read More about..

  • Advanced Excel
  • VBA Course
  • Dashboard
  • Chart and Visualization
  • VBA Tips
  • Excel Tips and Trics
  • Our Excel Products
  • About US
  • Contact Us


Subscribe to our Newsletter


Download Free Dashboards

  • Project Management Dashboard
  • Zonal Dashboard
  • Sales Dashboard
  • Outbound Dashboard
  • A Quick Dashboard
  • C-SAT Dashboard
  • Performance Dashboard
  • Process Dashboard
  • Incentive Dashboard

Recent Posts

  • Common Errors in Excel formulas and how to fix them
  • How Chat GPT can help to write Complex Excel Function, VBA code and DAX for Power BI
  • Power BI dashboard with 3D Glass Chart
  • Use of Symbols and Emojis in Excel Drop-down List and Excel Charts
  • Five awesome formulas in Excel
  • Quick 3D Container chart in Excel
  • TEXTSPLIT function with three use cases in Excel
  • LAMBDA Function in Excel with Example
  • Data Transformation to create Comma Separated List automatically
  • Inventory Management Template for Multiple Locations
Copyright © 2018 PK-AnExcelExpert.com - Privacy Policy