Introduction
The Biodegradable Packaging Dashboard in Power BI is a powerful analytic tool designed to provide insights into the production, sustainability, sales, and facility performance of biodegradable packaging products. This ready-to-use dashboard allows you to simply update your data file, connect it with the Power BI file, and refresh the dashboard to get real-time insights at your fingertips. Whether you are tracking profits, sustainability metrics, or sales trends, this dashboard simplifies complex data into easy-to-understand visualizations.
Click to Purchases Biodegradable Packaging Dashboard in Power BI
Key Features of Biodegradable Packaging Dashboard in Power BI
- Multiple interactive pages tailored for detailed business analysis.
- High-level summary cards displaying key metrics like total records, revenue, production cost, profit, and customer ratings.
- Dynamic slicers for quick filtering and customized data views.
- Comprehensive charts focusing on sales, production, sustainability, and facility performance.
- Easy data refresh and update without the need for rebuilding reports.
Dashboard Pages Explanation
1 – Overview Page
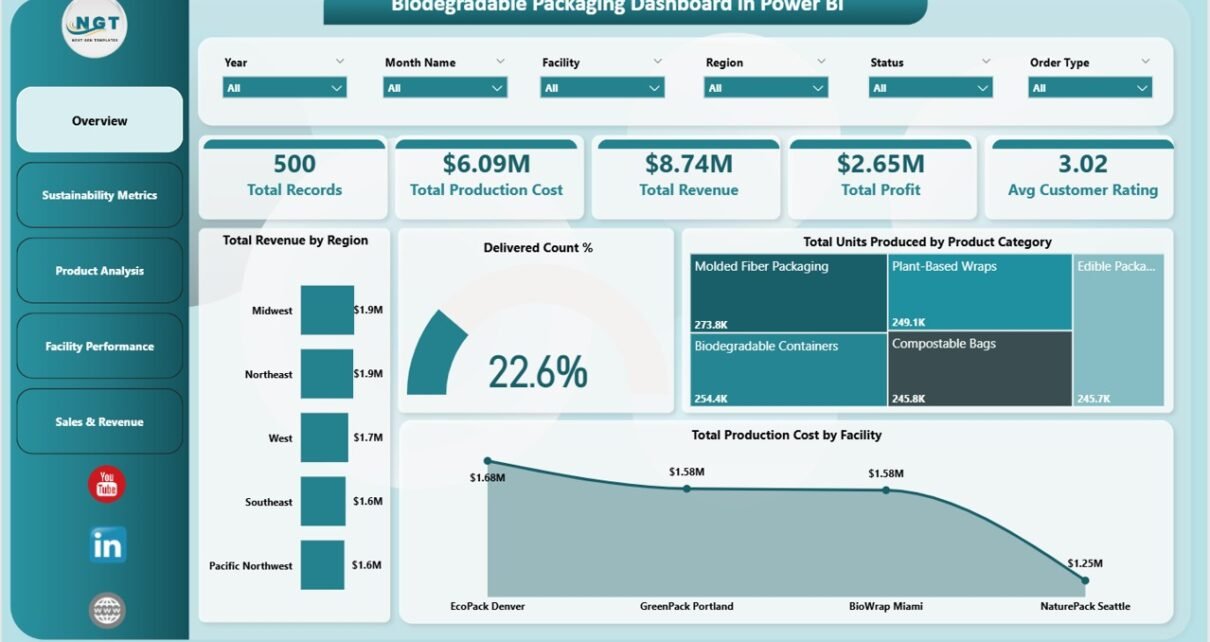
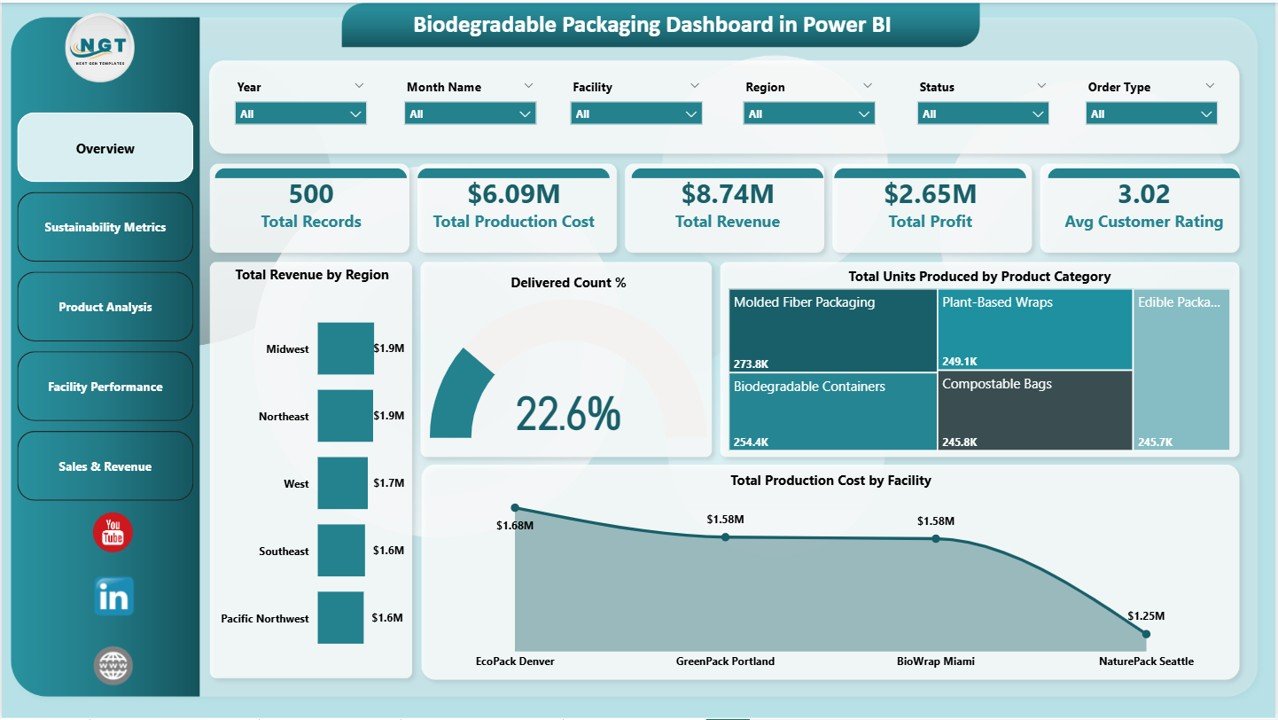
The Overview page provides a high-level summary of critical business metrics using five key cards:
- Total Records: Displays the total number of data entries in the system.
- Total Production Cost: Shows the aggregated production expenditure.
- Total Revenue: Indicates the income generated from sales.
- Total Profit: Represents the net earnings after costs.
- Avg Customer Rating: Provides an average score from customer feedback.
Charts featured on this page include:
- Total Revenue by Region: Visualizes revenue distribution across different geographic locations for better market insights.
- Delivered Count %: Shows the proportion of orders delivered relative to total orders, highlighting fulfillment efficiency.
- Total Units Produced by Product Category: Compares production volumes across various packaging categories to identify high-performing products.
- Total Production Cost by Facility Chart: Breaks down production costs by manufacturing facilities to pinpoint cost centers.
Biodegradable Packaging Dashboard in Power BI
2 – Sustainability Metrics
This page concentrates on sustainability-related KPIs for environmentally-conscious packaging businesses. Featured analyses include:
- Avg Sustainability Score by Product Category: Measures eco-friendliness across product lines to track sustainability progress.
- Avg Customer Rating by Facility: Shows customer satisfaction linked to specific manufacturing sites.
- Total Records by Material Type: Displays data volume segmented by the kinds of biodegradable materials used.
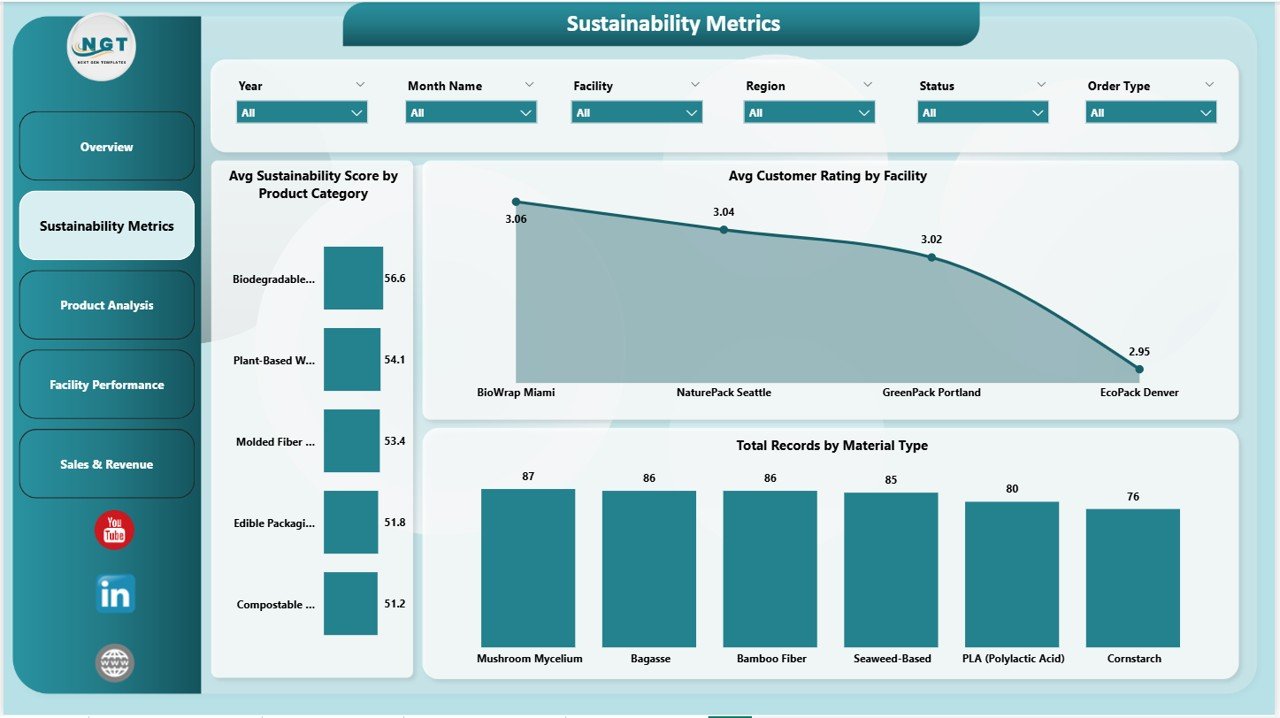
Sustainability Metrics
3 – Product Analysis
The Product Analysis page dives deeper into product-specific financial and sales data with charts such as:
- Profit Margin % by Product Category: Compares profitability to optimize product portfolio decisions.
- Total Revenue by Product Category: Highlights sales contributions from each product segment.
- Total Units Sold by Product Category: Tracks sales volume trends to gauge market demand.
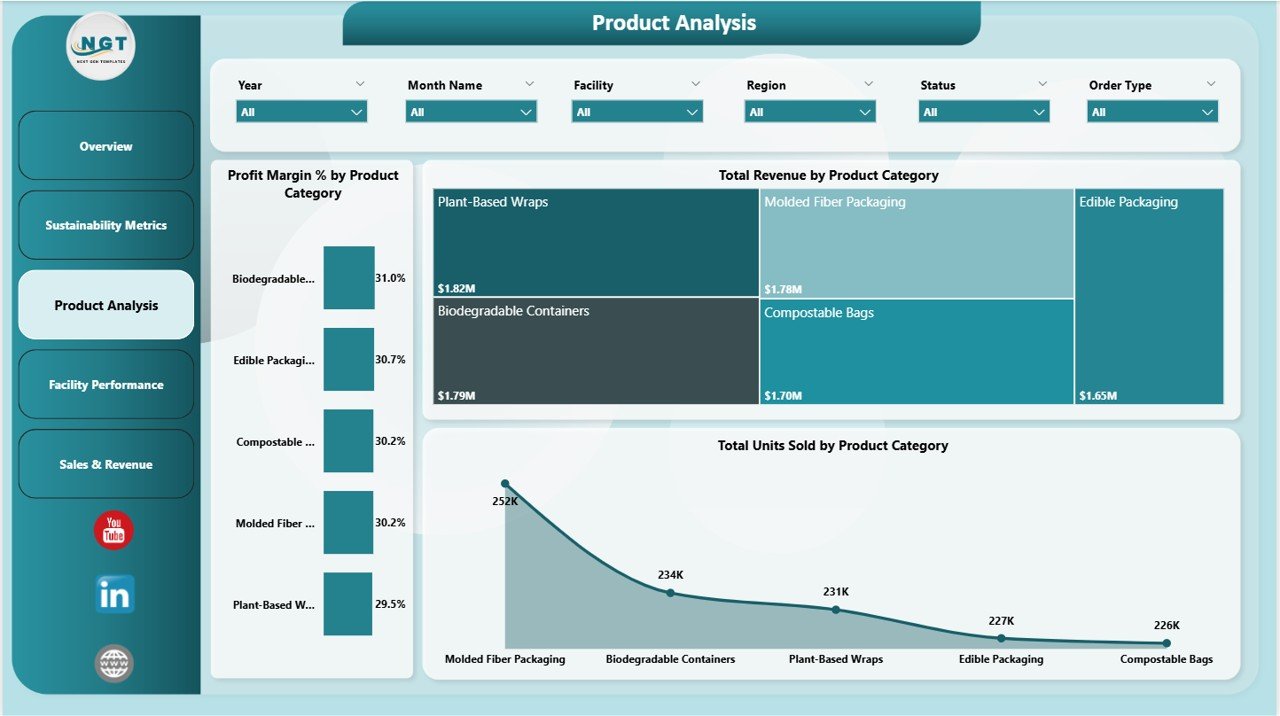
Product Analysis
4 – Facility Performance
This tab presents detailed analysis of manufacturing facilities through:
- Total Revenue by Facility: Identifies revenue generators among facilities for resource allocation.
- Total Profit by Facility: Tracks profitability per plant to improve operational efficiency.
- Sell Through % by Facility: Measures the percentage of products sold versus produced, indicating sales success at each location.
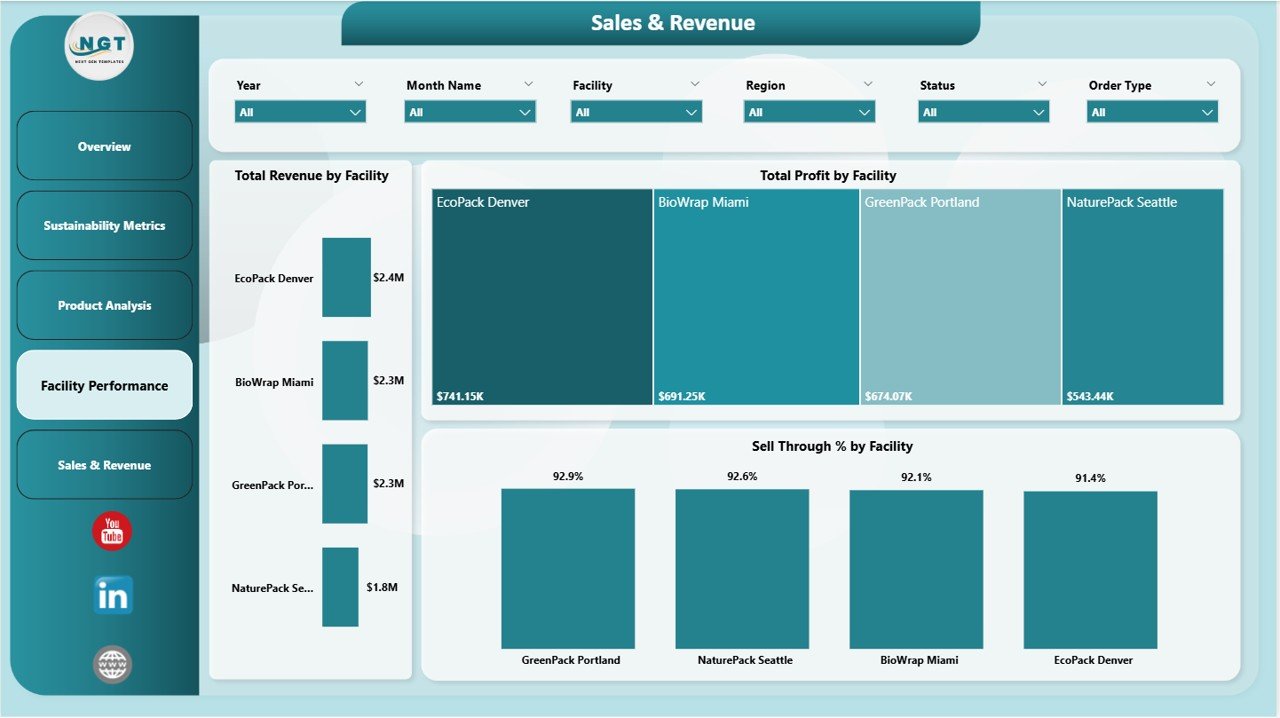
Facility Performance
5 – Sales & Revenue
This section focuses on financial performance and sales trends with charts such as:
- Profit Margin % by Region: Displays regional profitability to help target high-margin markets.
- Total Records by Month Name: Tracks monthly transaction volume to visualize seasonality or growth.
- Total Revenue by Order Type: Breaks down revenue by various sales channels or order classifications.
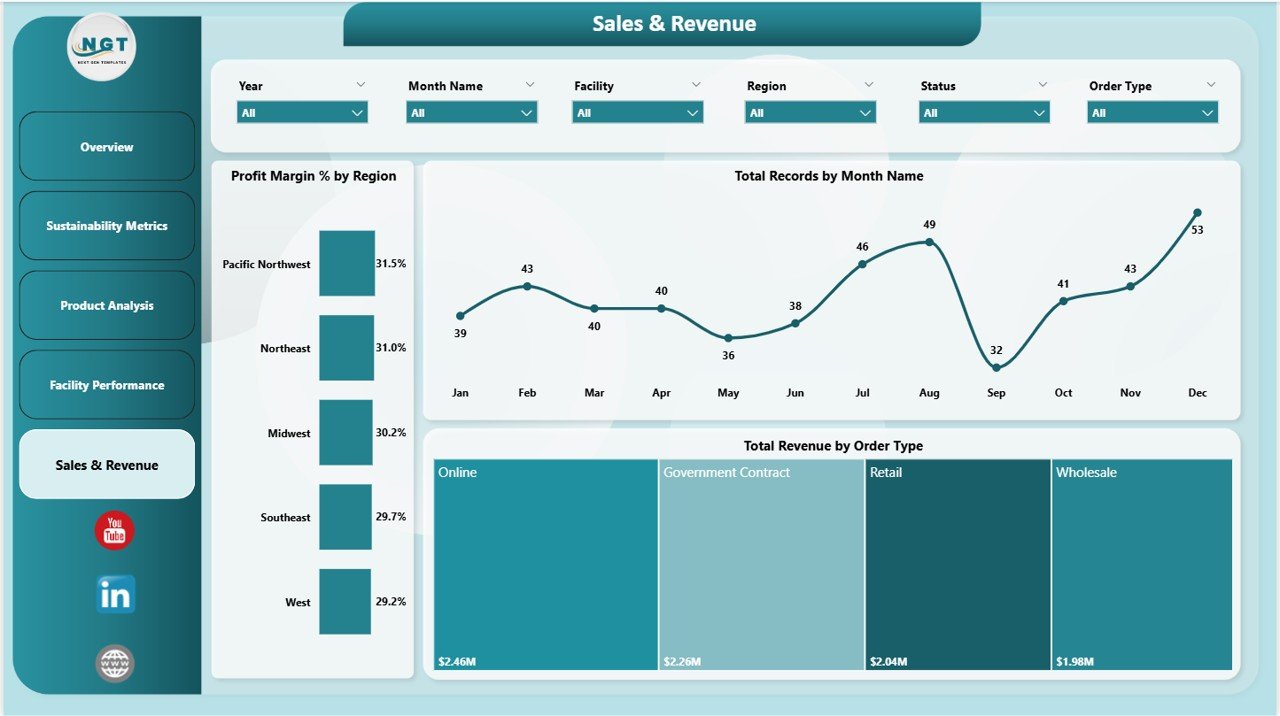
Sales & Revenue
Advantages of Biodegradable Packaging Dashboard in Power BI
- Real-Time Data Insights: Easy to update data and refresh reports for up-to-date analytics.
- Interactive and User-Friendly: Multiple slicers and charts allow users to filter data instantly.
- Comprehensive Coverage: Encompasses production, sustainability, product, facility, and sales metrics in one dashboard.
- Enhanced Decision-Making: Accurate visualizations support strategic planning and operational improvements.
- Cost and Time Efficient: Pre-built structure reduces setup time and resource needs.
Opportunities for Improvement
- Integrate predictive analytics to forecast demand and sustainability trends.
- Add mobile optimization for on-the-go accessibility.
- Include sentiment analysis from customer reviews for deeper rating insights.
- Expand regional detail to city or zip-code level for hyper-local marketing strategies.
- Automate data source connections to reduce manual updates further.
Best Practices
- Ensure your data file is clean and updated before refreshing the dashboard.
- Regularly back up your Power BI file after updates.
- Use consistent naming conventions in your data sources to avoid connection errors.
- Leverage slicers to drill down into key performance indicators effectively.
- Train your team on interpreting the visuals to maximize dashboard value.
FAQs
How do I update the dashboard with new data?
Simply update the data in the connected Data file and open the Power BI file. Click Refresh on the Home tab to load new information.
Is the dashboard customizable?
Yes, you can modify or add visuals within Power BI Desktop to better suit your specific reporting needs.
Can I share this dashboard with my team?
Absolutely! You can publish to Power BI Service and share it securely with colleagues.
Does this dashboard support real-time data streaming?
Currently, it supports periodic refresh via data file updates but can be extended for real-time streaming with advanced configurations.
Click to Purchases Biodegradable Packaging Dashboard in Power BI
Conclusion
The Biodegradable Packaging Dashboard in Power BI serves as an indispensable tool for businesses focused on sustainable packaging products. Its interactive design, wide range of metrics, and easy data integration make it a go-to resource for analyzing production efficiency, sustainability, product performance, and sales trends. By implementing this dashboard, organizations can make insightful decisions quickly, boosting profitability while supporting environmentally responsible practices.
For more tips and detailed walkthroughs, visit the official Power BI documentation.
Visit our YouTube channel to watch the demo.