New: NextGenTemplates Academy - video courses on Excel formulas with AI and Pivot Tables & dashboards. Early-bird: 20% off with code EARLYBIRD20 - first 20 orders only. See the courses →
  • Learn Excel (Free Course)
    • 1. Shortcut Keys
    • 2. Fill & Flash Fill
    • 3. Find & Replace
    • 4. Sort & Filter
    • 5. Formulas & Functions
    • 6. Data Validation
    • 7. Conditional Formatting
    • 8. Basic Charts
    • 9. Advanced Charts
    • 10. Pivot Tables
    • 11. Excel Dashboards
    • 12. VBA Course
    • 13. Excel Formulas with AI
  • Templates
  • Tutorials
    • Charts and Visualization
    • VBA
    • Excel Tips and Tricks
    • Excel Dashboards
    • Power Pivot & DAX
  • Power BI
  • Template Store
    • Ready to Use Templates
  • Courses
  • Academy
    • Excel + AI Mastery: 100 Formulas
    • Excel Pivot Tables & Dashboards
  • About Us
  • Contact Us

PK: An Excel Expert

Transforming Data into Decisions
Tag: MTD YTD analysis

Dashboard

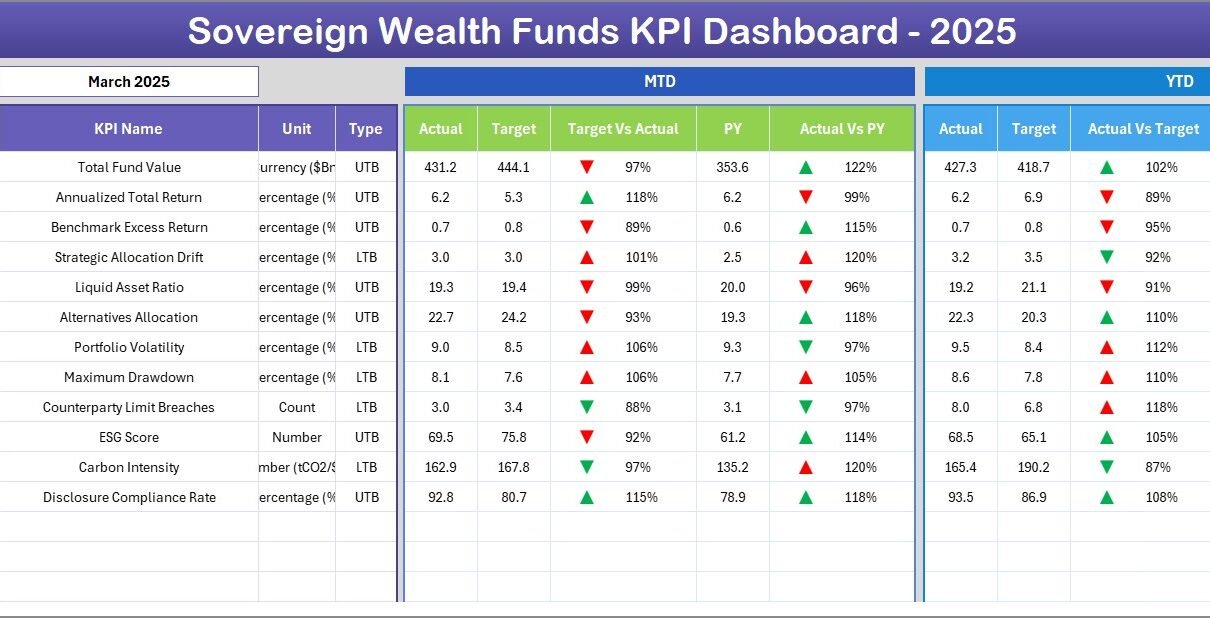
Sovereign Wealth Funds KPI Dashboard in Excel

May 16, 2026May 16, 2026 PKComments Off on Sovereign Wealth Funds KPI Dashboard in Excel
Sovereign Wealth Funds (SWFs) managed over $11.5 trillion in assets globally in 2025, with the top 100 funds growing AUM by 8.4% year-over-year according to the Global SWF 2025 report.
Read More
Dashboard Power BI

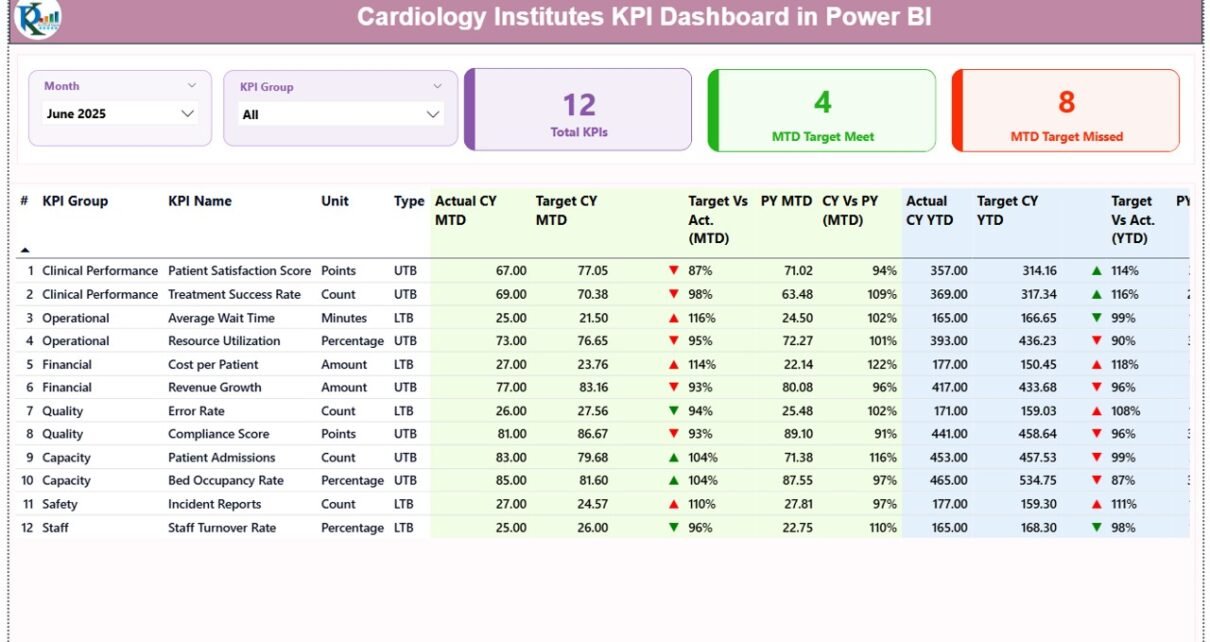
Cardiology Institutes KPI Dashboard in Power BI

March 17, 2026March 17, 2026 PKComments Off on Cardiology Institutes KPI Dashboard in Power BI
In today’s fast-paced healthcare environment, cardiology institutes must track performance with precision. Hospitals handle critical heart-related cases every day. Therefore, decision-makers need accurate, real-time insights to improve patient outcomes and
Read More
Dashboard Power BI

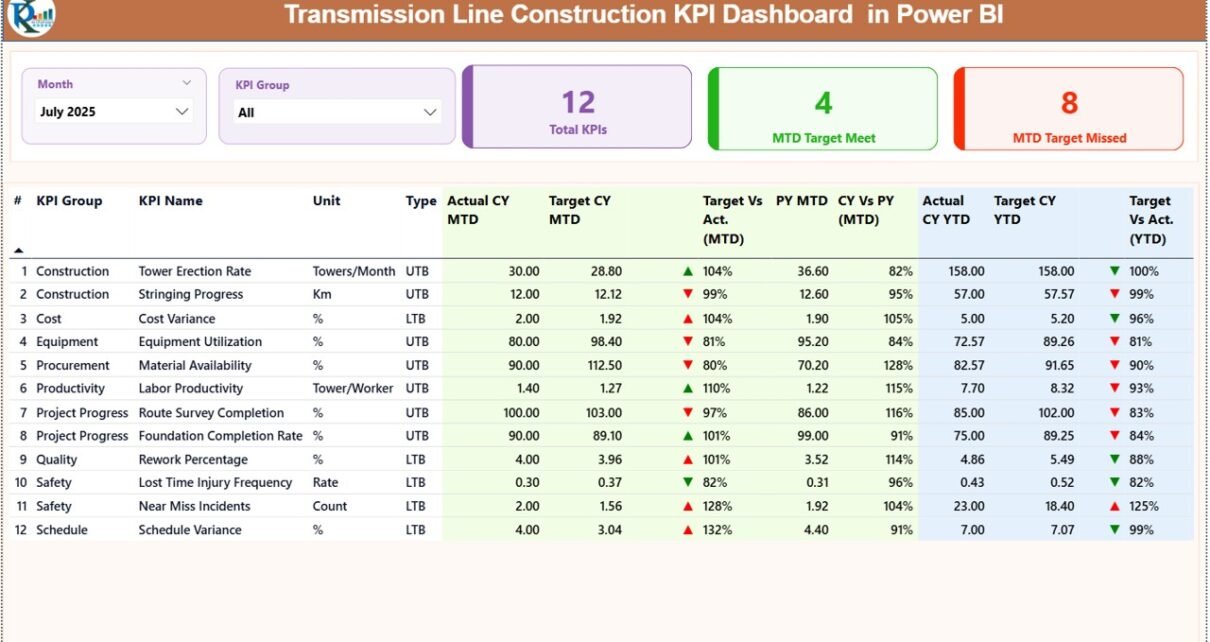
Transmission Line Construction KPI Dashboard in Power BI

March 3, 2026March 3, 2026 PKComments Off on Transmission Line Construction KPI Dashboard in Power BI
Managing transmission line construction projects requires speed, control, and clear performance tracking. However, many project teams still depend on scattered spreadsheets and manual reports. As a result, managers struggle to
Read More
Dashboard Power BI

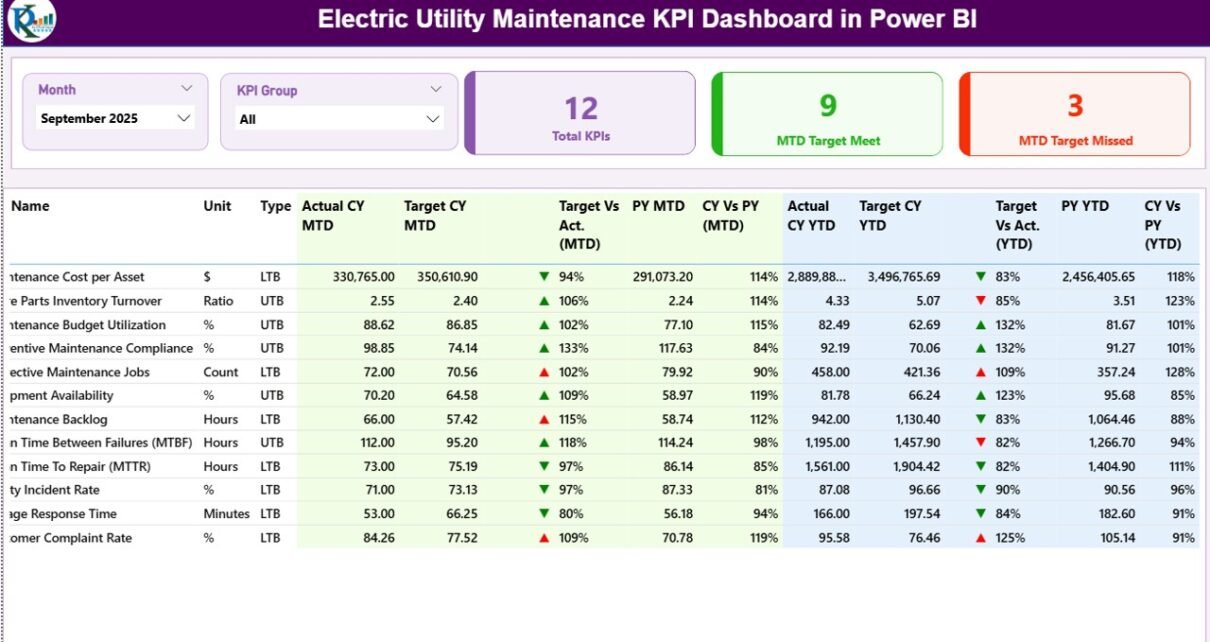
Electric Utility Maintenance KPI Dashboard in Power BI

March 3, 2026March 3, 2026 PKComments Off on Electric Utility Maintenance KPI Dashboard in Power BI
Electric utility companies manage complex assets every single day. They maintain substations, transformers, feeders, smart meters, and transmission lines. However, without clear performance tracking, teams lose control over downtime, service
Read More
Dashboard Power BI

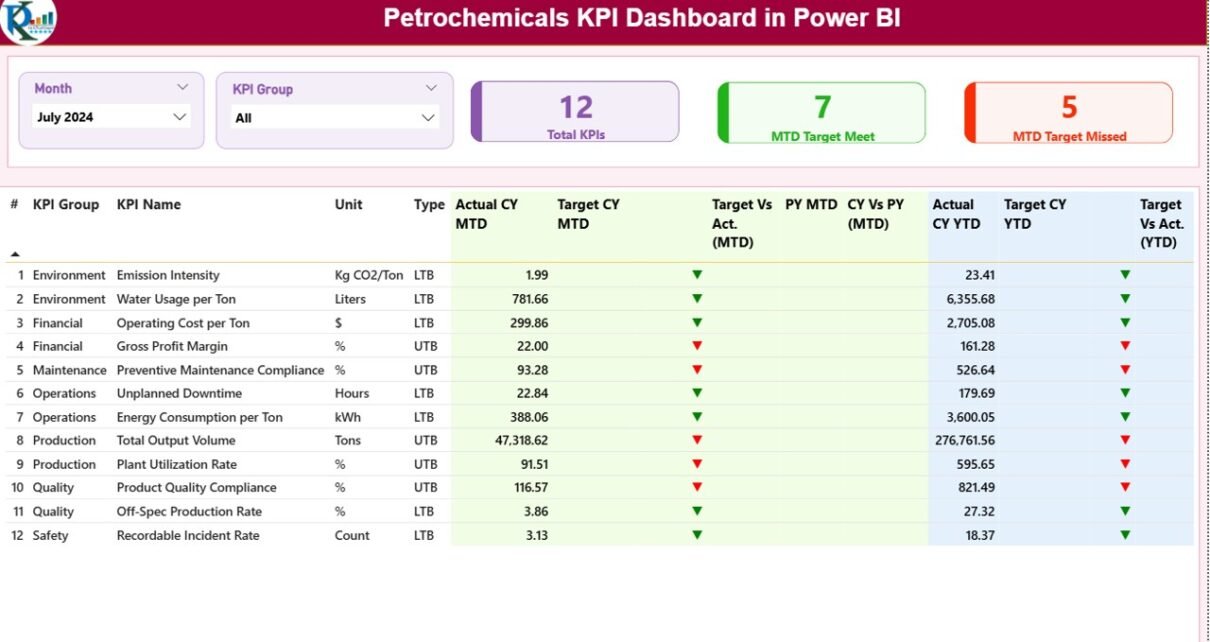
Petrochemicals KPI Dashboard in Power BI

February 26, 2026February 26, 2026 PKComments Off on Petrochemicals KPI Dashboard in Power BI
The petrochemical industry operates in a highly competitive and performance-driven environment. Companies must monitor production efficiency, operational reliability, safety compliance, cost control, and financial performance continuously. However, many organizations still
Read More
Dashboard Power BI

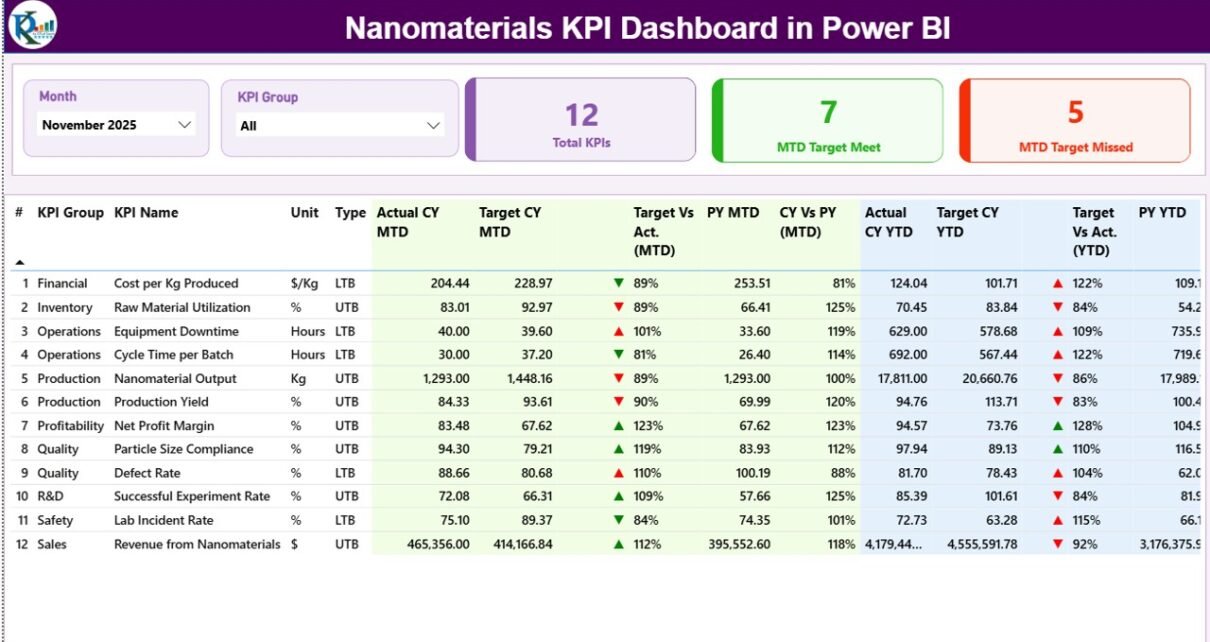
Nanomaterials KPI Dashboard in Power BI

February 26, 2026February 26, 2026 PKComments Off on Nanomaterials KPI Dashboard in Power BI
Modern nanotechnology organizations operate in a highly data-driven environment. Companies involved in nanomaterials research, manufacturing, and commercialization must continuously monitor performance indicators such as production efficiency, material quality, research output,
Read More
Dashboard Power BI

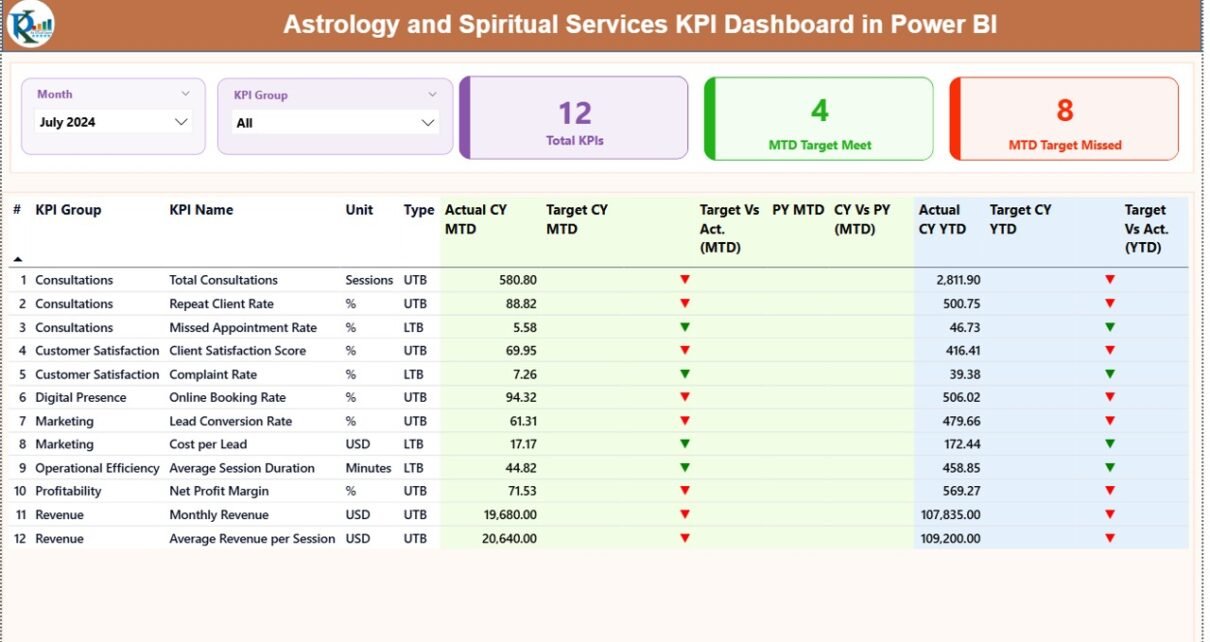
Astrology and Spiritual Services KPI Dashboard in Power BI

February 21, 2026February 21, 2026 PKComments Off on Astrology and Spiritual Services KPI Dashboard in Power BI
The astrology and spiritual services industry has grown rapidly in recent years. More people now seek guidance through astrology consultations, tarot readings, healing sessions, and spiritual workshops. However, as demand
Read More
Dashboard Power BI

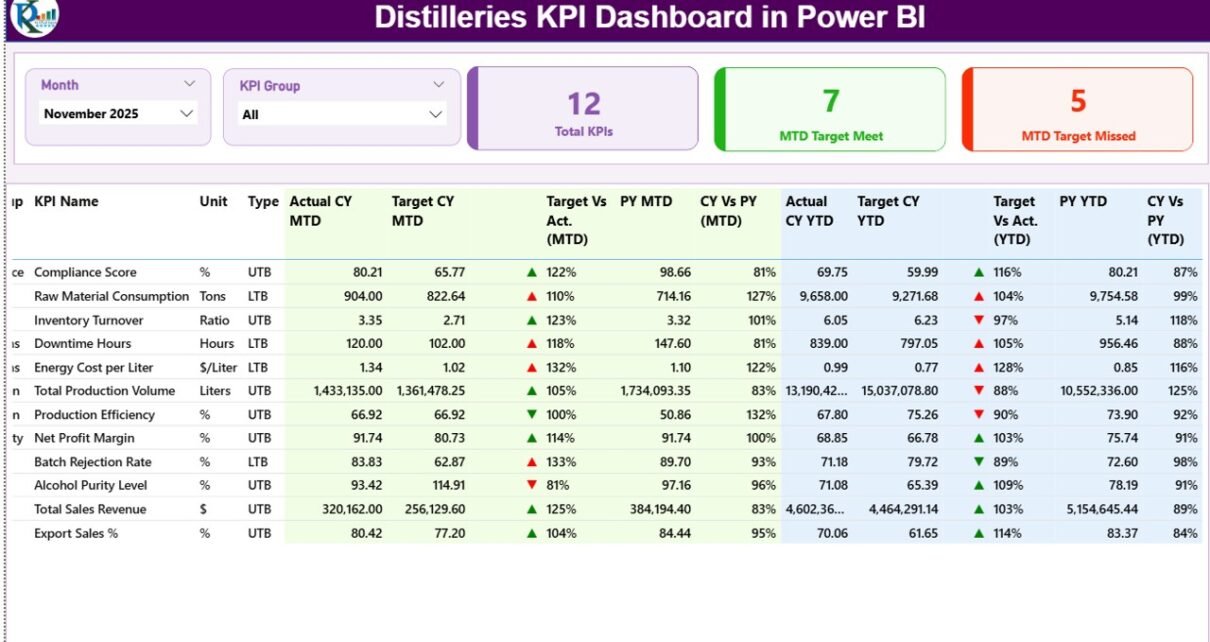
Distilleries KPI Dashboard in Power BI

February 19, 2026February 19, 2026 PKComments Off on Distilleries KPI Dashboard in Power BI
Managing a distillery does not stop at producing premium spirits. You must control production efficiency, monitor yield, track losses, manage quality, and hit revenue targets every single month. However, many
Read More
Dashboard Power BI

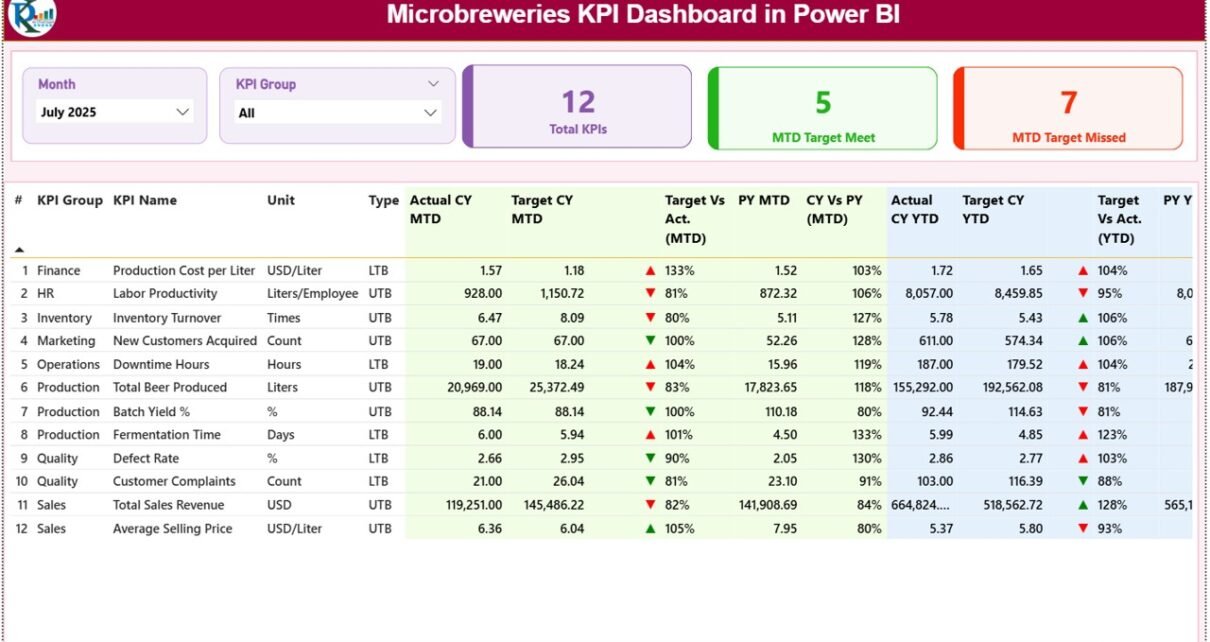
Microbreweries KPI Dashboard in Power BI

February 19, 2026February 19, 2026 PKComments Off on Microbreweries KPI Dashboard in Power BI
Running a microbrewery feels exciting. However, excitement alone does not grow profits. You must control production, monitor quality, track costs, and compare sales month after month. Otherwise, small inefficiencies will
Read More
Dashboard Power BI

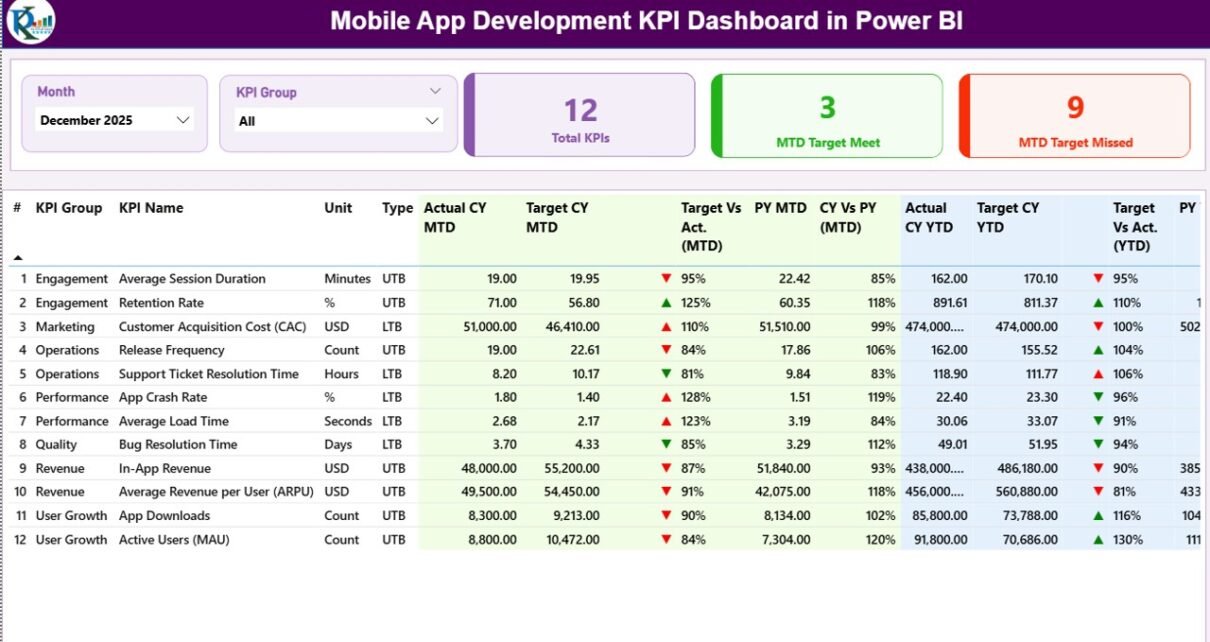
Mobile App Development KPI Dashboard in Power BI

February 16, 2026February 16, 2026 PKComments Off on Mobile App Development KPI Dashboard in Power BI
Mobile app development moves fast. New features launch every week. User feedback changes daily. Competition grows every month. Therefore, you must track performance consistently and clearly. However, many app development
Read More

Posts pagination

1 2 … 8 Next
  • Learn Excel (Free Course)
    • 1. Shortcut Keys
    • 2. Fill & Flash Fill
    • 3. Find & Replace
    • 4. Sort & Filter
    • 5. Formulas & Functions
    • 6. Data Validation
    • 7. Conditional Formatting
    • 8. Basic Charts
    • 9. Advanced Charts
    • 10. Pivot Tables
    • 11. Excel Dashboards
    • 12. VBA Course
    • 13. Excel Formulas with AI
  • Templates
  • Tutorials
    • Charts and Visualization
    • VBA
    • Excel Tips and Tricks
    • Excel Dashboards
    • Power Pivot & DAX
  • Power BI
  • Template Store
    • Ready to Use Templates
  • Courses
  • Academy
    • Excel + AI Mastery: 100 Formulas
    • Excel Pivot Tables & Dashboards
  • About Us
  • Contact Us
Copyright © 2023 PK-AnExcelExpert.com - Privacy Policy