New: NextGenTemplates Academy - video courses on Excel formulas with AI and Pivot Tables & dashboards. Early-bird: 20% off with code EARLYBIRD20 - first 20 orders only. See the courses →
  • Learn Excel (Free Course)
    • 1. Shortcut Keys
    • 2. Fill & Flash Fill
    • 3. Find & Replace
    • 4. Sort & Filter
    • 5. Formulas & Functions
    • 6. Data Validation
    • 7. Conditional Formatting
    • 8. Basic Charts
    • 9. Advanced Charts
    • 10. Pivot Tables
    • 11. Excel Dashboards
    • 12. VBA Course
    • 13. Excel Formulas with AI
  • Templates
  • Tutorials
    • Charts and Visualization
    • VBA
    • Excel Tips and Tricks
    • Excel Dashboards
    • Power Pivot & DAX
  • Power BI
  • Template Store
    • Ready to Use Templates
  • Courses
  • Academy
    • Excel + AI Mastery: 100 Formulas
    • Excel Pivot Tables & Dashboards
  • About Us
  • Contact Us

PK: An Excel Expert

Transforming Data into Decisions

Tag: MTD YTD analysis

Templates

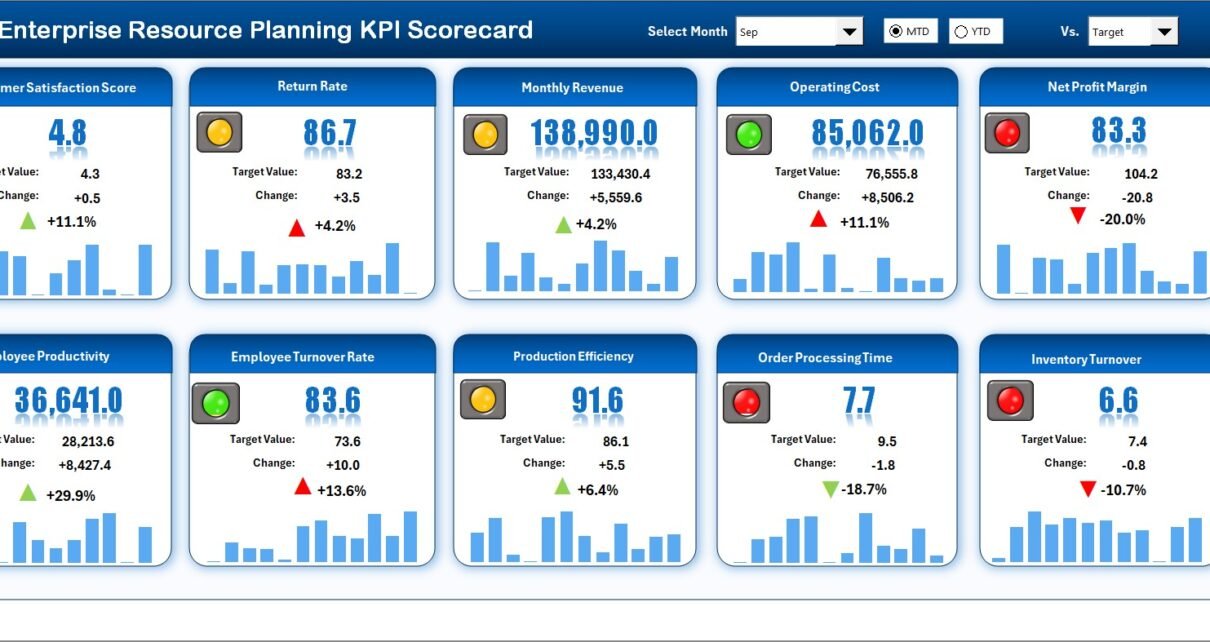
Enterprise Resource Planning KPI Scorecard in Excel

February 15, 2026February 15, 2026 PKComments Off on Enterprise Resource Planning KPI Scorecard in Excel
Modern businesses run on data. However, data alone does not drive performance. Companies must measure, compare, and analyze performance regularly. Therefore, organizations need a structured system to track Enterprise Resource
Read More
Dashboard Power BI

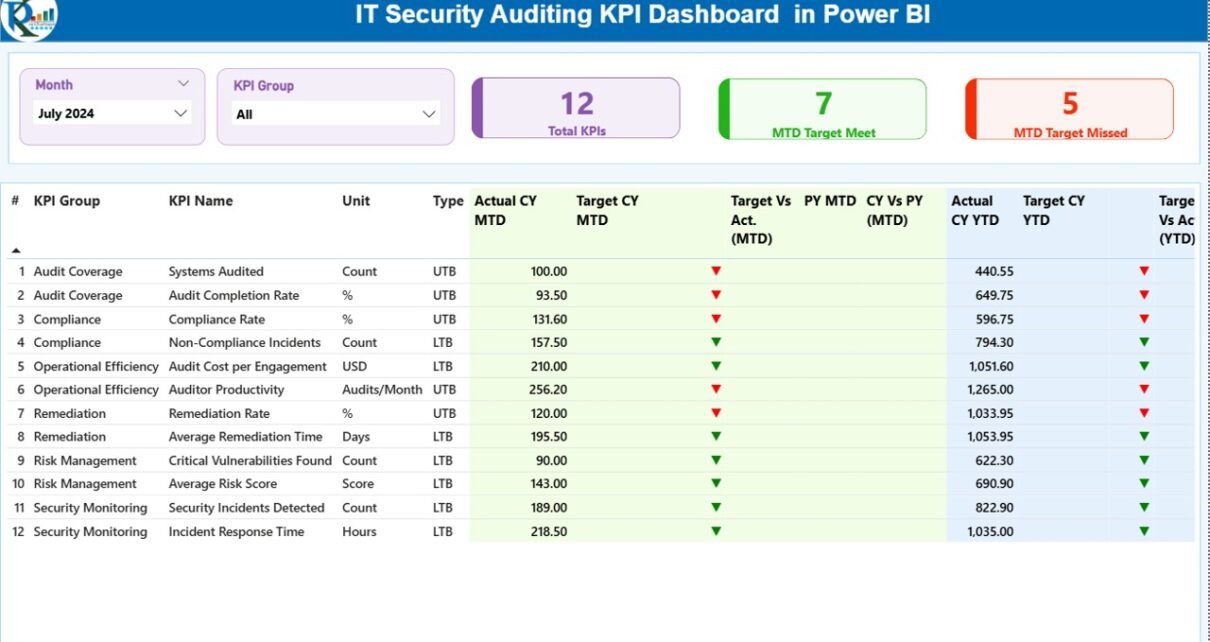
IT Security Auditing KPI Dashboard in Power BI

February 15, 2026February 15, 2026 PKComments Off on IT Security Auditing KPI Dashboard in Power BI
In today’s digital world, cyber threats grow every single day. Hackers target systems. Data breaches increase. Compliance rules change frequently. Therefore, organizations must track security performance continuously. However, many IT
Read More
Dashboard Power BI

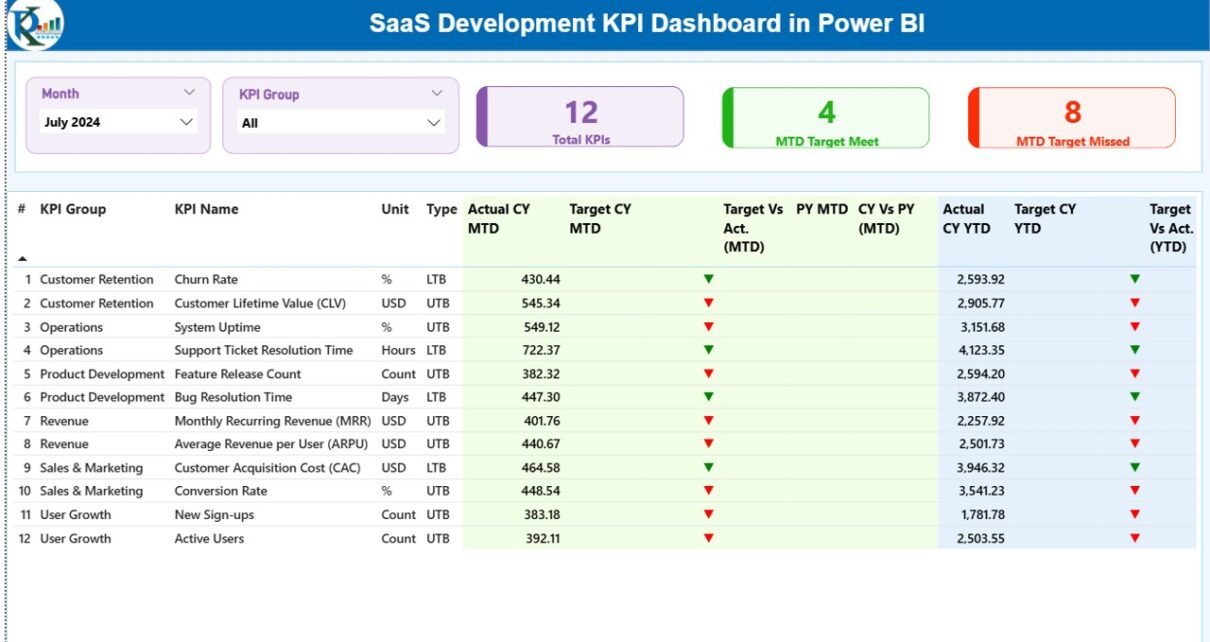
SaaS Development KPI Dashboard in Power BI

February 14, 2026February 14, 2026 PKComments Off on SaaS Development KPI Dashboard in Power BI
In today’s competitive SaaS industry, speed matters. However, clarity matters even more. You may build an innovative product, yet without performance tracking, growth slows down. Teams struggle. Leaders guess. Investors
Read More
Dashboard Power BI

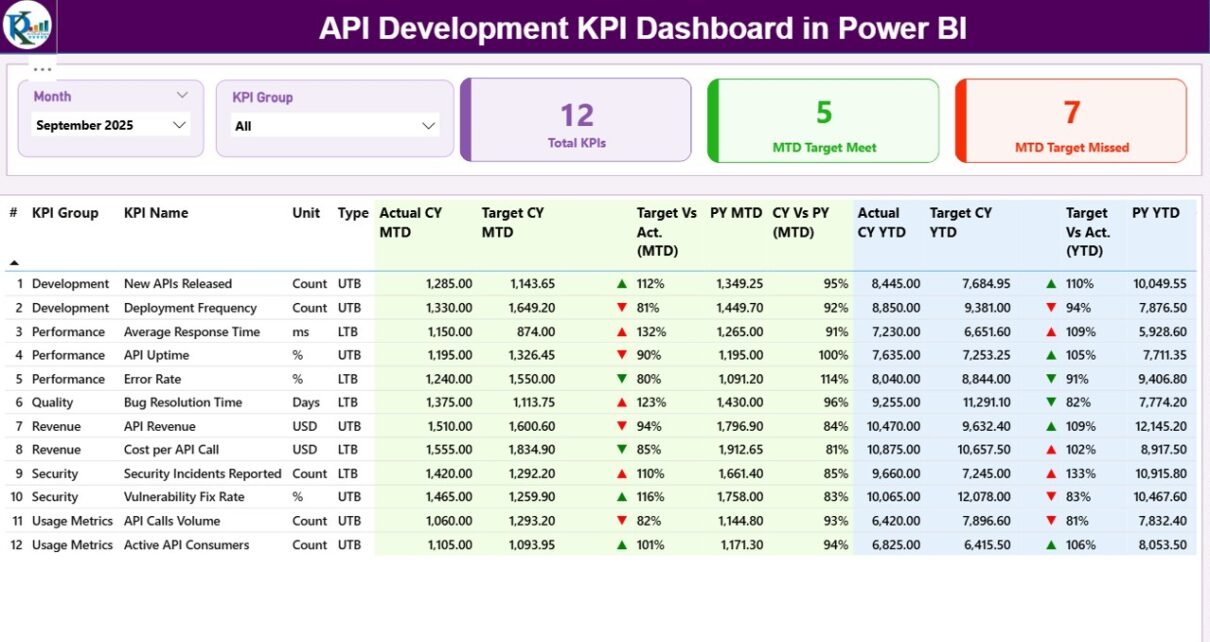
API Development KPI Dashboard in Power BI

February 14, 2026February 14, 2026 PKComments Off on API Development KPI Dashboard in Power BI
Modern businesses run on APIs. Every mobile app, SaaS product, fintech solution, and e-commerce platform depends on APIs. However, many teams still track API performance in scattered Excel sheets. As
Read More
Templates

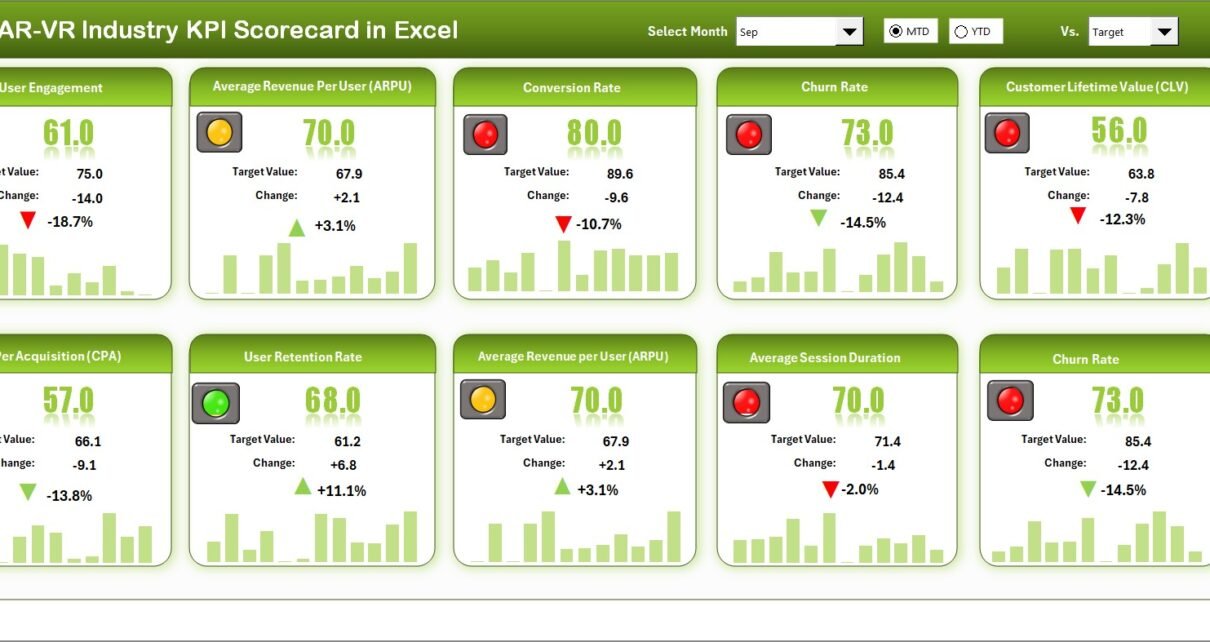
AR-VR Industry KPI Scorecard in Excel

February 13, 2026February 13, 2026 PKComments Off on AR-VR Industry KPI Scorecard in Excel
The AR-VR industry moves fast. New hardware launches every quarter. Software updates roll out every week. Meanwhile, investors demand growth. Customers expect innovation. Teams need clarity.However, many AR-VR companies still
Read More
Dashboard Power BI

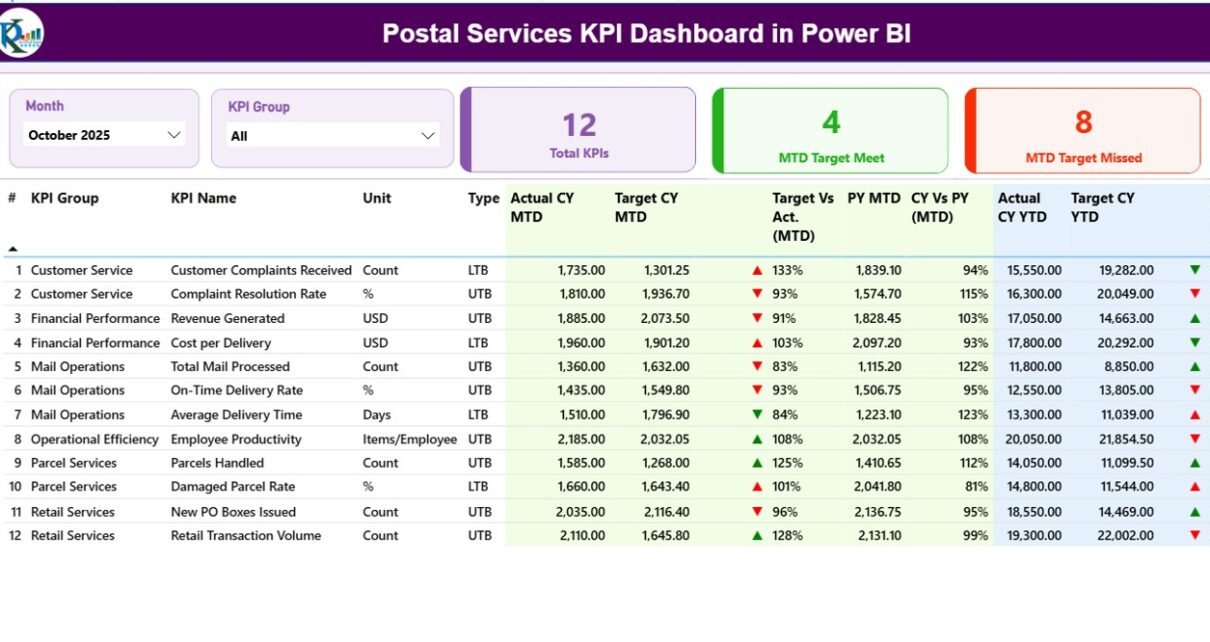
Postal Services KPI Dashboard in Power BI

February 13, 2026February 13, 2026 PKComments Off on Postal Services KPI Dashboard in Power BI
In today’s fast-moving logistics environment, postal organizations must track performance daily. Customers expect fast delivery. Managers demand accuracy. Regulators require compliance. Therefore, postal departments need clear visibility into their KPIs.
Read More
Dashboard Power BI

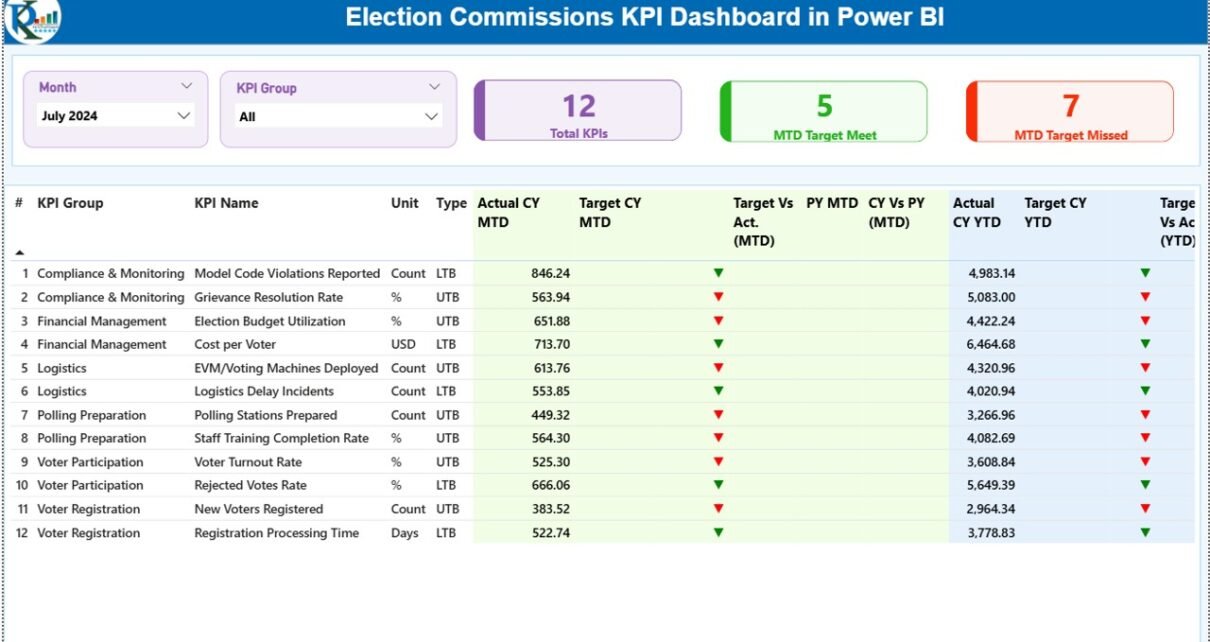
Election Commissions KPI Dashboard in Power BI

February 13, 2026February 13, 2026 PKComments Off on Election Commissions KPI Dashboard in Power BI
Free, fair, and transparent elections build trust in democracy. However, election bodies often struggle with scattered reports, delayed updates, and manual tracking. As a result, decision-makers cannot see real-time performance.So,
Read More
Dashboard Power BI

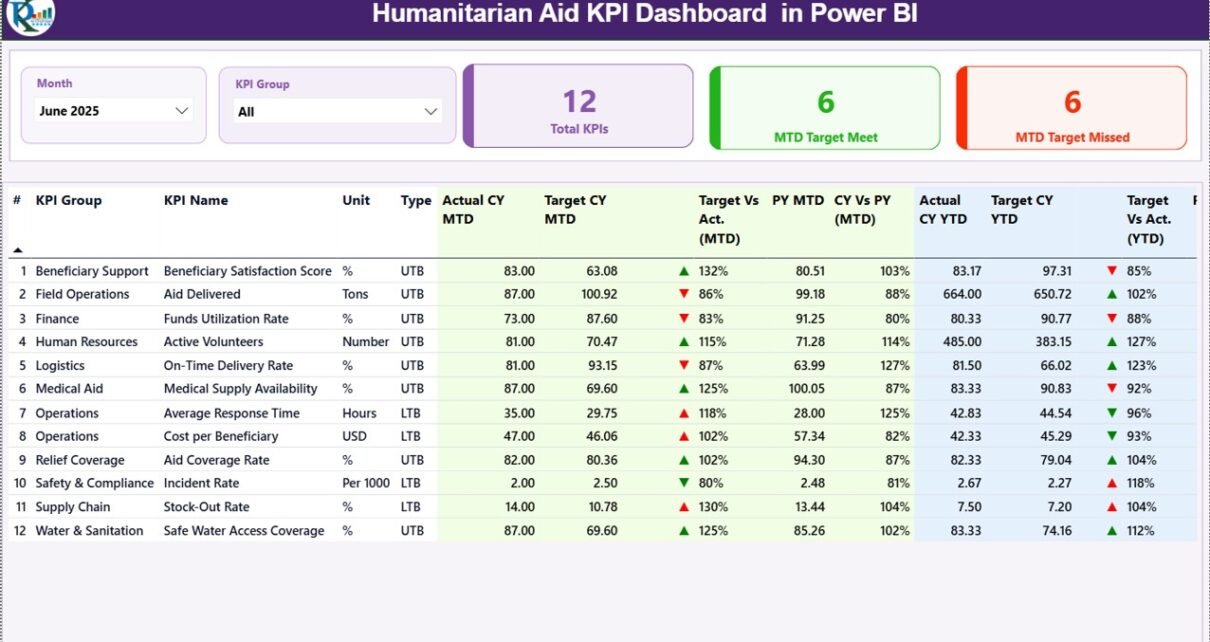
Humanitarian Aid KPI Dashboard in Power BI

February 12, 2026February 12, 2026 PKComments Off on Humanitarian Aid KPI Dashboard in Power BI
Humanitarian organizations work in high-pressure environments. They deliver food, medical supplies, shelter, education, and emergency response services across regions. However, without structured performance tracking, leaders struggle to measure real impact.
Read More
Dashboard Power BI

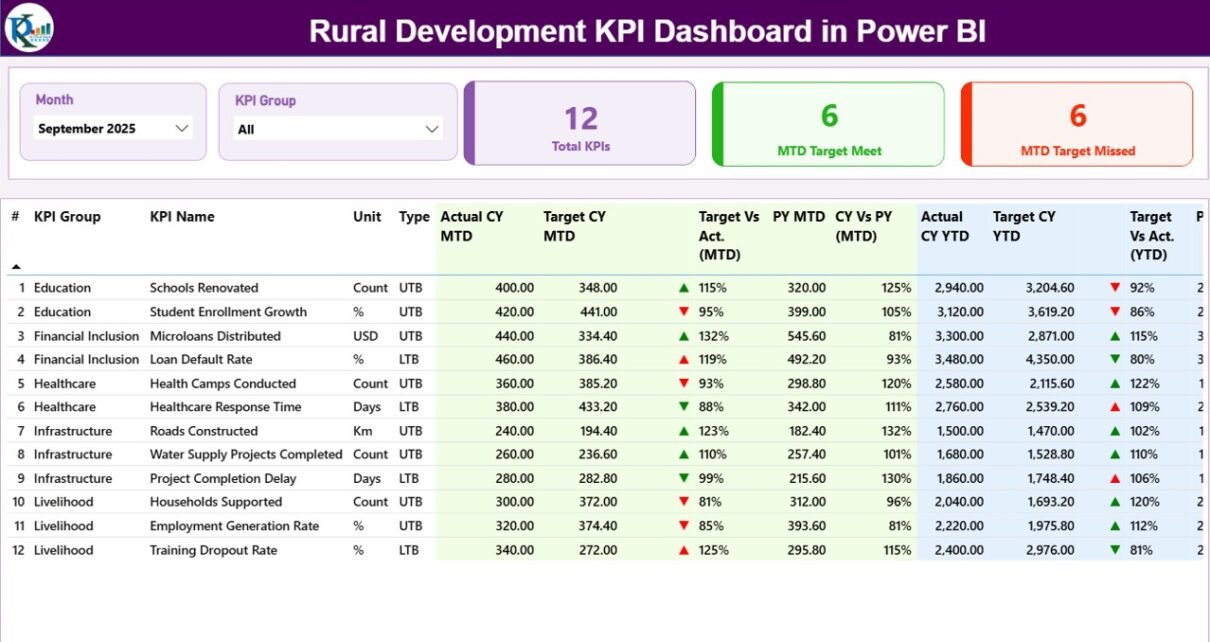
Rural Development KPI Dashboard in Power BI

February 12, 2026February 12, 2026 PKComments Off on Rural Development KPI Dashboard in Power BI
Rural development drives economic stability, social growth, and long-term sustainability. However, many government bodies and NGOs still track rural programs using scattered spreadsheets. As a result, decision-makers struggle to measure
Read More
Dashboard Power BI

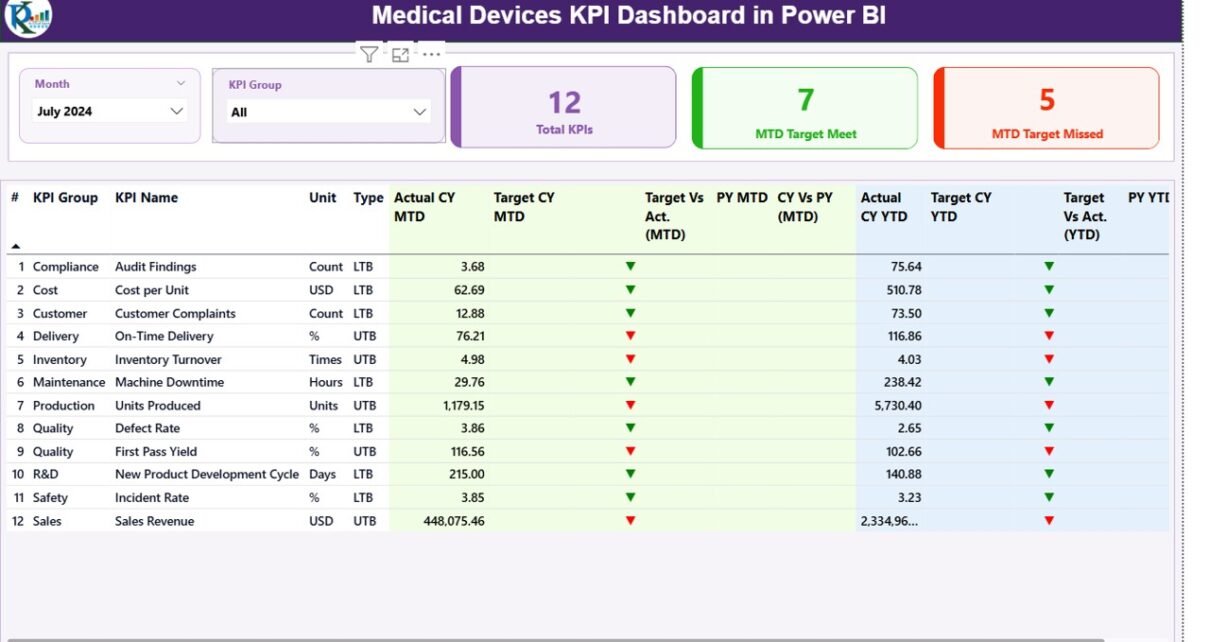
Medical Devices KPI Dashboard in Power BI

February 10, 2026February 10, 2026 PKComments Off on Medical Devices KPI Dashboard in Power BI
The medical devices industry demands precision, compliance, and consistent performance. Every month, teams monitor production output, defect rates, regulatory metrics, sales growth, and service performance. However, many organizations still rely
Read More

Posts pagination

Previous 1 2 3 … 8 Next
  • Learn Excel (Free Course)
    • 1. Shortcut Keys
    • 2. Fill & Flash Fill
    • 3. Find & Replace
    • 4. Sort & Filter
    • 5. Formulas & Functions
    • 6. Data Validation
    • 7. Conditional Formatting
    • 8. Basic Charts
    • 9. Advanced Charts
    • 10. Pivot Tables
    • 11. Excel Dashboards
    • 12. VBA Course
    • 13. Excel Formulas with AI
  • Templates
  • Tutorials
    • Charts and Visualization
    • VBA
    • Excel Tips and Tricks
    • Excel Dashboards
    • Power Pivot & DAX
  • Power BI
  • Template Store
    • Ready to Use Templates
  • Courses
  • Academy
    • Excel + AI Mastery: 100 Formulas
    • Excel Pivot Tables & Dashboards
  • About Us
  • Contact Us
Copyright © 2023 PK-AnExcelExpert.com - Privacy Policy