New: NextGenTemplates Academy - video courses on Excel formulas with AI and Pivot Tables & dashboards. Early-bird: 20% off with code EARLYBIRD20 - first 20 orders only.See the courses →
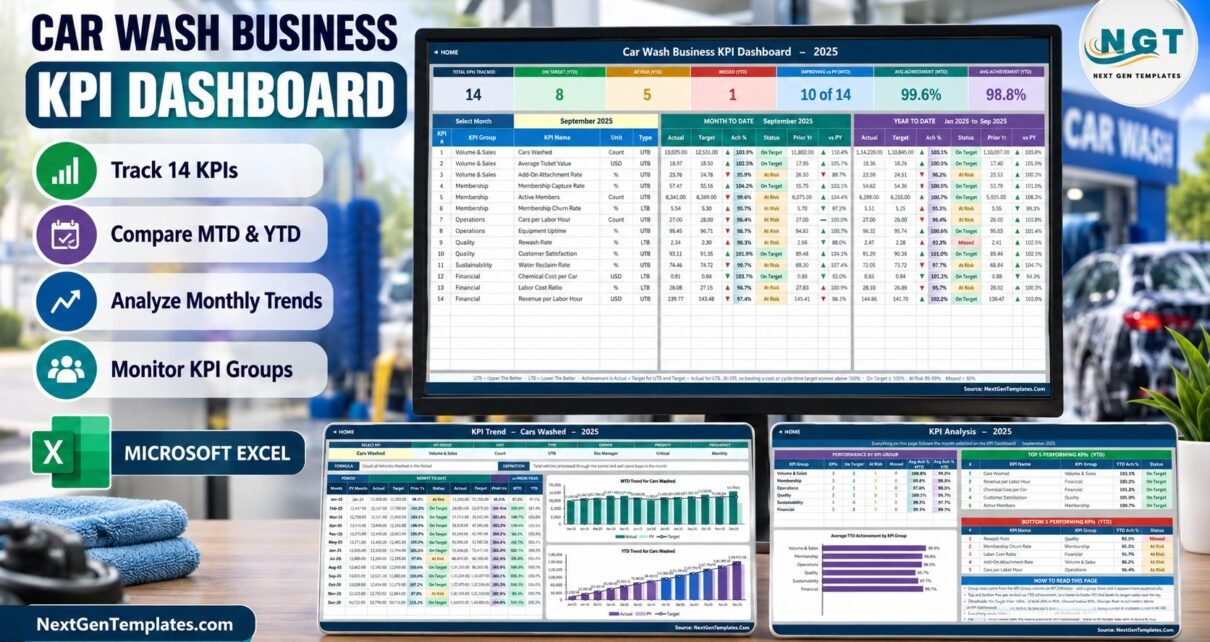
PKComments Off on Car Wash Business KPI Dashboard in Excel
The Car Wash Business KPI Dashboard in Excel scores 14 car wash KPIs in 6 groups - month-to-date and year-to-date - against target and prior year, on a 10-sheet workbook
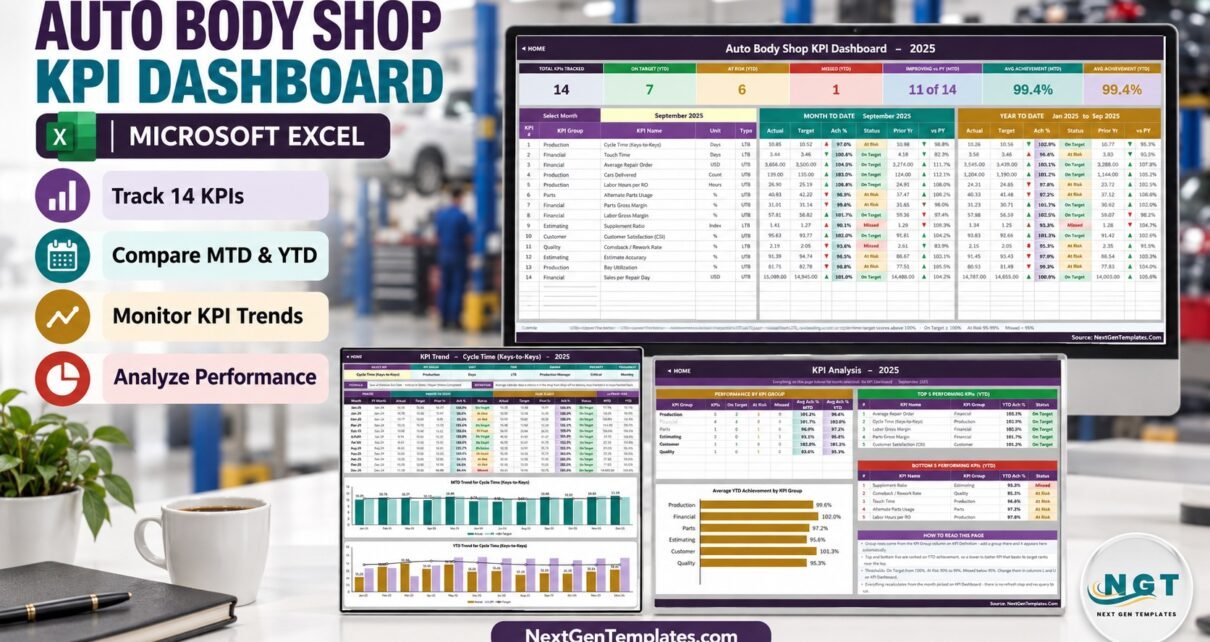
PKComments Off on Auto Body Shop KPI Dashboard in Excel
The Auto Body Shop KPI Dashboard in Excel turns a collision shop's monthly numbers into one scored view: 14 KPIs in 6 groups, each measured month to date and year
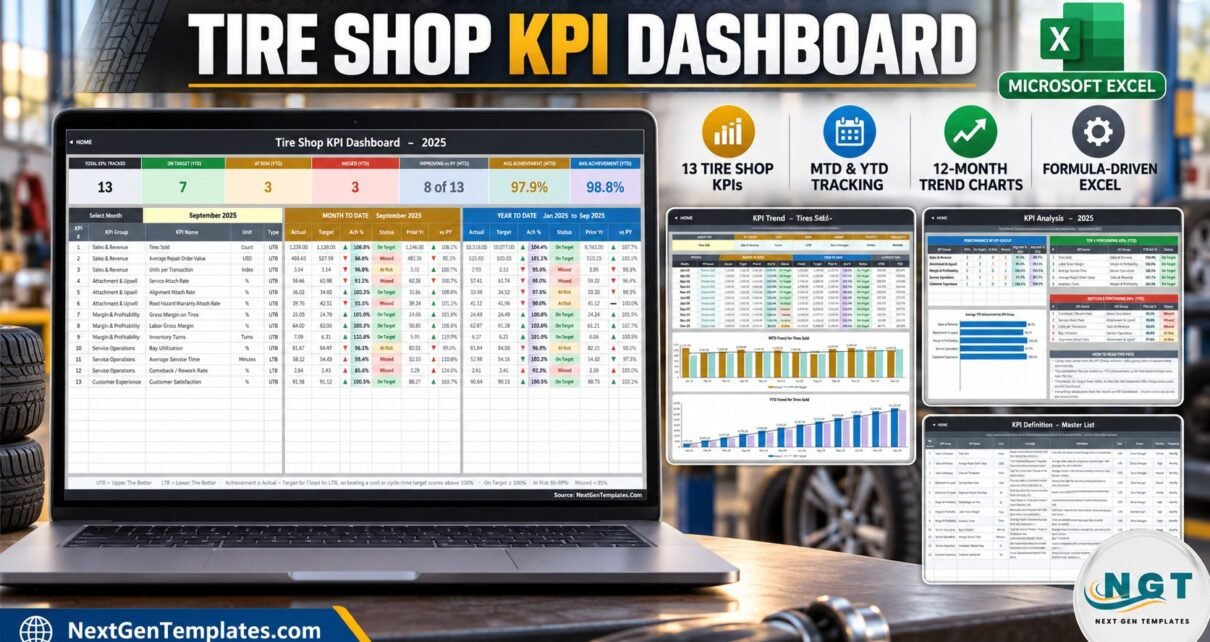
PKComments Off on Tire Shop KPI Dashboard in Excel
The Tire Shop KPI Dashboard in Excel puts 13 tire-shop KPIs, 5 KPI groups and 11 worksheets behind a single month dropdown. Pick a month in one cell and seven
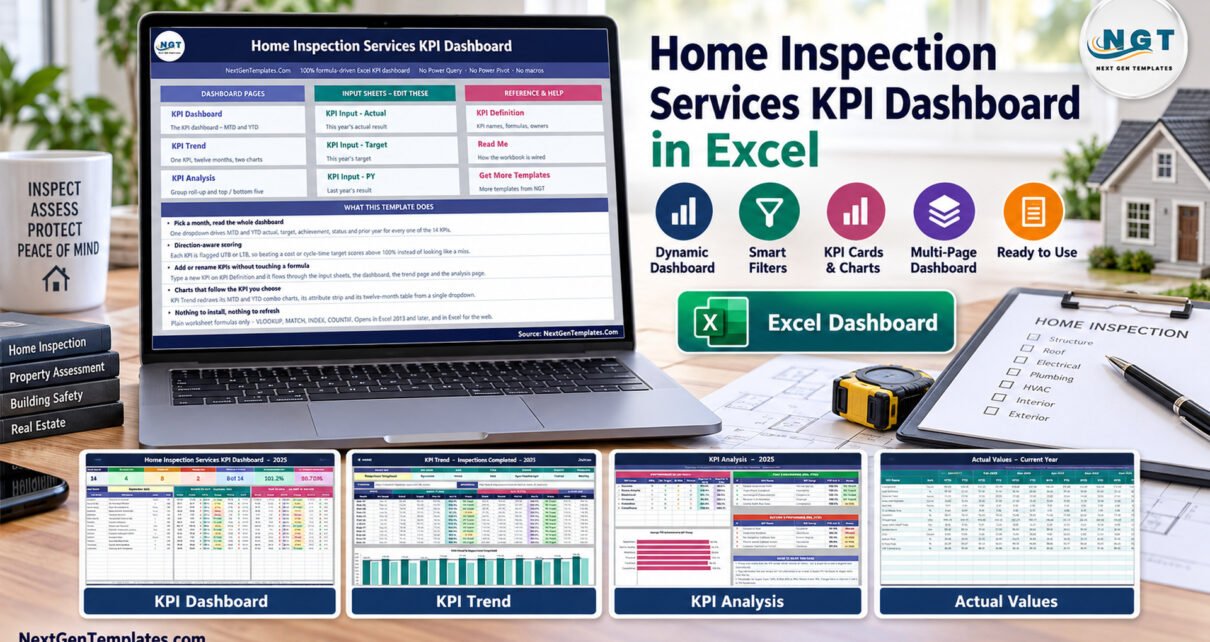
PKComments Off on Home Inspection Services KPI Dashboard in Excel
Home inspection services KPI dashboard in Excel turns monthly inspection-company figures into a structured management view. Instead of reviewing separate spreadsheets for jobs, turnaround, callbacks, revenue, customer feedback, and compliance,
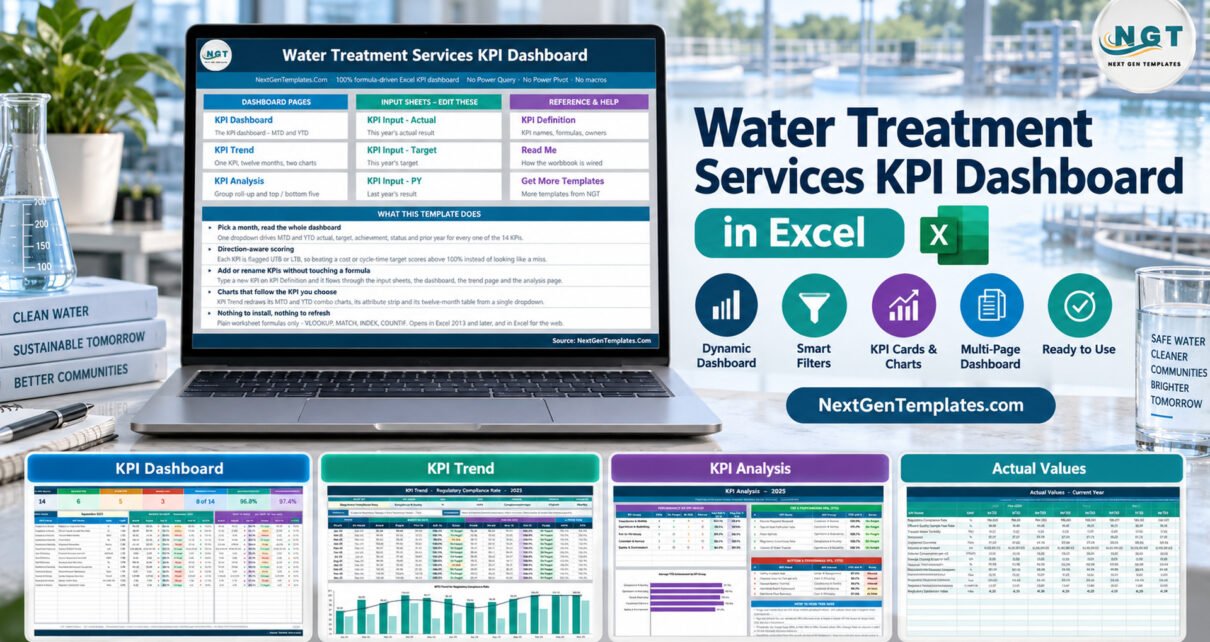
PKComments Off on Water Treatment Services KPI Dashboard in Excel
Water Treatment Services KPI Dashboard in Excel brings 14 defined water-treatment measures into one formula-driven workbook. Instead of reviewing compliance, laboratory, operations, maintenance, cost, safety, and service figures in separate
PKComments Off on Boiler Maintenance KPI Dashboard in Excel
The Boiler Maintenance KPI Dashboard in Excel is a ready-to-use monthly reporting workbook for boiler servicing and heating-maintenance teams. It tracks twelve editable KPIs across service quality, safety, delivery, workforce,
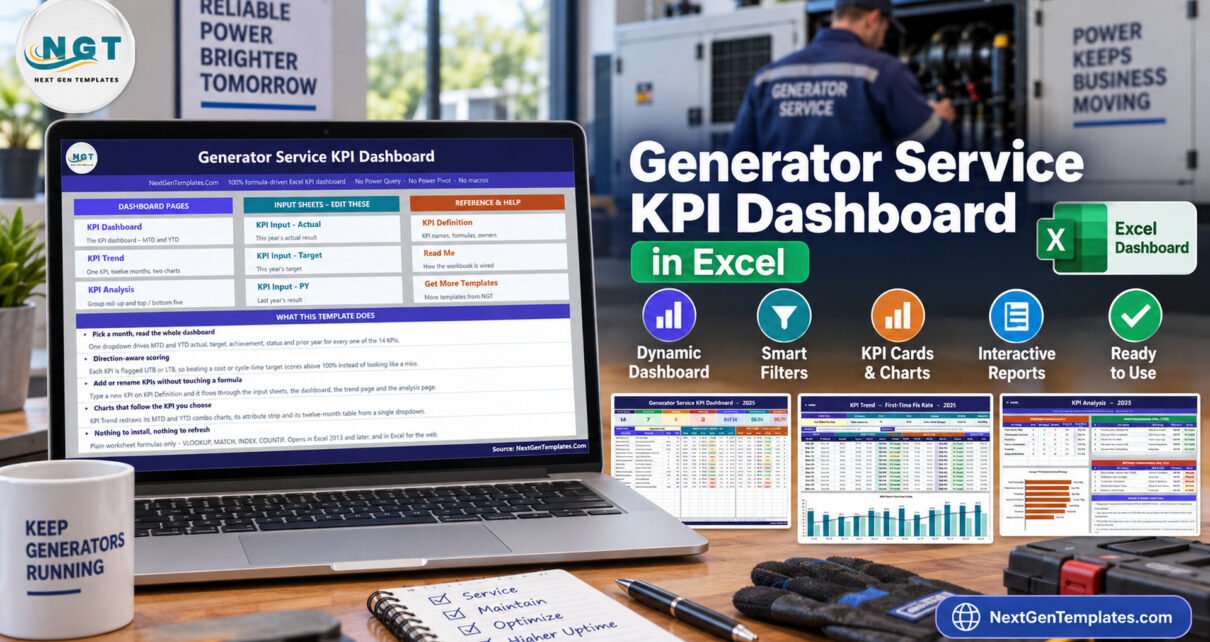
PKComments Off on Generator Service KPI Dashboard in Excel
The Generator Service KPI Dashboard in Excel puts 14 generator service KPIs from 6 groups on one monthly scorecard. For each KPI it shows MTD and YTD actual, target, achievement
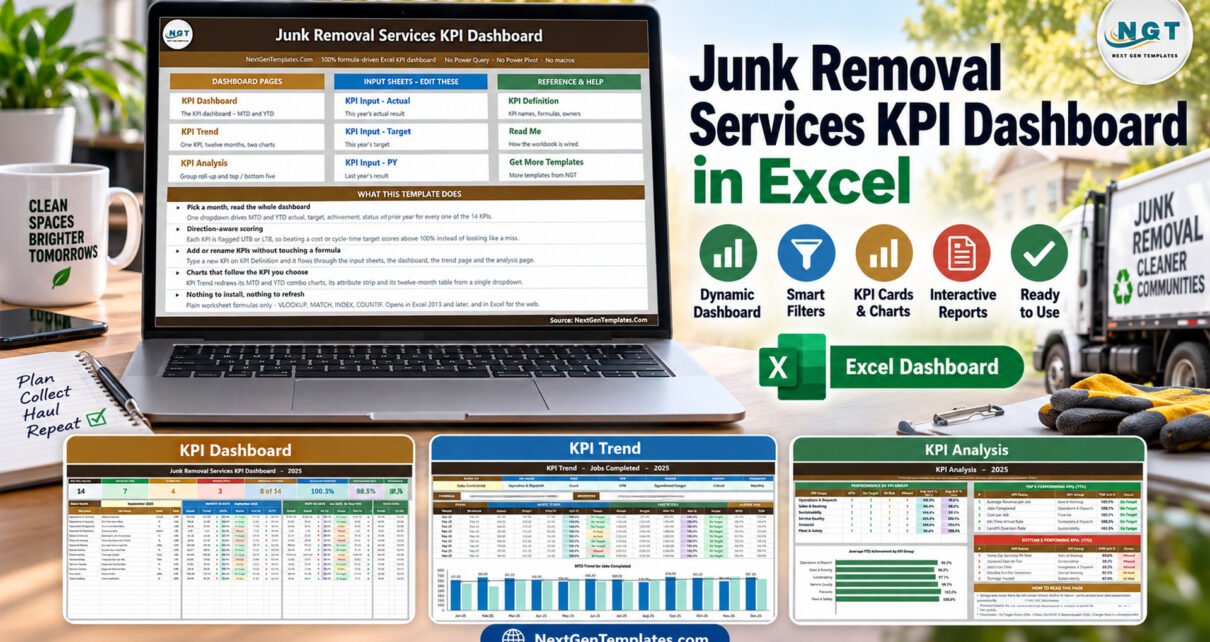
PKComments Off on Junk Removal Services KPI Dashboard in Excel
The Junk Removal Services KPI Dashboard in Excel tracks 14 KPIs across 6 groups on one month-driven scorecard. Every KPI shows MTD and YTD actual, target, achievement %, a traffic-light
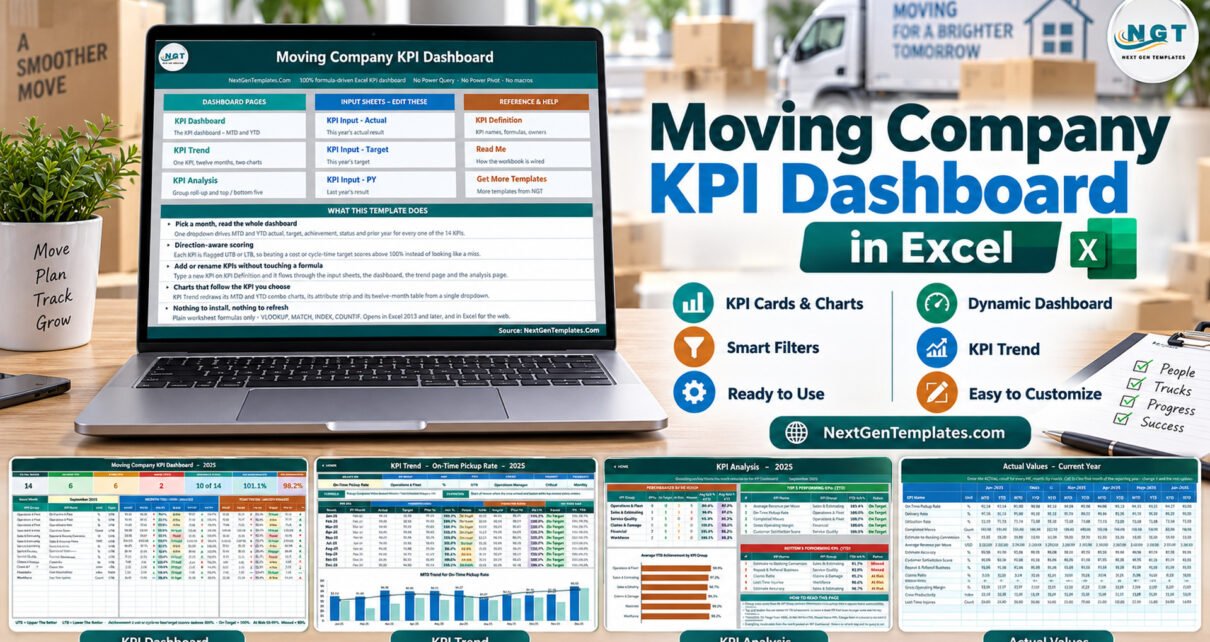
PKComments Off on Moving Company KPI Dashboard in Excel
The Moving Company KPI Dashboard in Excel tracks 14 KPIs across 6 groups on one month-driven scorecard. Every KPI shows MTD and YTD actual, target, achievement %, a traffic-light status
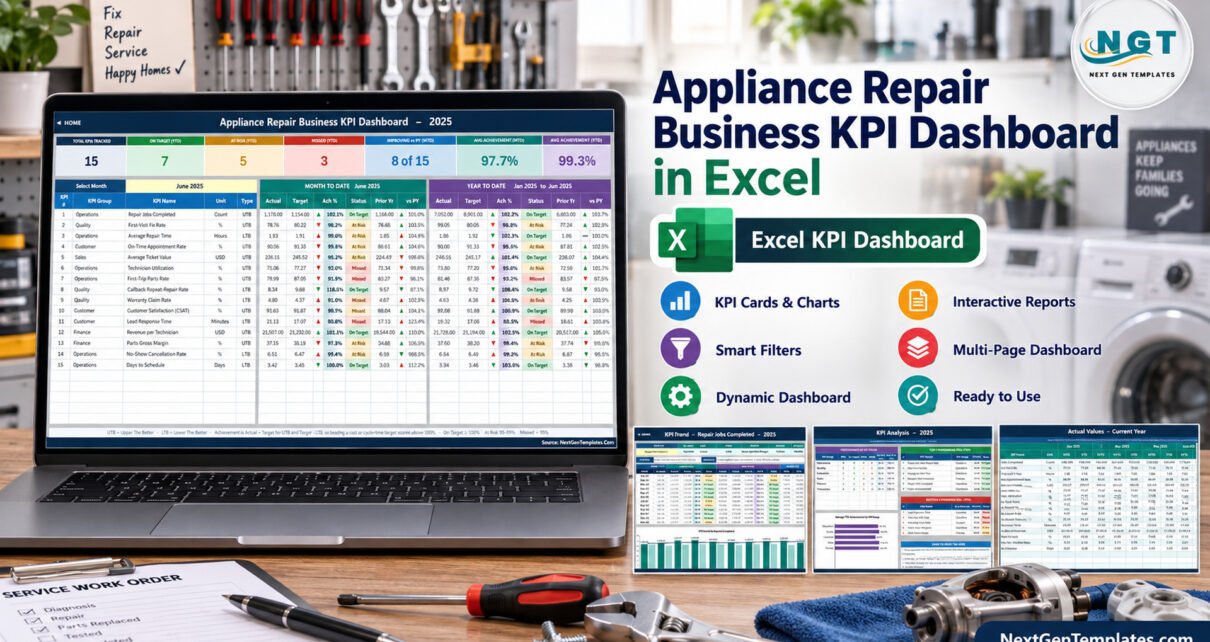
PKComments Off on Appliance Repair Business KPI Dashboard in Excel
The Appliance Repair Business KPI Dashboard in Excel puts 15 appliance repair KPIs from 5 groups on one monthly scorecard. For each KPI it shows MTD and YTD actual, target,