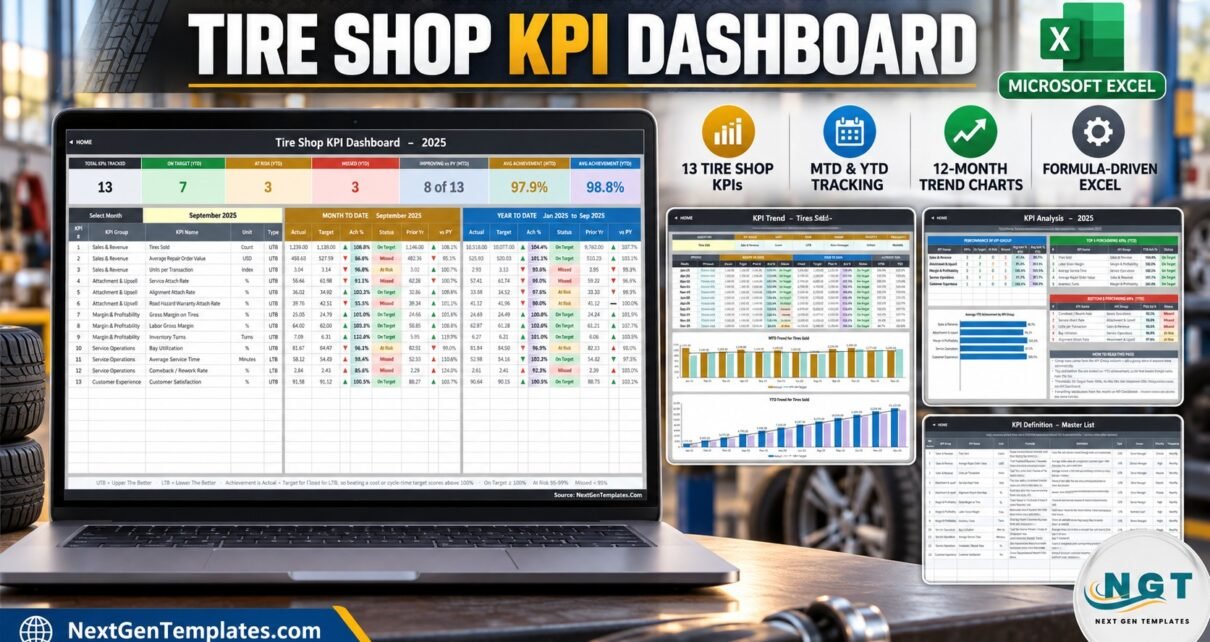
The Tire Shop KPI Dashboard in Excel puts 13 tire-shop KPIs, 5 KPI groups and 11 worksheets behind a single month dropdown. Pick a month in one cell and seven summary cards, every MTD and YTD column, two twelve-month trend charts and a full group roll-up recalculate together. Every figure is a plain worksheet formula – VLOOKUP, MATCH, INDEX and COUNTIF – with no Power Query, no data model, no macro and no add-in, and the sheets are pre-wired for 22 KPI rows so nine more KPIs need no formula work at all.
Most tire and service shops already have the numbers. They sit in a point-of-sale system, a technician time report and a supplier statement, and once a month somebody stitches them into a spreadsheet that looks different from last month’s. The problem is not data collection – it is having one page that says, in the same way every month, whether tires sold beat target, whether the attach rates moved, and whether last year was better. That is exactly the gap this tire shop KPI dashboard fills.
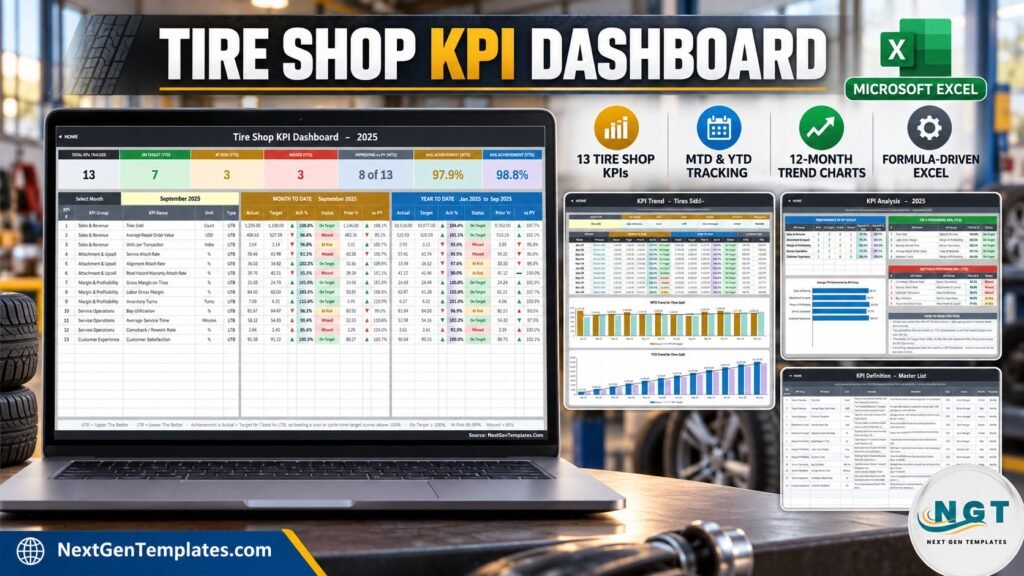
Key Features of the Tire Shop KPI Dashboard in Excel
- 13 KPIs in 5 groups. Sales & Revenue, Attachment & Upsell, Margin & Profitability, Service Operations and Customer Experience – three KPIs each except Customer Experience, which carries Customer Satisfaction on its own.
- One dropdown drives everything. Cell D6 on KPI Dashboard lists the twelve months of the reporting year. The dashboard and the KPI Analysis page both follow it; there is no refresh step.
- Direction-aware achievement. Each KPI is typed UTB (Upper The Better) or LTB (Lower The Better). Achievement is Actual divided by Target for UTB and Target divided by Actual for LTB, so beating a cycle-time or rework target scores above 100%.
- Traffic lights you can move. On Target from 100%, At Risk from 95% to 99%, Missed below 95% – thresholds sit in the formulas in columns L and U, not in conditional-formatting rules you cannot find.
- Arrow colour separated from arrow direction. The arrow shows whether the actual is above or below its comparator; its colour shows whether that direction is good for that KPI. A falling comeback rate shows a green down-arrow.
- KPI list drives the whole file. Rename a KPI on KPI Definition and the input sheets, the dashboard, the trend page and the analysis page all follow. Clear a row and the summary cards recount.
Dashboard Pages Explanation
Home
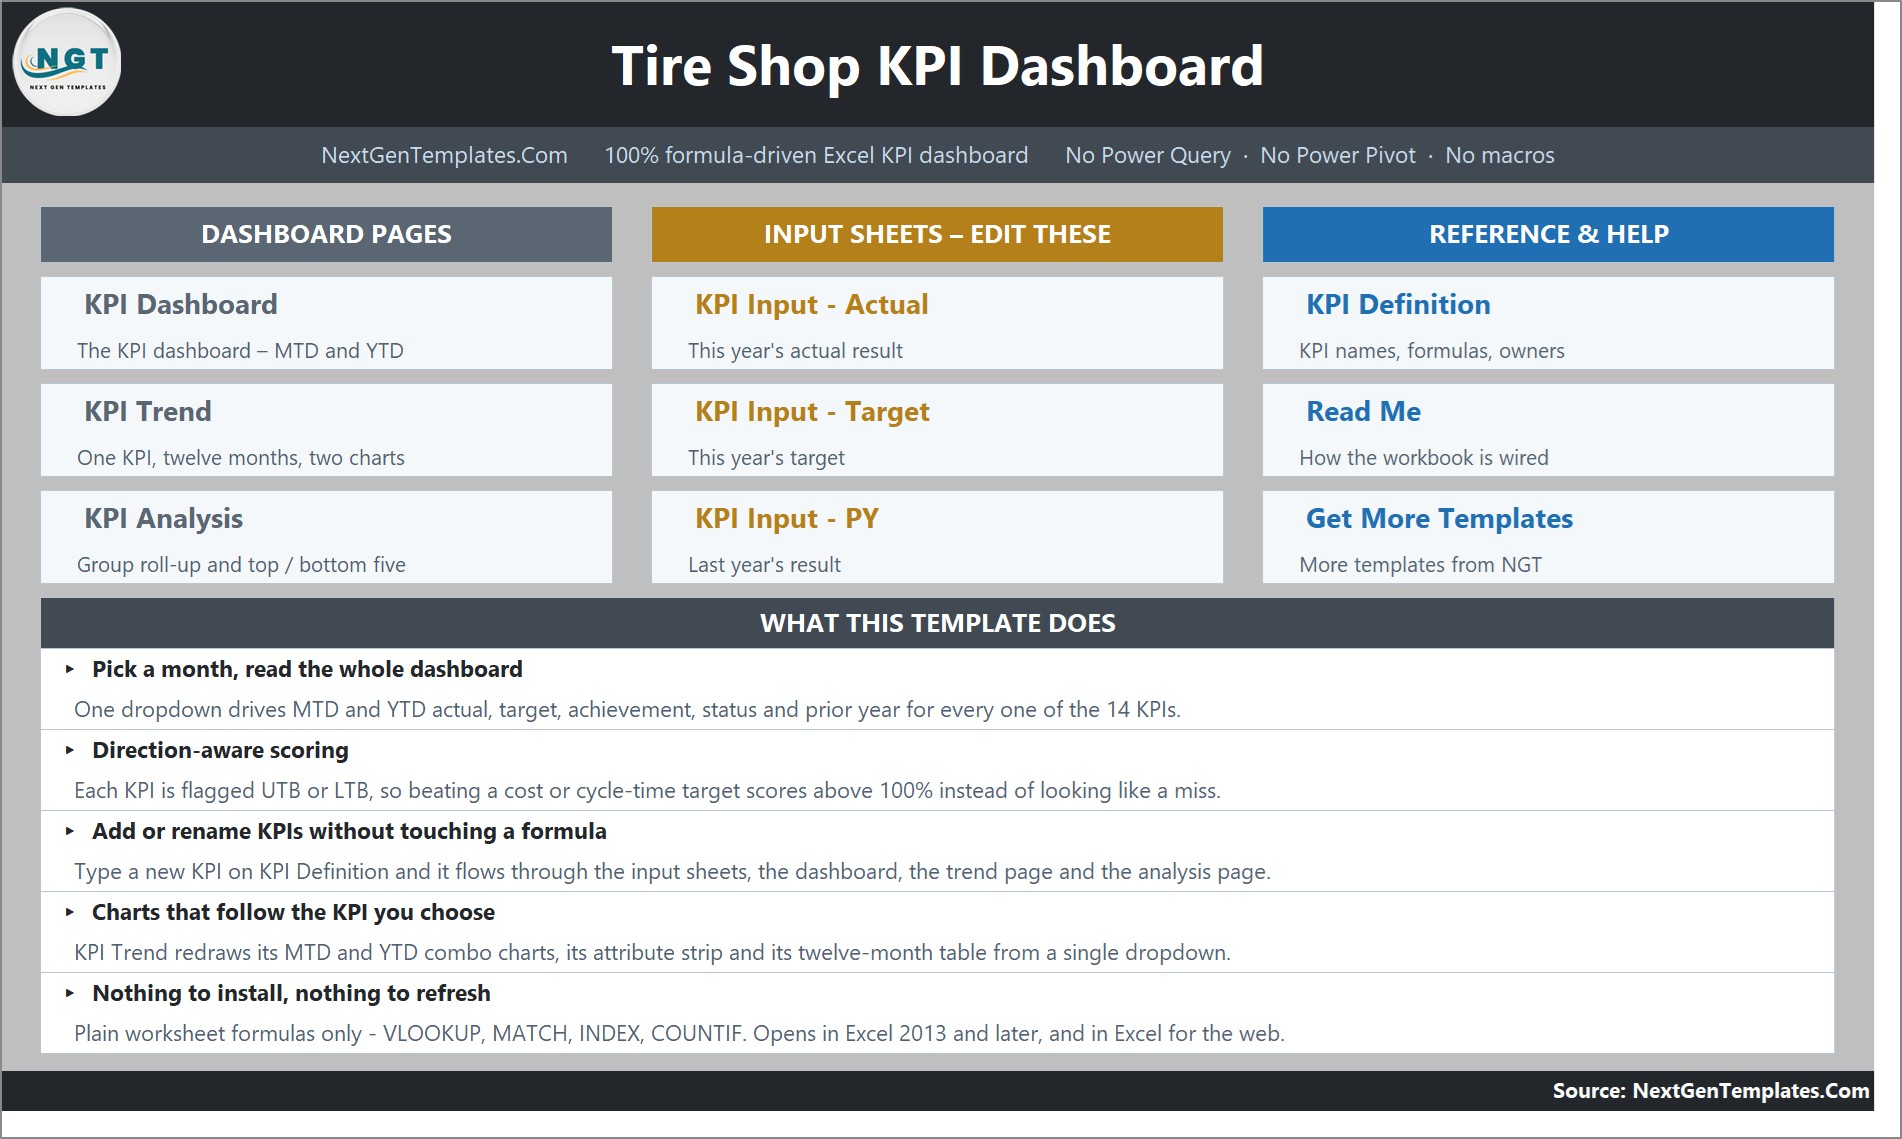
A navigation page with three panels – Dashboard Pages, Input Sheets and Reference & Help – plus a summary of what the template does: pick a month and read the whole dashboard, direction-aware scoring, add or rename KPIs without touching a formula, charts that follow the KPI you choose, and nothing to install or refresh.
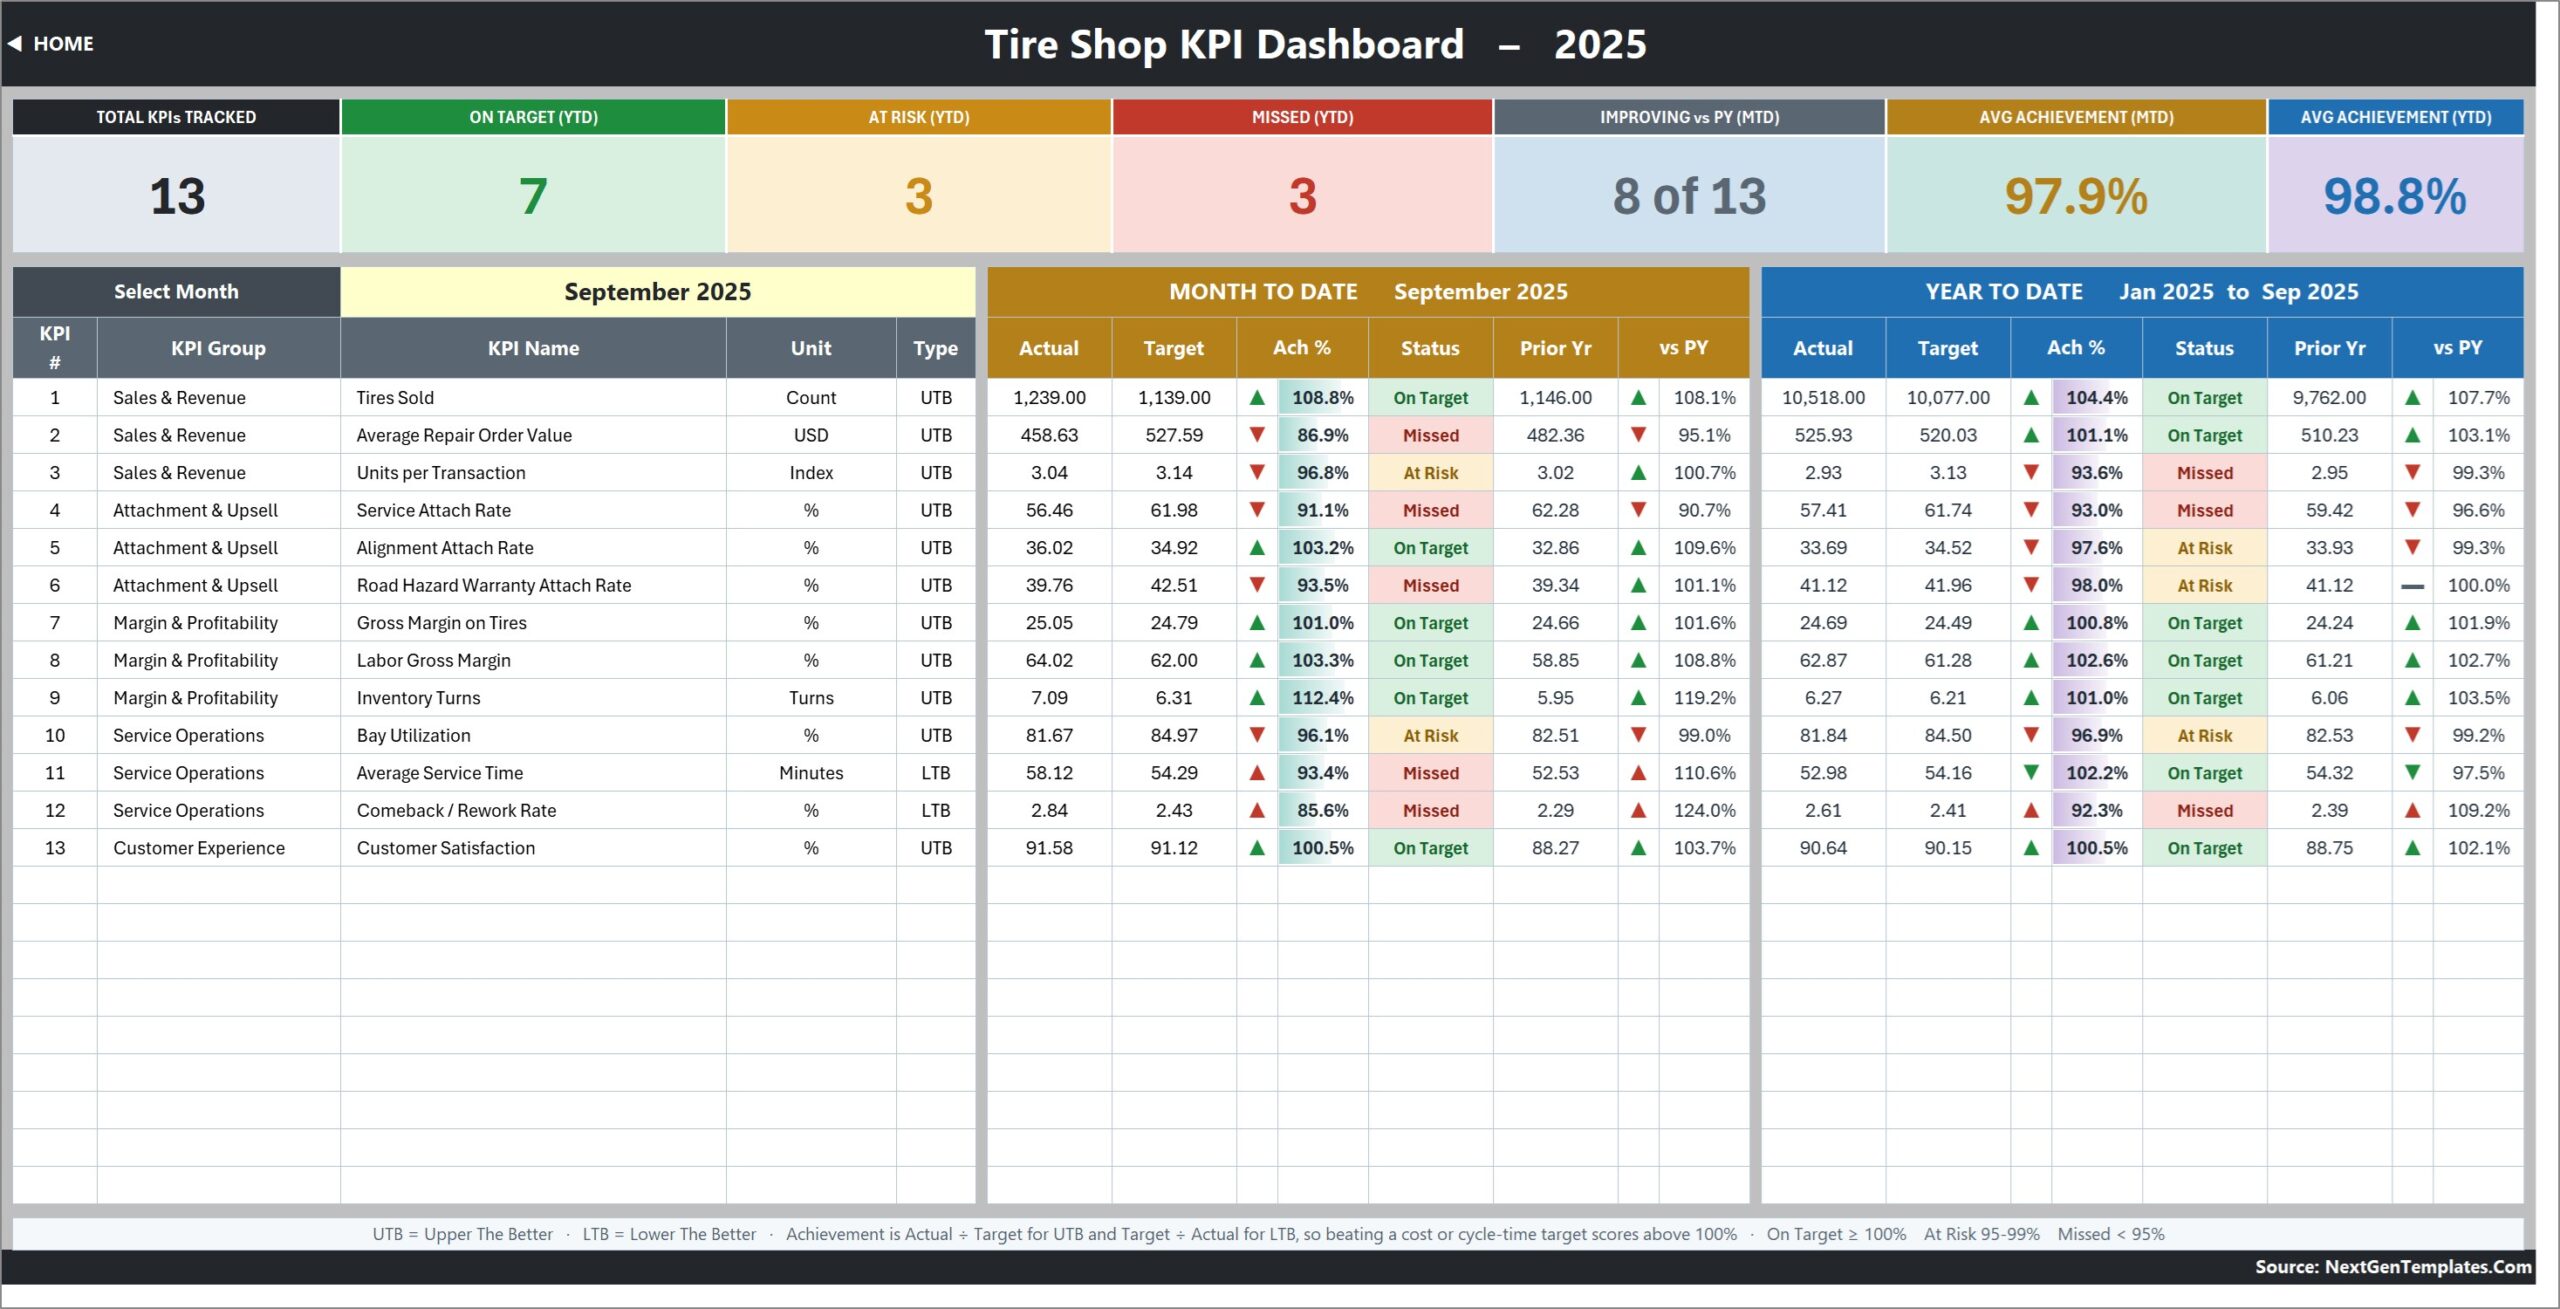
KPI Dashboard
The scorecard itself. Seven cards – Total KPIs Tracked, On Target (YTD), At Risk (YTD), Missed (YTD), Improving vs PY (MTD), Avg Achievement (MTD) and Avg Achievement (YTD) – sit above one row per KPI, each with a Month To Date and a Year To Date block carrying Actual, Target, Achievement %, Status, Prior Yr and vs PY. In the sample data, September 2025 shows 13 KPIs tracked, 7 on target, 3 at risk and 3 missed for the year to date.
KPI Trend
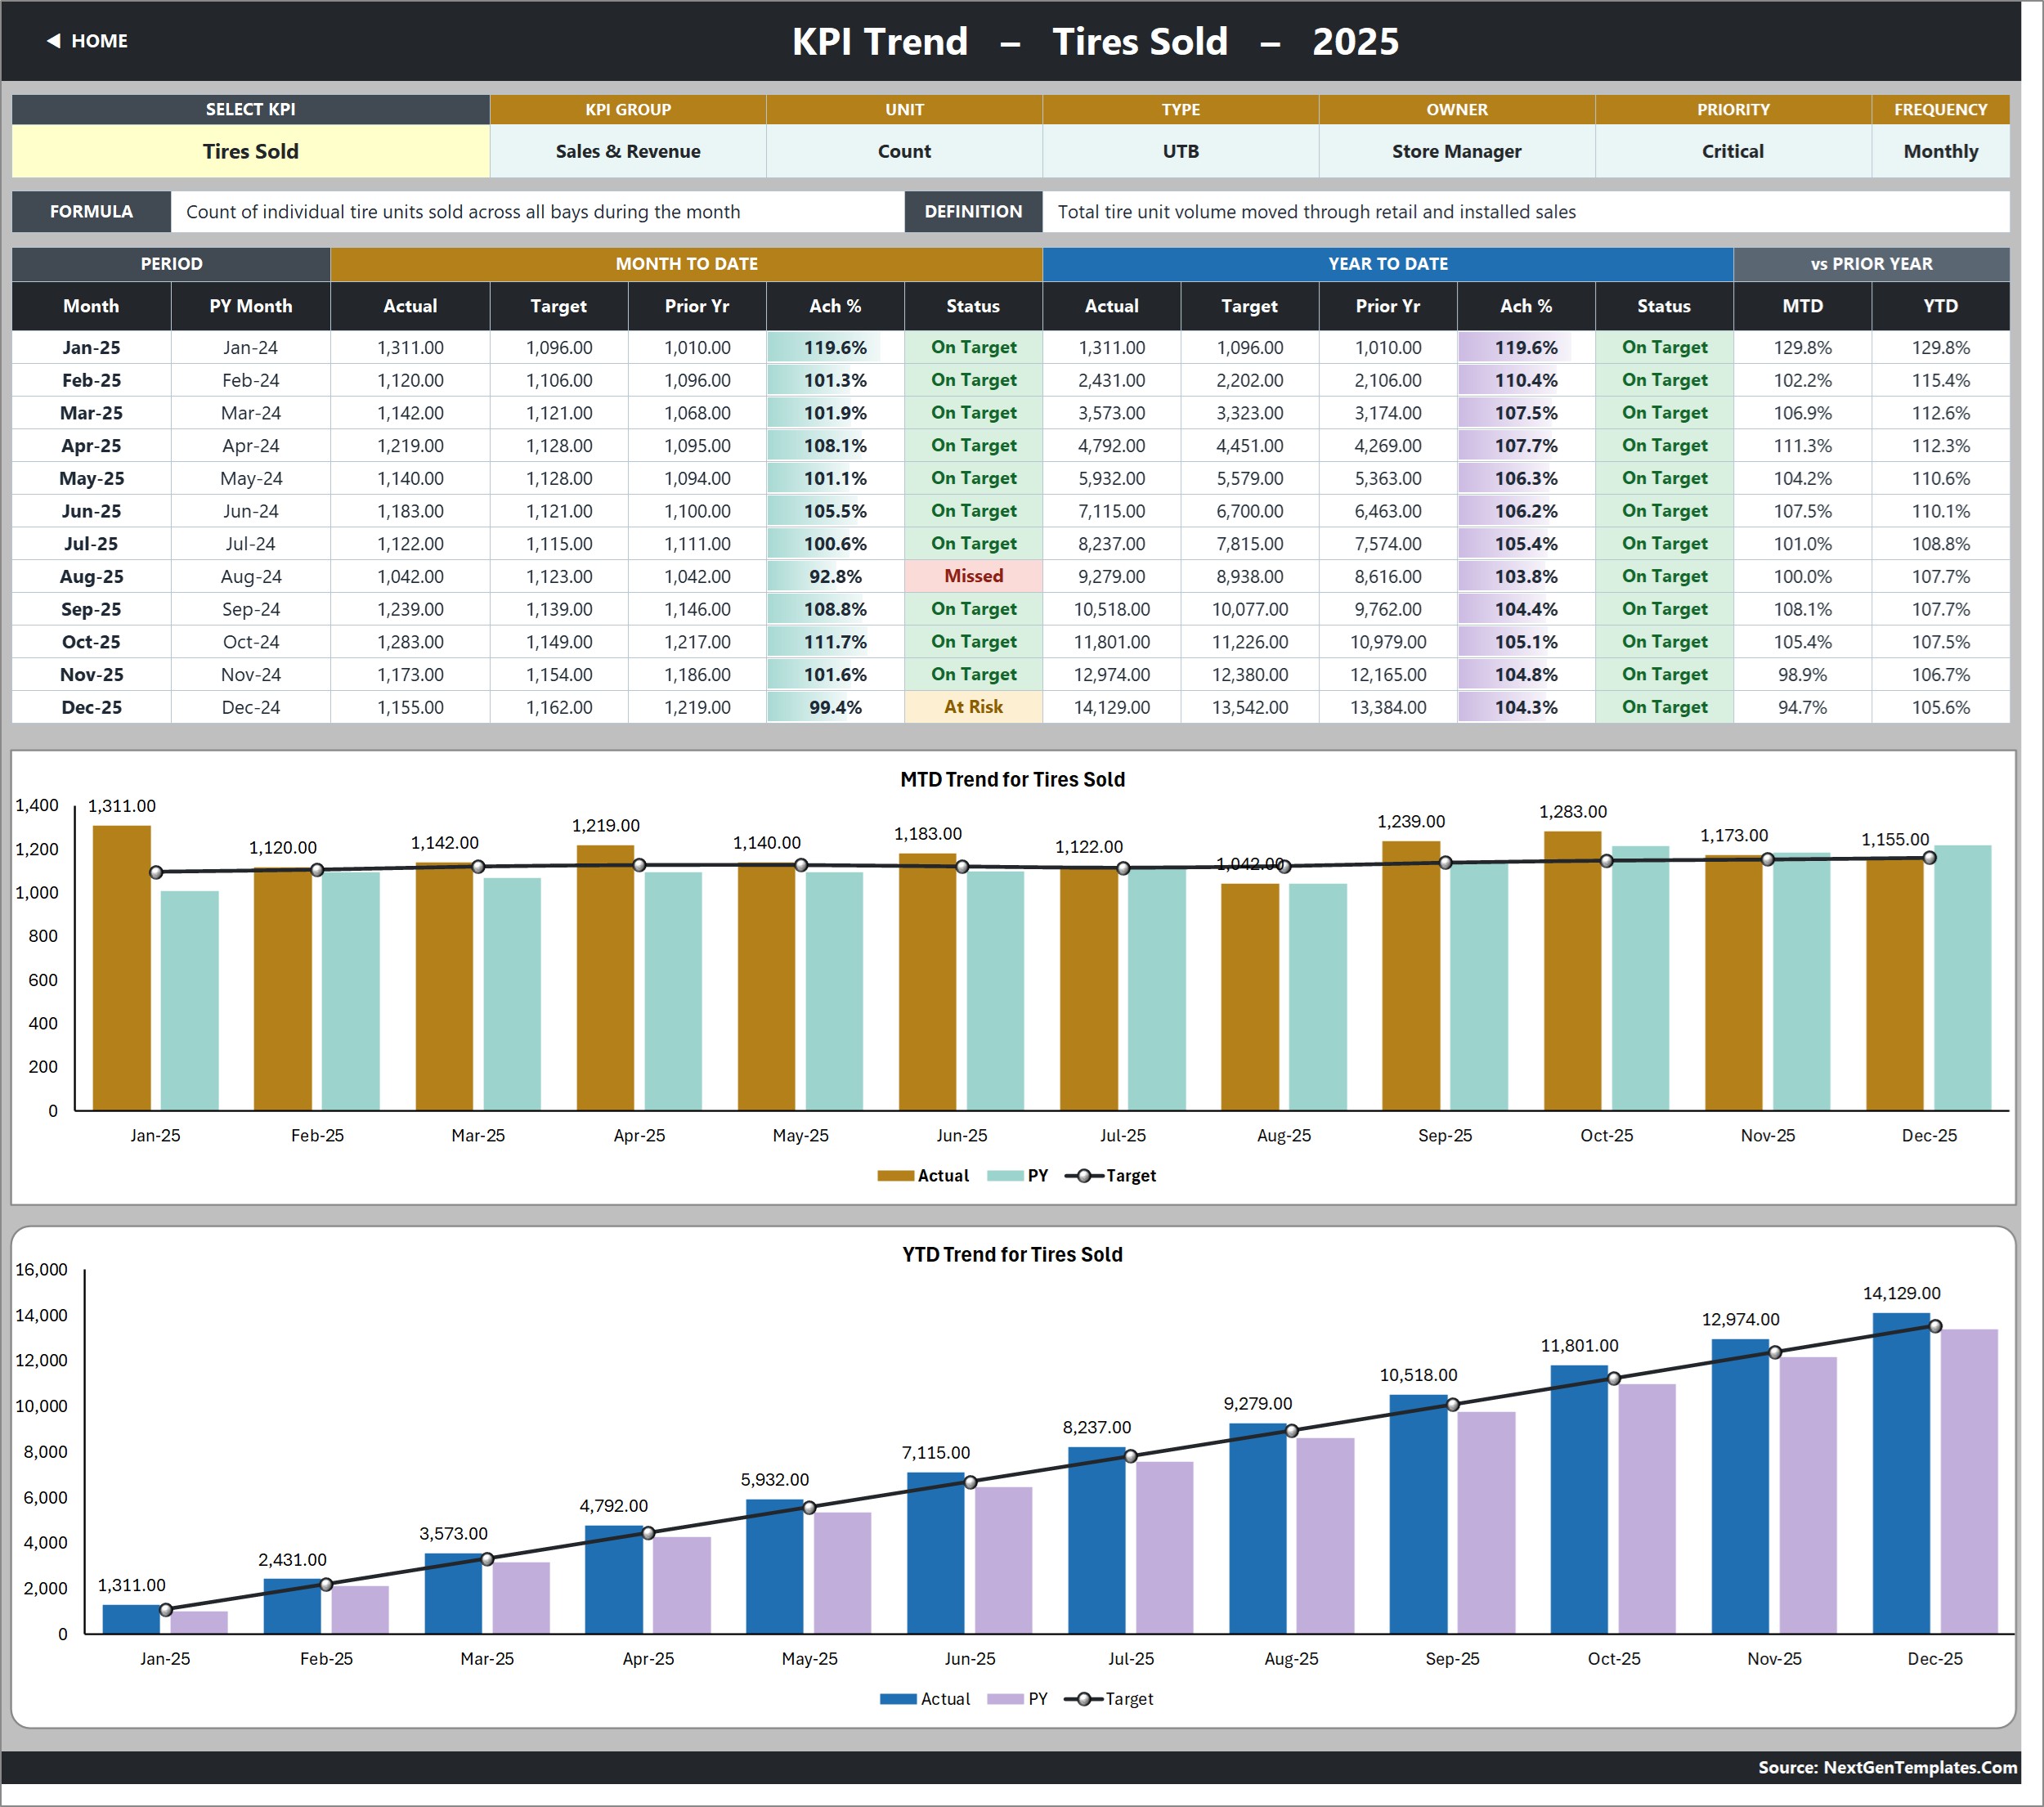
One KPI at a time, chosen in cell B4. The page opens with an attribute strip – KPI Group, Unit, Type, Owner, Priority, Frequency – then the KPI formula and definition, a twelve-month table of MTD and YTD actual, target, prior year, achievement and status, and two combo charts: MTD Trend for Tires Sold and YTD Trend for Tires Sold, each plotting actual and prior-year columns against a target line.
KPI Analysis
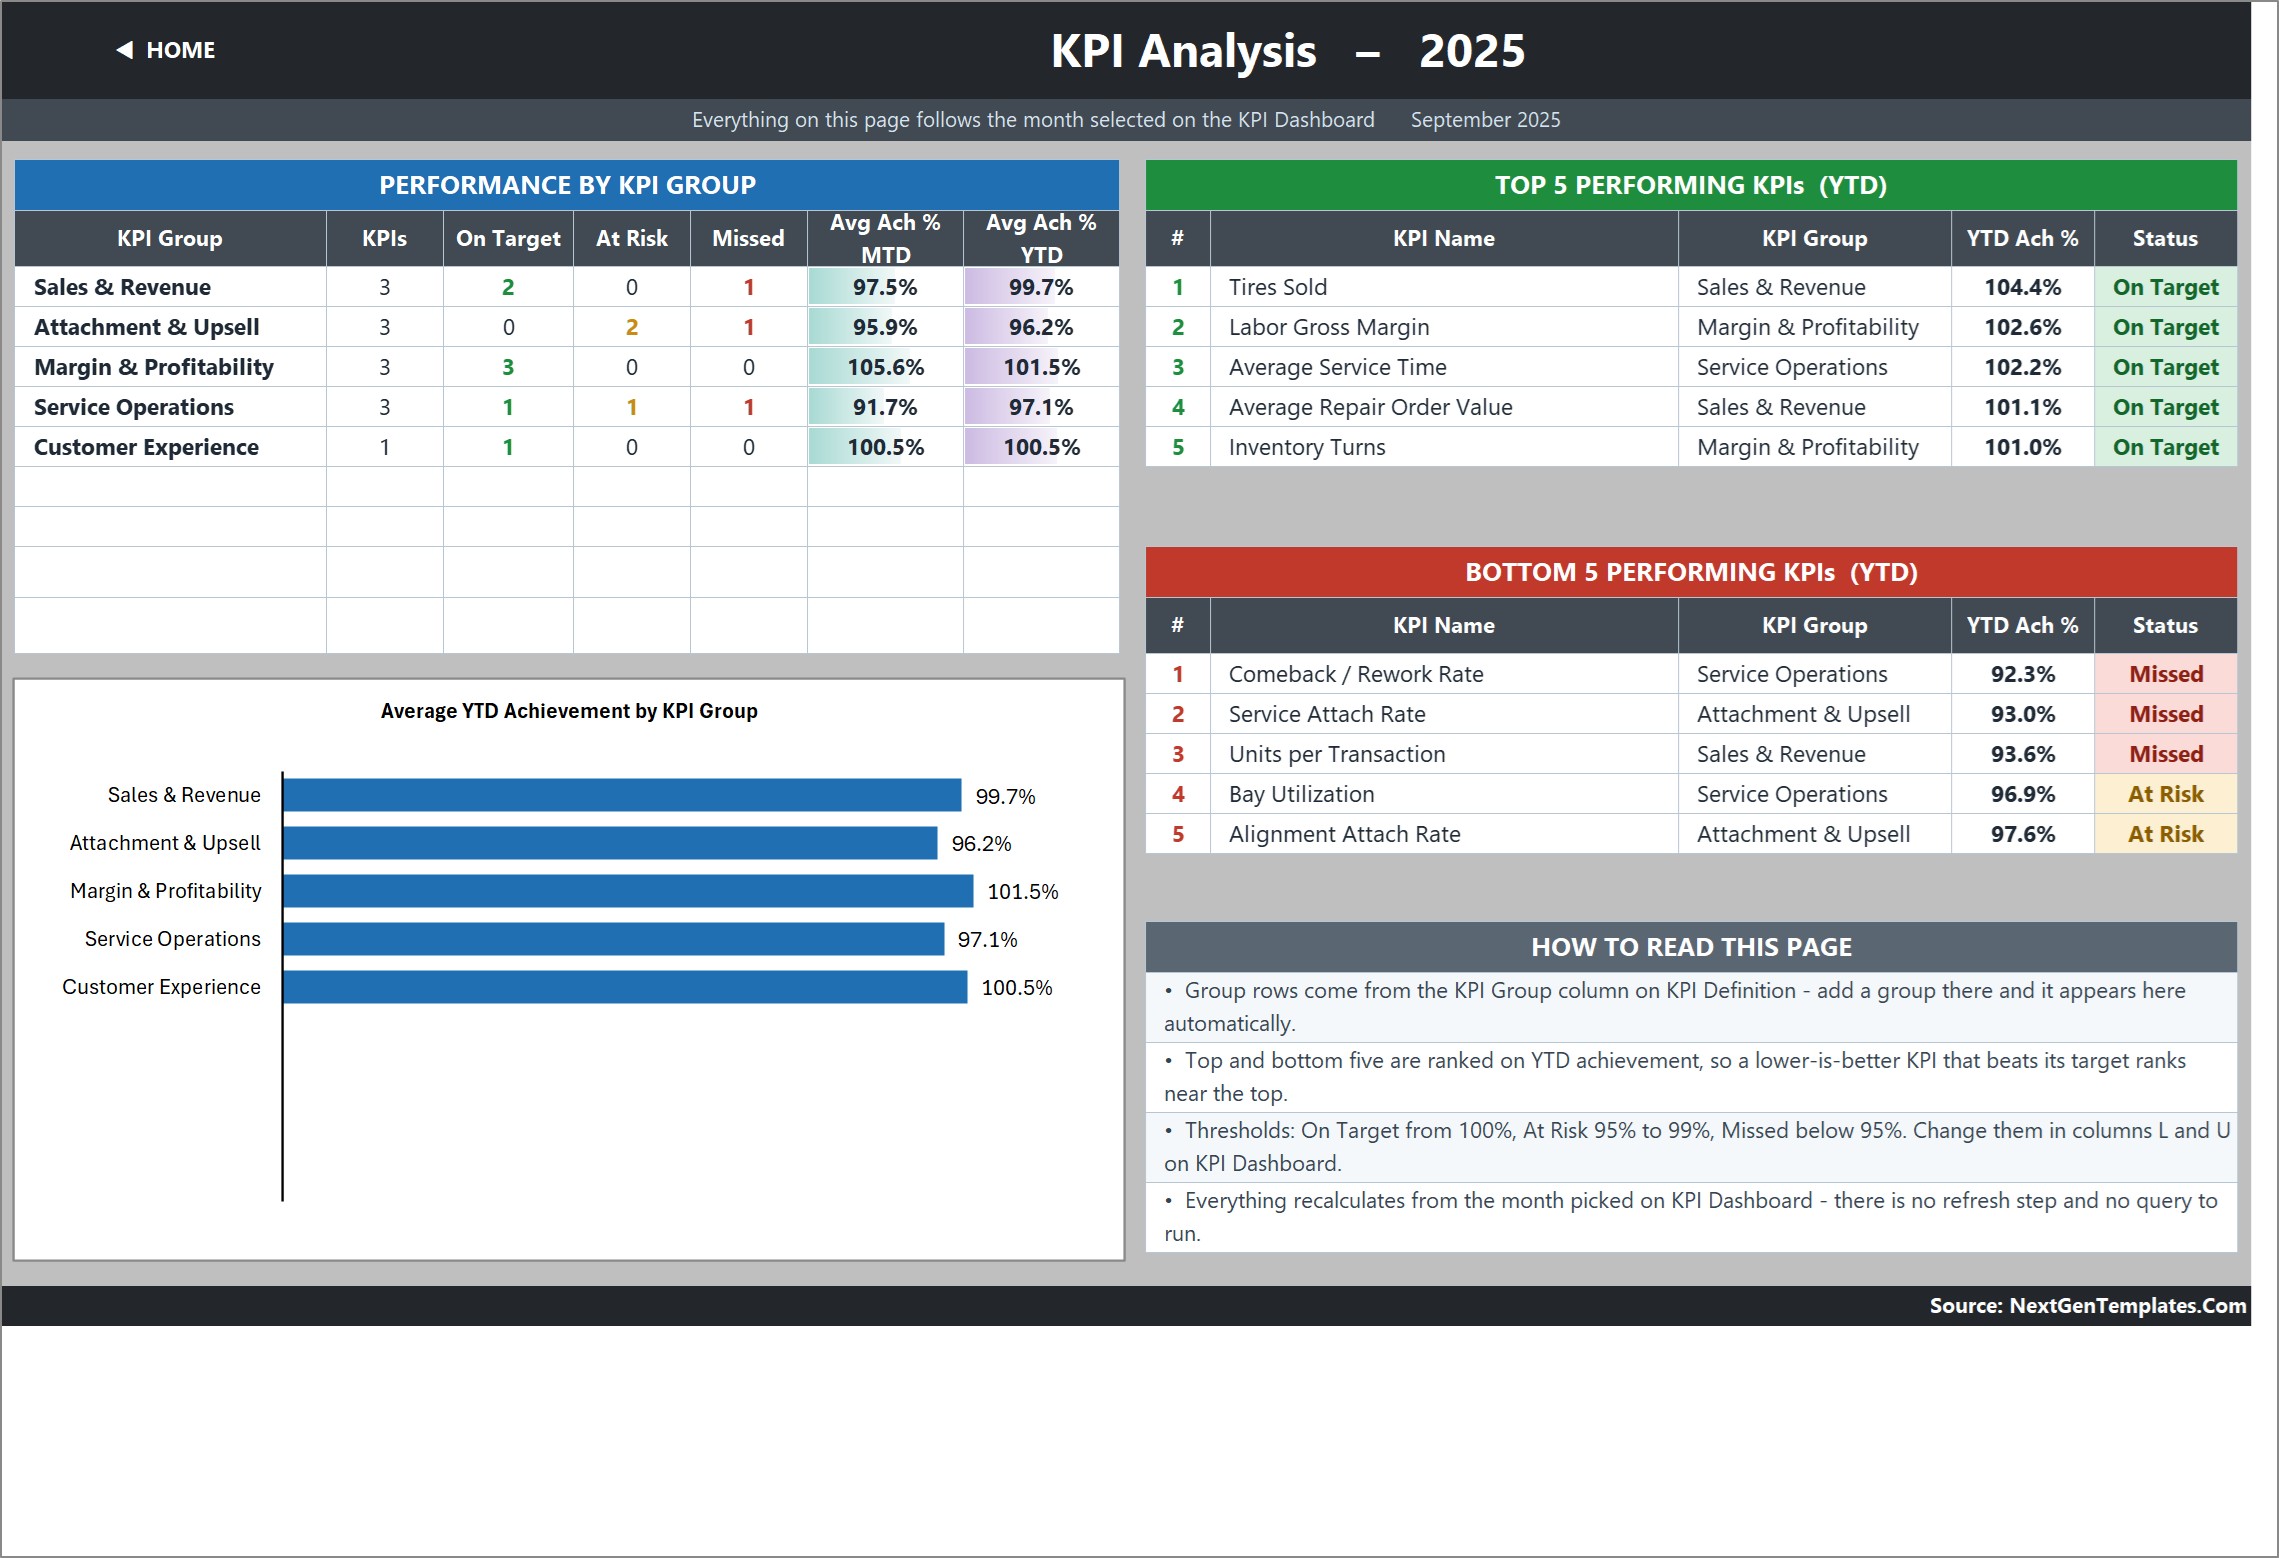
The roll-up page, which follows the same month as the dashboard. A Performance by KPI Group table counts On Target, At Risk and Missed per group alongside average MTD and YTD achievement; an Average YTD Achievement by KPI Group chart ranks the five groups; and Top 5 and Bottom 5 Performing KPIs (YTD) tables name the best and worst performers. A How To Read This Page panel explains where the groups, the ranking and the thresholds come from.
KPI Input – Actual, Target and PY
The three sheets you actually type in. Each holds an MTD and a YTD column for every month of the year, with the KPI rows driven by KPI Definition so all three always line up. Cell E3 on the Actual sheet is the first month of the reporting year – change it and the Target sheet, the Prior Year sheet, the month dropdown and every sheet title re-base. The Prior Year sheet is simply the Actual sheet shifted back twelve months.

KPI Definition
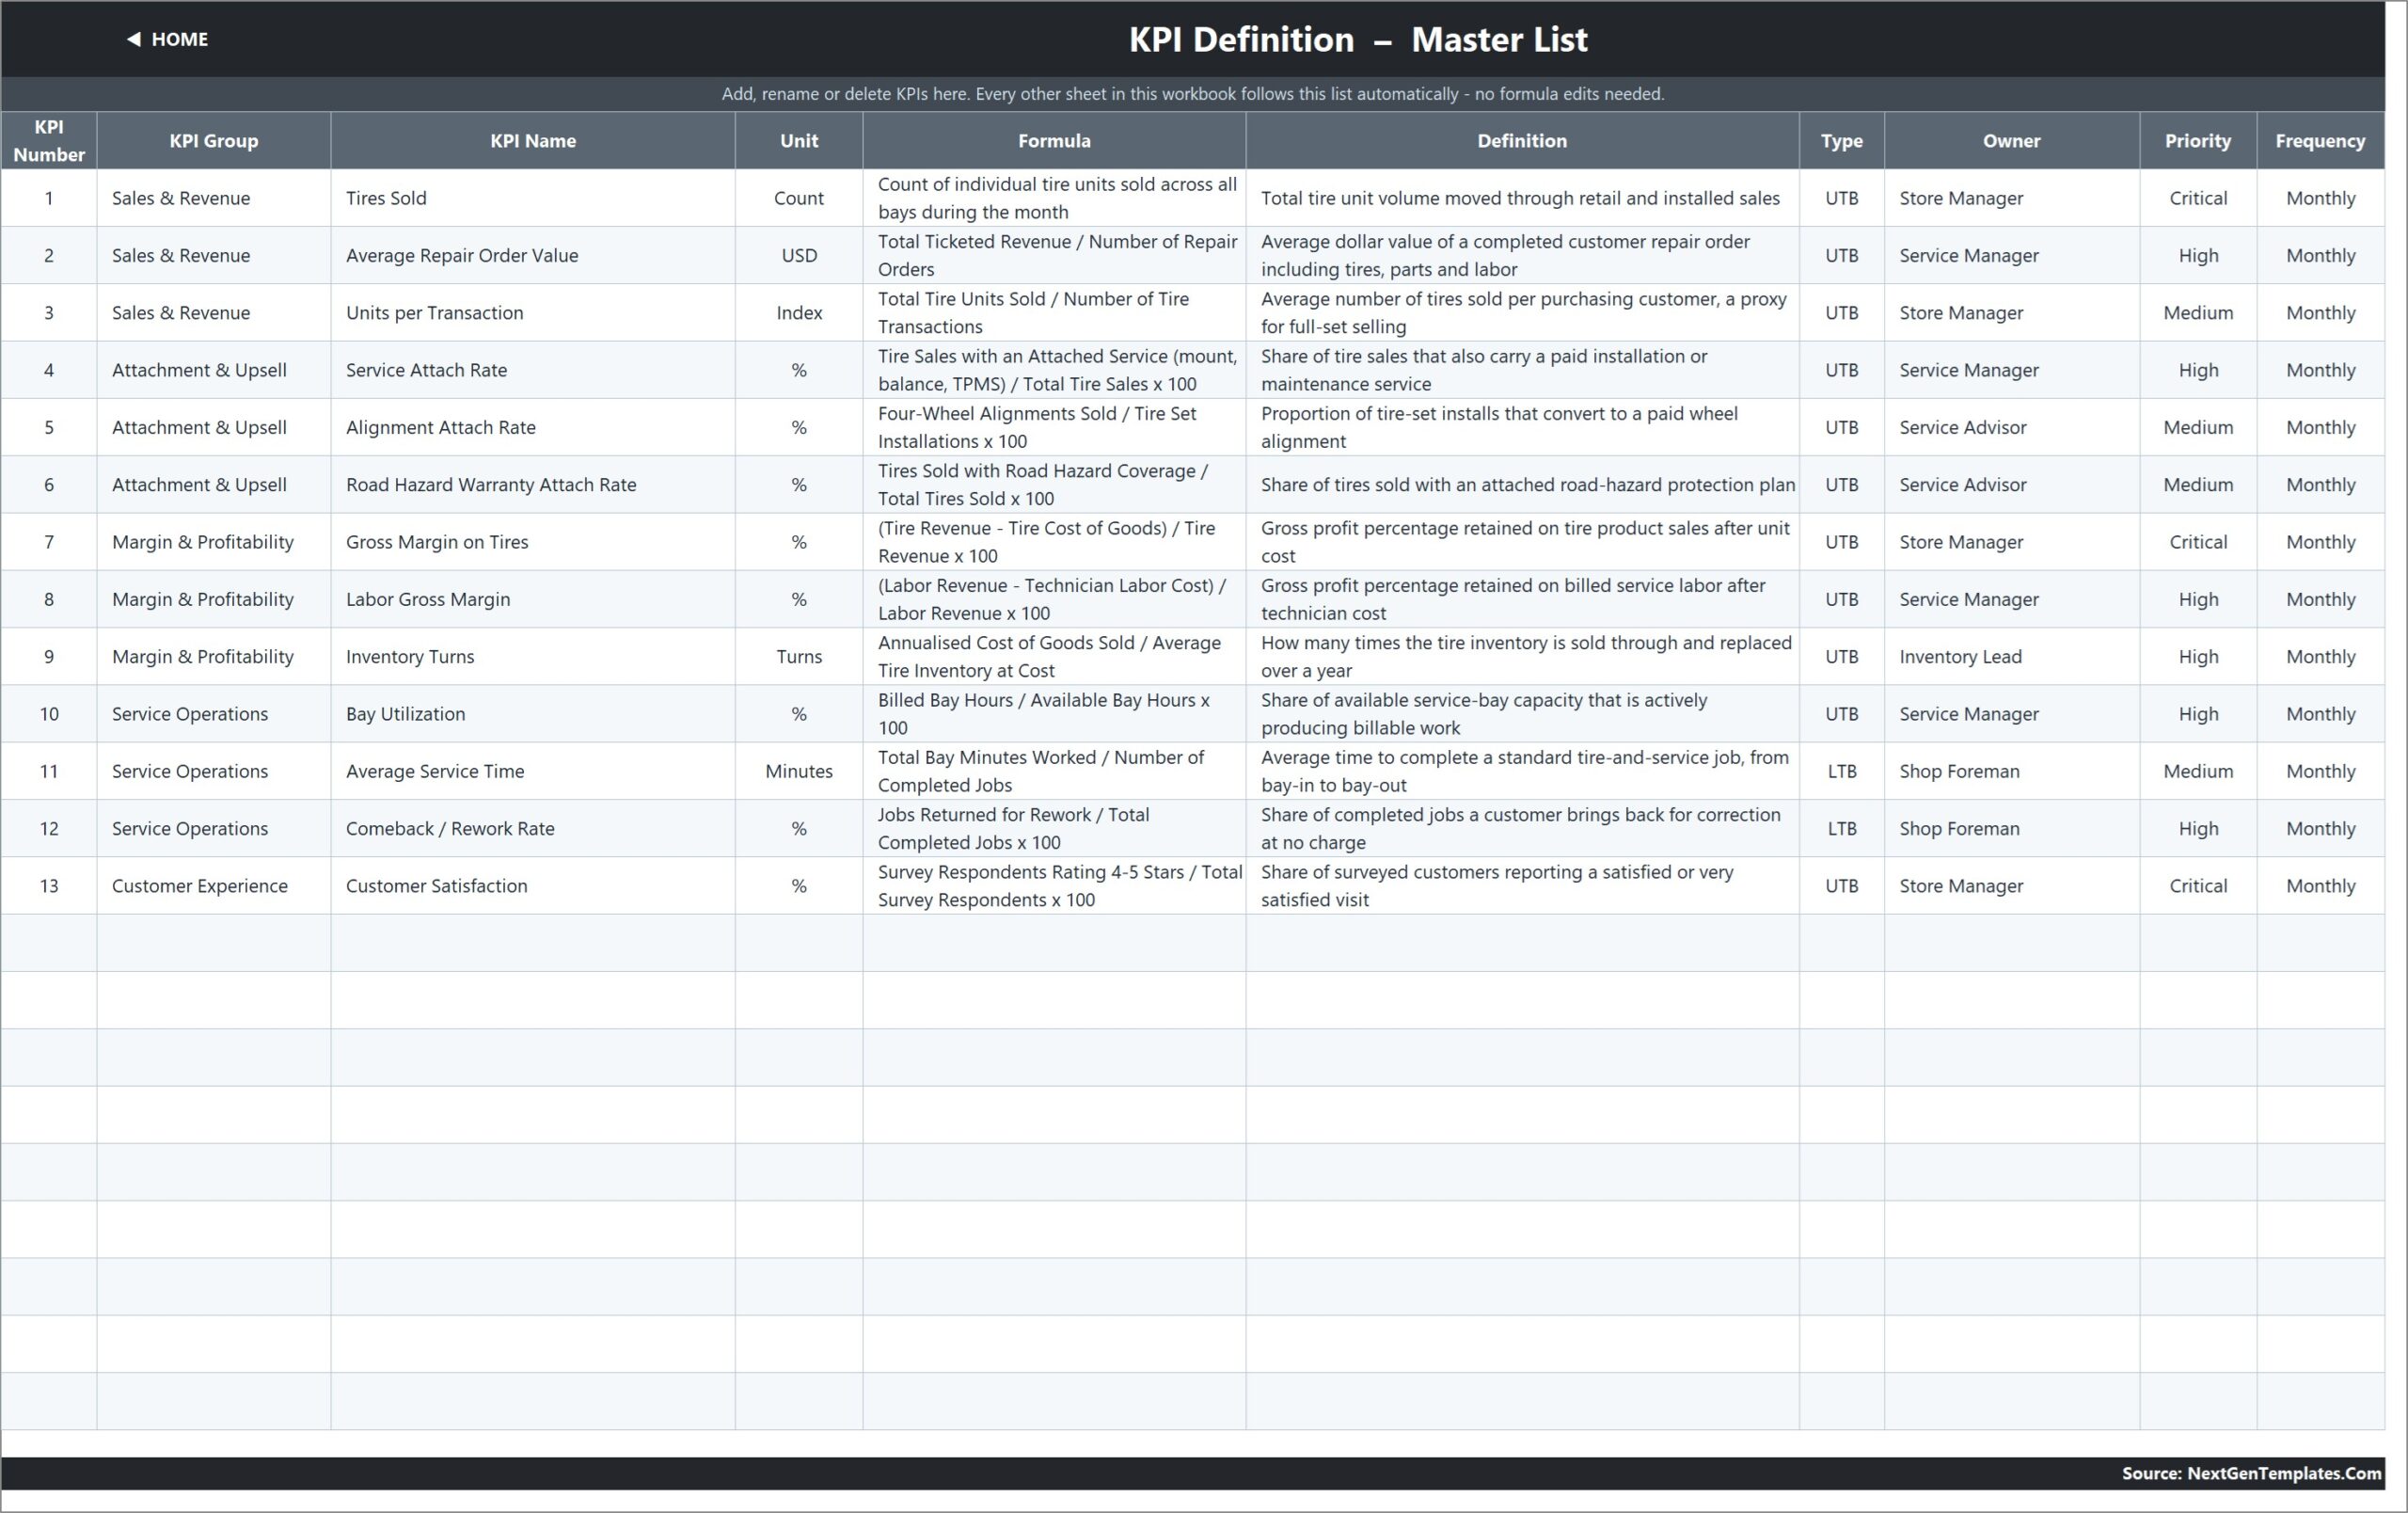
The master list: KPI Number, KPI Group, KPI Name, Unit, Formula, Definition, Type, Owner, Priority and Frequency. The sample file assigns owners across Store Manager, Service Manager, Service Advisor, Inventory Lead and Shop Foreman, and marks Tires Sold, Gross Margin on Tires and Customer Satisfaction as Critical.
Read Me, Support and Get More Templates
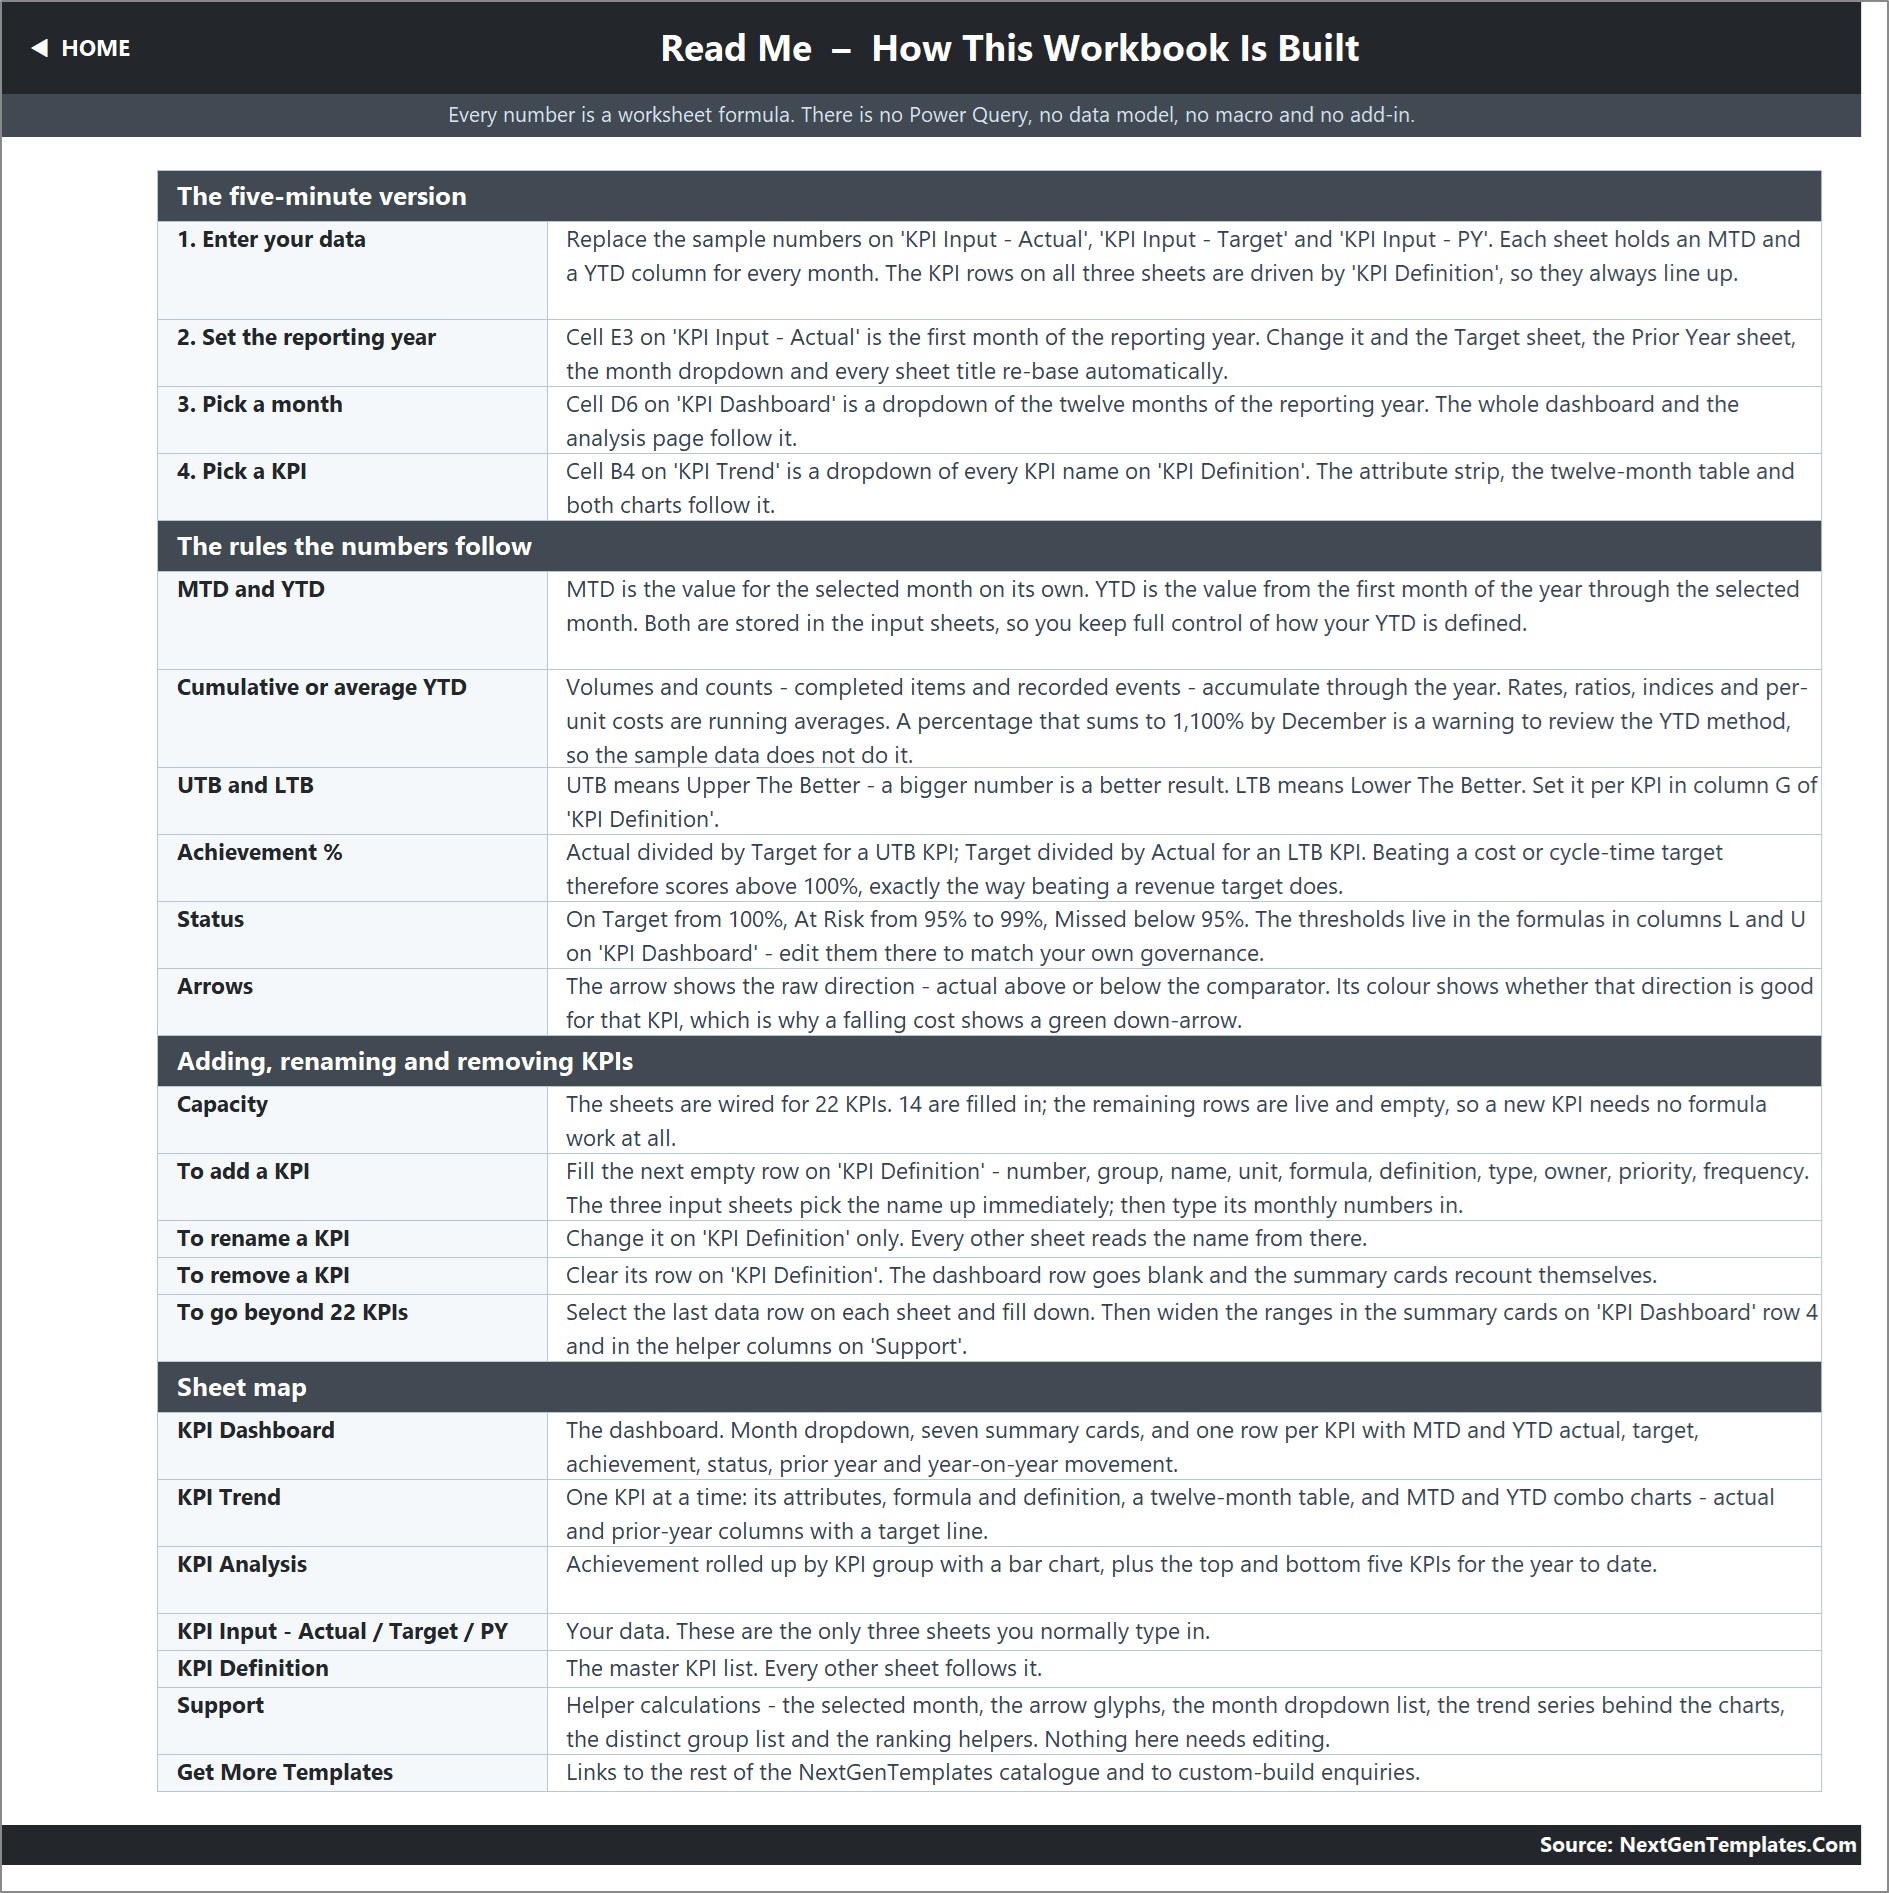
Read Me documents the five-minute setup, the rules the numbers follow, how to add or remove KPIs and a map of every sheet. Support holds the helper calculations behind the dropdown, the arrows, the chart series and the rankings – nothing there needs editing. Get More Templates links to the wider catalogue.
Tire Shop KPI Dashboard in Excel vs a Google Sheets Build vs Shop-Management SaaS
| Feature | This template | Google Sheets equivalent | Tekmetric / Shopmonkey / Mitchell 1 |
|---|---|---|---|
| Cost | One-time purchase | Free to build, days of your time | $199-$499 per shop per month |
| Platform | Excel 2013 or later, and Excel for the web | Browser only | Browser plus vendor mobile app |
| Setup time | Under 15 minutes | Hours to days | Days, with vendor onboarding |
| Macros or add-ins required | ✅ None | ✅ None | Not applicable – hosted software |
| Works offline | ✅ Yes | ❌ No | ❌ No |
| Real-time collaboration | Via OneDrive or SharePoint | ✅ Native | ✅ Native |
| Customisable KPIs and thresholds | ✅ 22 KPI rows pre-wired | ✅ If you build it | ❌ Vendor-defined reports |
| Direction-aware scoring (UTB / LTB) | ✅ Built in per KPI | ❌ You write it yourself | Varies by vendor |
| Year-1 cost for one shop | Under $20 | Your own build time | $2,400-$6,000 |
For shops that want a repeatable monthly scorecard without a four-figure annual reporting bill, this Excel KPI dashboard for tire shops sits in the sweet spot.
Who Should Use This Template
Perfect for:
- Owners and store managers of single-site or small multi-site tire and service shops reporting monthly
- Service managers and shop foremen who want attach rate, bay utilisation and comeback rate on one page
- Regional managers comparing several shops on the same KPIs and thresholds
- Anyone who already has the figures and needs a consistent tire shop performance dashboard on top of them
Not a fit if:
- You want a live feed – this workbook connects to no POS, shop-management or accounting system, and all figures are entered by hand
- You need tire size, fitment or pricing lookups – there is no distributor catalogue and no ordering feed in the file
- You track daily or per-ticket, rather than monthly
- You need row-level audit trails, per-user permissions or SSO
Real-World Use Cases
Marcus, four-bay independent shop. First Monday of the month, he fills the three input sheets, picks the month, and prints the dashboard for the team meeting. Seeing Service Attach Rate missing target for three consecutive months while Gross Margin on Tires stayed above 100% told him the issue was the counter conversation, not his pricing.
Priya, operations lead for six sites. One copy per site, the same 13 KPIs, the same thresholds. Comparing KPI Analysis pages side by side turns “that shop feels busy” into Bay Utilization at 96.9% of target versus 104% next door.
Dev, shop foreman. He only ever opens KPI Trend. One dropdown, one KPI, twelve months – enough to watch Average Service Time and Comeback / Rework Rate, the two lower-is-better KPIs he is judged on.
Advantages of the Tire Shop KPI Dashboard in Excel
The biggest practical advantage is that nothing is hidden. There is no data model to inspect, no query to refresh and no macro-security prompt; if a number looks wrong you can click the cell and read the formula. That matters when a shop owner has to defend a figure in a franchise review.
The second is cost and time. A month-end reporting routine that previously took two hours of copy-paste becomes typing thirteen actuals, thirteen targets and thirteen prior-year values into a layout that never changes. Because the thresholds sit in ordinary formulas, you can align them to a franchise standard once and leave them alone.
The third is portability. It opens in Excel 2013 and later and in Excel for the web, so a shop on an old desktop licence and a regional manager on a browser see the same file.
Opportunities for Improvement
Being honest about the limits: the file is monthly by design, so a shop wanting daily bay throughput will outgrow it. Data entry is manual – there is no connector to a POS or shop-management platform, and the sample data is fictional. Collaboration depends on OneDrive or SharePoint rather than being native. And while the sheets are pre-wired for 22 KPIs, going past 22 needs one fill-down and a widening of the summary-card ranges, which is documented on the Read Me sheet but is still a manual step. One small thing to be aware of: the Home and Read Me sheets describe the file as carrying 14 KPIs, while the workbook as shipped has 13 filled in and the rest live and empty.
Best Practices
- Set cell E3 on KPI Input – Actual before you paste anything – it re-bases every other sheet and every title.
- Decide per KPI whether YTD is cumulative or an average. Volumes accumulate; rates and indices should be running averages, which is how the sample data behaves.
- Set the Type column honestly. A cost or cycle-time KPI marked UTB will read as a failure every time it improves.
- Agree your On Target / At Risk / Missed bands once, edit them in columns L and U, and keep them identical across every shop you compare.
- Keep one workbook per site and one per year. Copy the file, change E3, and last year’s numbers become the Prior Year sheet.
- Use the Bottom 5 Performing KPIs (YTD) table as the meeting agenda, not the Top 5.
Explore Relevant Templates
- Tyre Shop Stock Data Entry System in Excel – the stock-side companion, and we covered it in detail in our Tyre Shop Stock Data Entry System post.
- Auto Repair Dashboard in Excel – an analytics-style dashboard for a general repair shop.
- Car Dealership Dashboard in Excel – the dealership equivalent.
- Same KPI-dashboard engine, other trades: see our write-ups of the Garage Door Service KPI Dashboard in Excel, the Elevator Maintenance KPI Dashboard in Excel and the Tree Care Services KPI Dashboard in Excel.
A Tire Shop KPI Scorecard in Excel is being prepared from our separate KPI Scorecard line. It is a different build with a different page set – not a second copy of this workbook – so this remains the KPI Dashboard edition.
Frequently Asked Questions
What KPIs does the Tire Shop KPI Dashboard in Excel track?
Thirteen: Tires Sold, Average Repair Order Value, Units per Transaction, Service Attach Rate, Alignment Attach Rate, Road Hazard Warranty Attach Rate, Gross Margin on Tires, Labor Gross Margin, Inventory Turns, Bay Utilization, Average Service Time, Comeback / Rework Rate and Customer Satisfaction, grouped into five KPI groups.
Does the workbook connect to a POS or shop-management system?
No. This tire shop KPI tracking template ships with fictional sample data and has no connector to any tire-shop, POS or accounting platform. You type the monthly actual, target and prior-year figures onto three input sheets, and nothing syncs in the background.
Can it look up tire sizes, fitment or pricing?
No. There is no distributor catalogue, fitment guide or ordering feed anywhere in the file. It is a monthly KPI reporting workbook, not a tire catalogue or a point-of-sale system.
Do I need macros, Power Query or Power Pivot?
No. Every value is a worksheet formula built from VLOOKUP, MATCH, INDEX and COUNTIF. The file opens in Excel 2013 and later and in Excel for the web, with no add-in and no macro prompt. Microsoft documents VLOOKUP if you want to extend it.
How long does setup take?
Under 15 minutes when the numbers already exist. Rename the KPIs on KPI Definition, set the reporting-year start in cell E3, then paste actual, target and prior-year figures into the three input sheets. Everything else recalculates on its own.
How does it compare with Tekmetric or Shopmonkey?
Those platforms run tickets, parts and invoicing on a per-shop monthly subscription. This workbook does not replace them; it replaces the monthly reporting bolt-on, giving targets, prior-year comparison and traffic lights for a one-time payment using figures you already record.
Can I track more than 13 KPIs in it?
Yes. The sheets are wired for 22 KPI rows, so nine further KPIs need no formula work – fill the next empty row on KPI Definition and type the monthly numbers. Beyond 22, fill down the last data row on each sheet and widen the summary-card ranges as the Read Me sheet describes.
About the Author
Built by PK – Microsoft Certified Professional with 15+ years of Excel, Google Sheets and Power BI experience. Founder of NextGenTemplates, reaching 300K+ subscribers across YouTube channels. Every template is hand-built and tested before release.
Conclusion
If your month-end reporting is a different spreadsheet every time, the Tire Shop KPI Dashboard in Excel gives you one page that never changes shape: 13 KPIs, five groups, a month dropdown, traffic lights you control and last year sitting next to this year. It will not run your shop, and it is honest about that – no POS feed, no fitment lookup, no daily tracking – but it will make the monthly conversation a short one.
👉 Click here to purchase the Tire Shop KPI Dashboard in Excel
Instant download · One-time payment · No subscription
For more Excel walkthroughs, visit Youtube.com/@PKAnExcelExpert.
Last updated: September 2026