Most garage door companies measure the wrong thing. They count jobs. A busy month feels like a good month, right up to the point where the callbacks land, the second van spends its afternoon redoing a spring that was fitted badly the first time, and the profit that looked so healthy on the job sheet quietly disappears.
The Garage Door Service KPI Dashboard in Excel is built to stop that happening. Thirteen operating metrics, month-to-date and year-to-date on the same row, every one scored against its own target and against the same month last year. One dropdown drives the lot. No macros, no Power Query, no Power Pivot, nothing to install.
Which product line this is, and which it is not
NextGenTemplates ships three families with confusingly similar names, so it is worth being precise before anything else.
- This is the Excel KPI Dashboard line: a month-picker scorecard with seven summary cards, a dedicated KPI Trend page and a KPI Analysis page with group roll-ups and top and bottom five.
- It is not the Excel KPI Scorecard line, which is a lighter, single-page product with its own KPI set. A Garage Door Service KPI Scorecard exists separately.
- It is not the analytical Excel Dashboard range either, which is built on pivot tables, slicers and transaction-level data rather than a KPI grid.
If you own one of the others, this is a different depth of tool, not a duplicate purchase.
Key features of the Garage Door Service KPI Dashboard in Excel
- 13 KPIs across 6 groups – Quality (2), Operations (4), Financial (1), Sales (2), Customer (2) and Technician (2).
- A single month dropdown in cell D6 on the KPI Dashboard sheet, driving the cards, all thirteen rows and the whole analysis page.
- MTD and YTD side by side, each with actual, target, achievement %, status, prior year and vs-prior-year movement.
- Direction-aware scoring – 11 KPIs typed UTB, 2 typed LTB, so a falling response time reads as a win rather than a shortfall.
- Editable traffic-light bands – On Target from 100%, At Risk 95-99%, Missed below 95%, all held in two formulas in columns L and U.
- Capacity for 22 KPIs, with nine live empty rows waiting.
- A complete 2025 sample year of actual, target and prior-year numbers.
- Eleven sheets, nothing locked – ten visible plus a hidden Support sheet you can unhide and edit.
The thirteen KPIs, and why each one is there
| # | KPI | Group | Unit | Type | Why it matters to a garage door business |
|---|---|---|---|---|---|
| 1 | First-Time Fix Rate | Quality | % | UTB | The single best proxy for van stock, diagnosis quality and technician training. |
| 2 | On-Time Arrival Rate | Operations | % | UTB | Whether the promised arrival window is real or aspirational. |
| 3 | Average Response Time to Service Call | Operations | Hours | LTB | Call logged to technician on site – the number customers actually feel. |
| 4 | Same-Day Service Rate | Operations | % | UTB | Emergency capacity: a stuck door is not a next-week problem. |
| 5 | Jobs Completed | Operations | Count | UTB | Volume across installs, spring and opener repairs, service calls and tune-ups. |
| 6 | Average Job Value | Financial | USD | UTB | Whether the mix is drifting toward low-value call-outs. |
| 7 | Estimate Conversion Rate | Sales | % | UTB | How many written quotes become paid work. |
| 8 | Customer Satisfaction (CSAT) | Customer | % | UTB | Share of post-service surveys rating 4 or 5 out of 5. |
| 9 | Net Promoter Score | Customer | Index | UTB | Referral pressure in a trade that lives on word of mouth. |
| 10 | Callback / Rework Rate | Quality | % | LTB | Return visits within 30 days – the silent margin killer. |
| 11 | Technician Utilization | Technician | % | UTB | Billable field hours against total available hours. |
| 12 | Revenue per Technician | Technician | USD | UTB | The number that decides whether hiring van number four is affordable. |
| 13 | Maintenance Plan Attach Rate | Sales | % | UTB | Recurring revenue, and the cheapest defence against a quiet winter. |
Dashboard pages explanation
Home
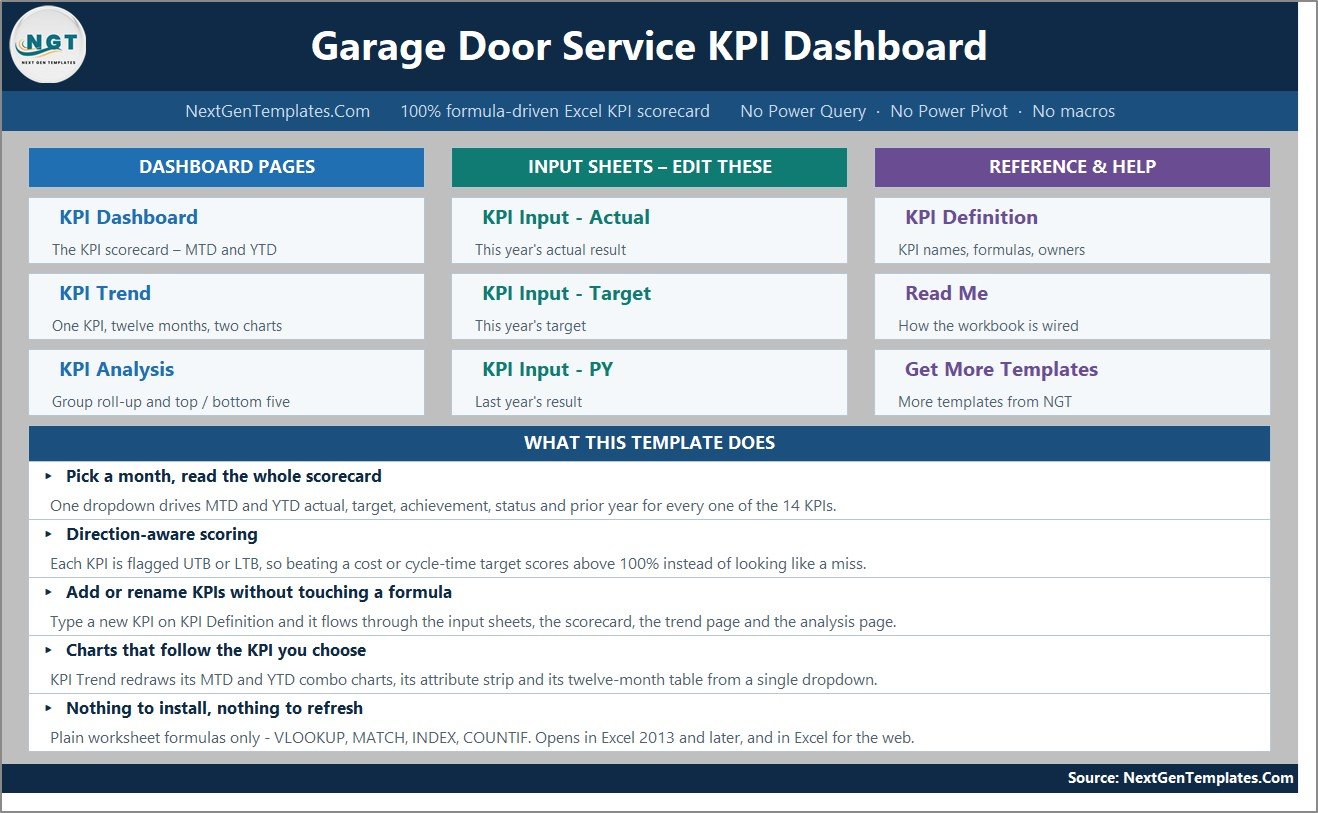
A navigation hub in three columns – Dashboard Pages, Input Sheets and Reference & Help – with a five-line summary of what the workbook does and what it deliberately avoids.
KPI Dashboard, the scorecard
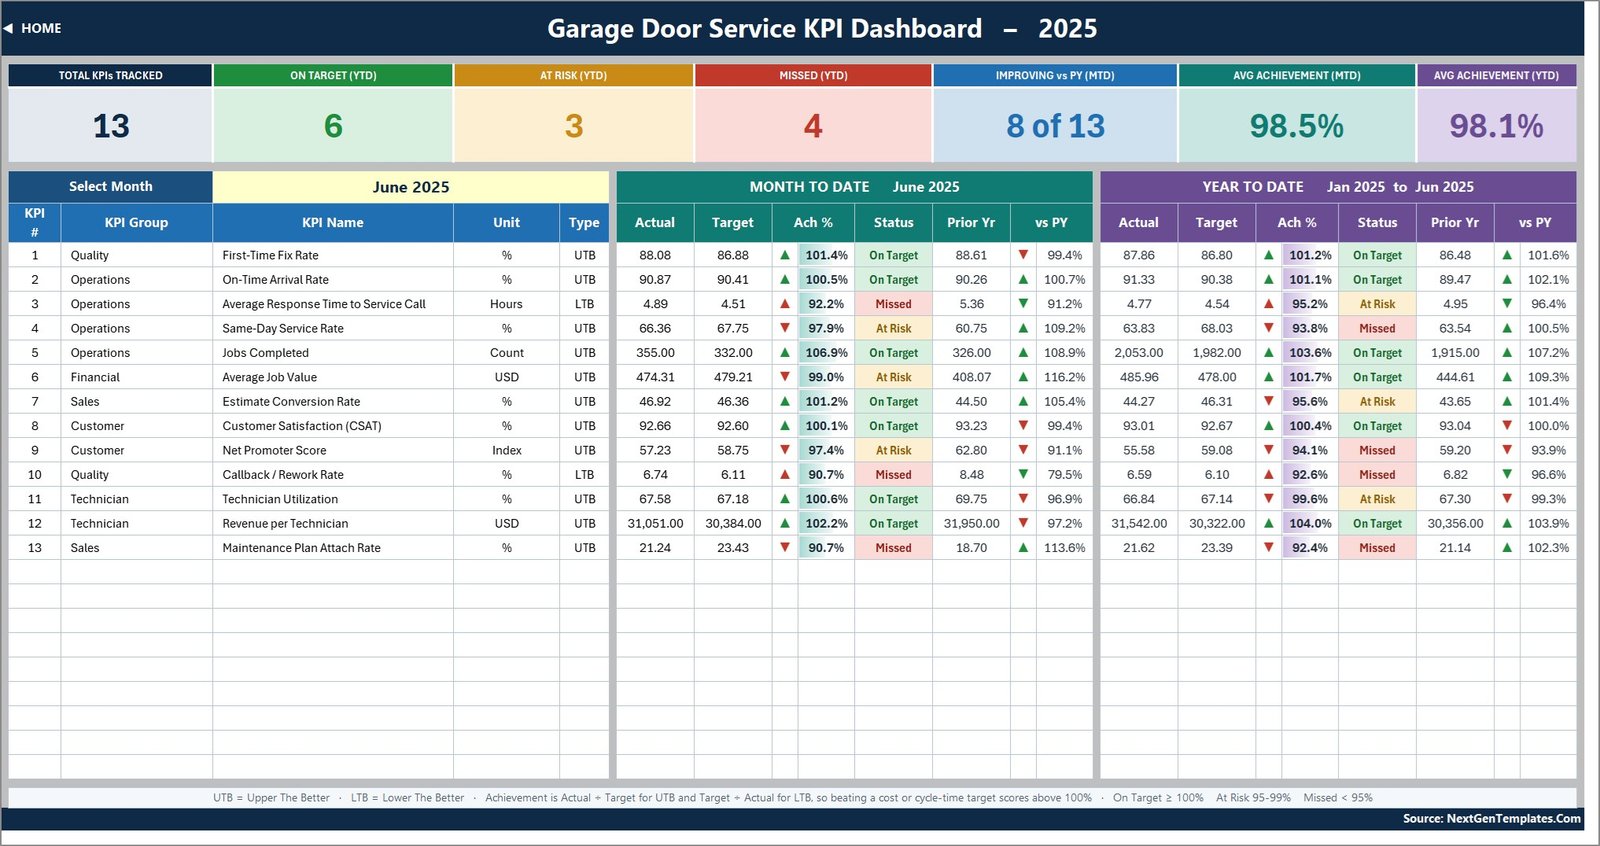
Seven summary cards run across the top. On the shipped June 2025 sample they read: Total KPIs Tracked 13, On Target (YTD) 6, At Risk (YTD) 3, Missed (YTD) 4, Improving vs PY (MTD) 8 of 13, Avg Achievement (MTD) 98.5%, Avg Achievement (YTD) 98.1%.
Underneath, one row per KPI. First-Time Fix Rate posts 88.08 against an 86.88 target for 101.4% and an On Target light; Average Response Time to Service Call comes in at 4.89 hours against 4.51 for 92.2% and a Missed light – and because that KPI is typed LTB, the workbook divides target by actual rather than the other way round, so the arithmetic is the right way up.
KPI Trend
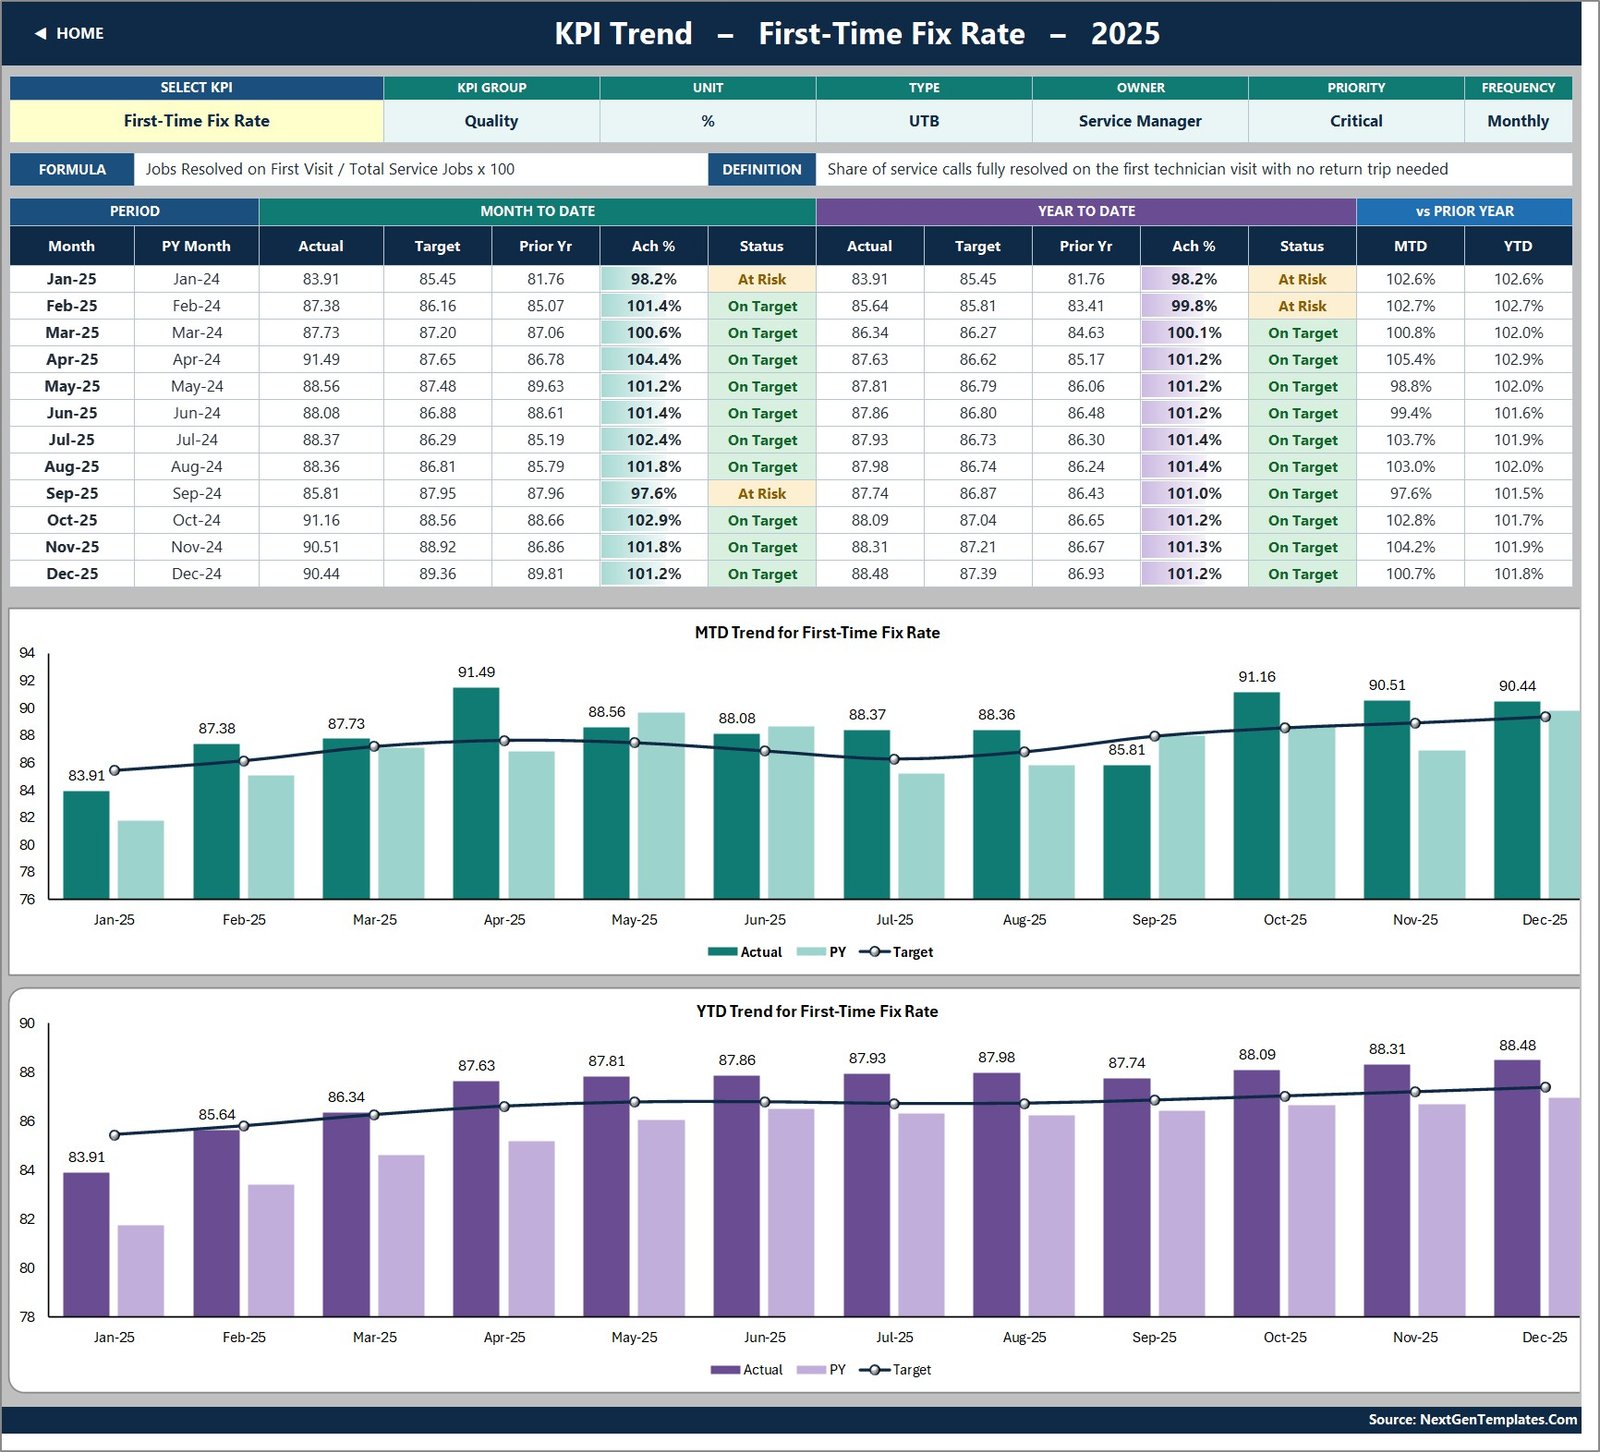
One KPI at a time, selected from a dropdown in cell B4 that reads its list straight from KPI Definition. The attribute strip repeats the KPI’s group, unit, type, owner, priority and frequency, then its formula and definition in full. Below that, a twelve-month table with MTD and YTD blocks, and two combo charts – actual and prior-year columns against a target line.
On the sample, First-Time Fix Rate climbs from 83.91% in January to 90.44% in December, dipping to 85.81% in September, which is the only month besides January that the MTD status flags as At Risk.
KPI Analysis
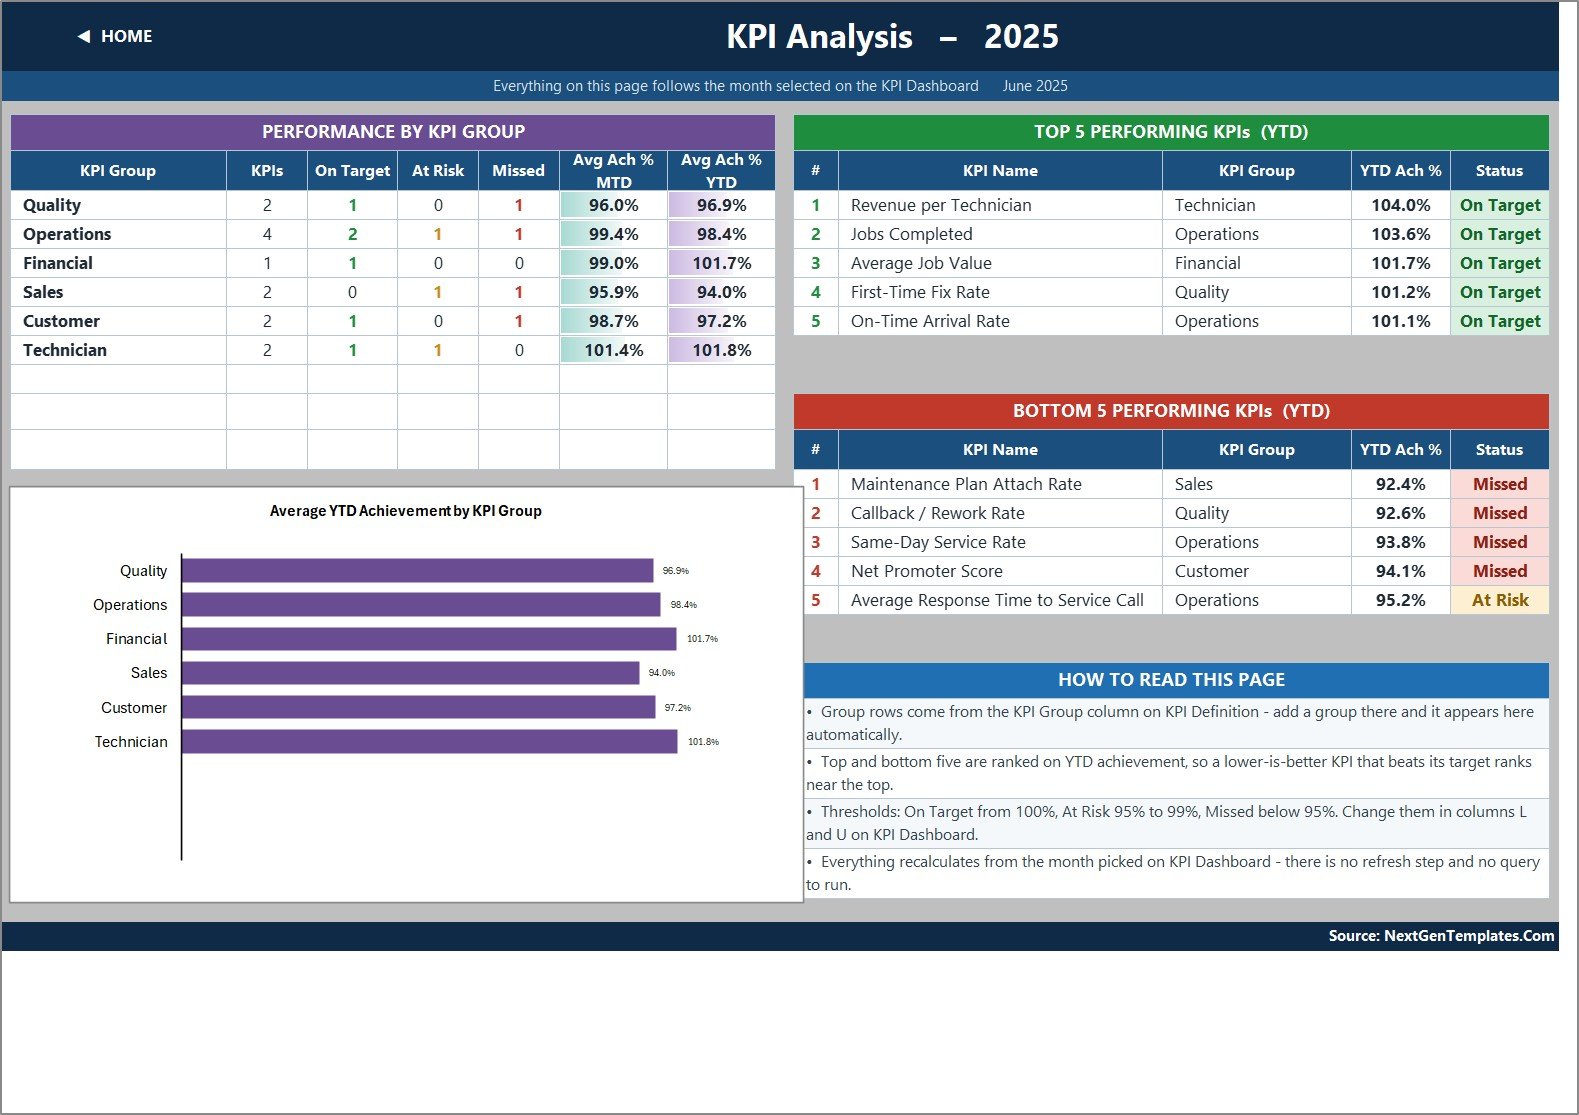
Achievement rolled up by KPI group, with a bar chart of average YTD achievement: Technician 101.8%, Financial 101.7%, Operations 98.4%, Customer 97.2%, Quality 96.9%, Sales 94.0%. Beside it, the Top 5 and Bottom 5 performers on YTD achievement.
Top five: Revenue per Technician 104.0%, Jobs Completed 103.6%, Average Job Value 101.7%, First-Time Fix Rate 101.2% and On-Time Arrival Rate 101.1% – all On Target. Bottom five: Maintenance Plan Attach Rate 92.4%, Callback / Rework Rate 92.6%, Same-Day Service Rate 93.8% and Net Promoter Score 94.1% all Missed, with Average Response Time to Service Call At Risk on 95.2%.
That is a readable story in itself: the money metrics are healthy, the customer-experience and recurring-revenue metrics are not.
KPI Input – Actual, Target and Prior Year
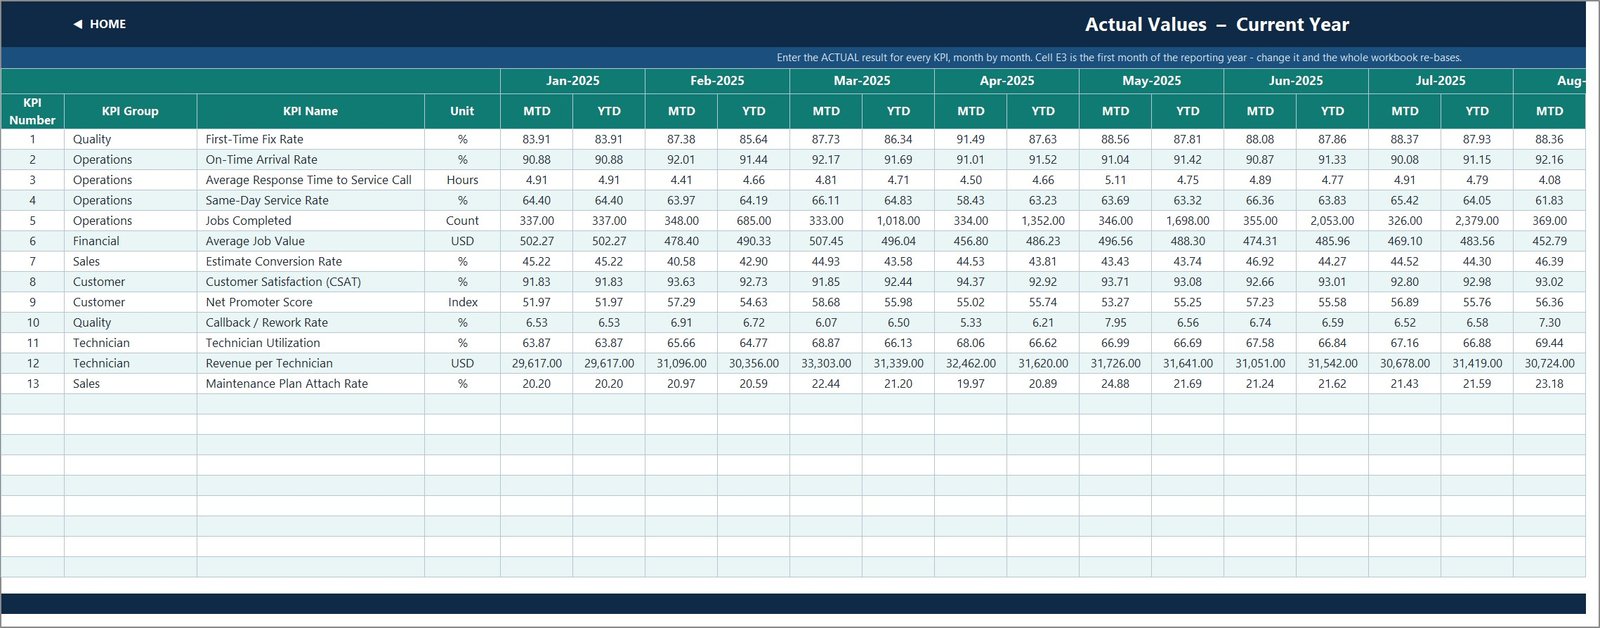
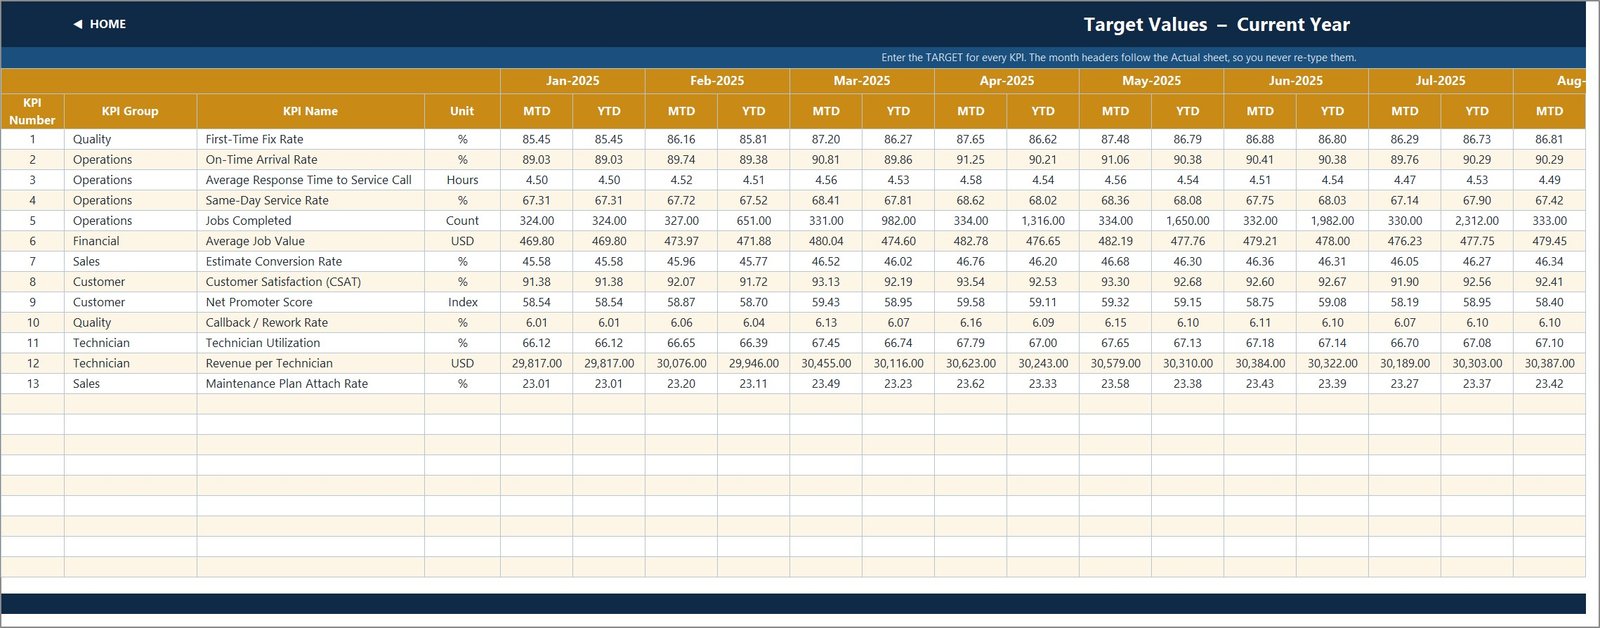
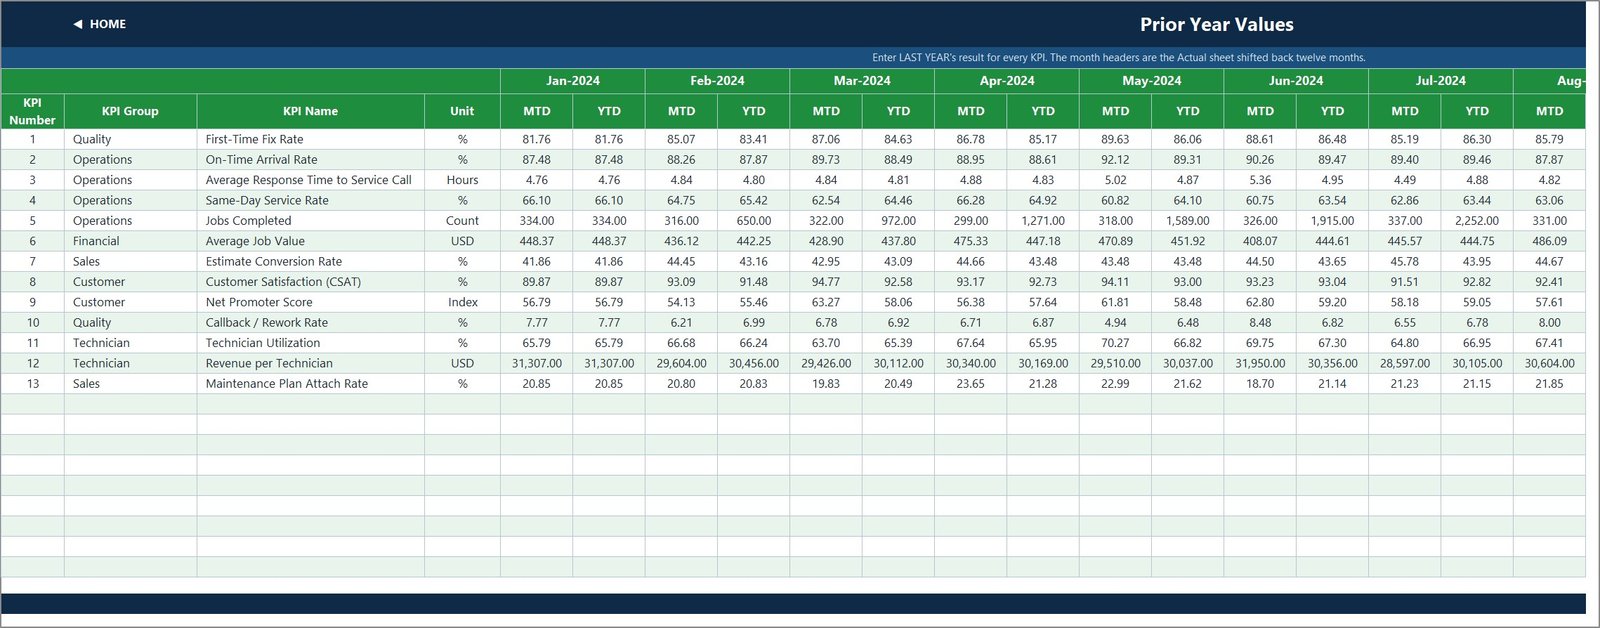
The three sheets you type in. Each has an MTD and a YTD column per month and takes its KPI rows from KPI Definition, so the three can never drift out of alignment. Cell E3 on the Actual sheet is the first month of the reporting year; change it and the Target sheet, the Prior Year sheet, the month dropdown and every sheet title re-base together.
KPI Definition
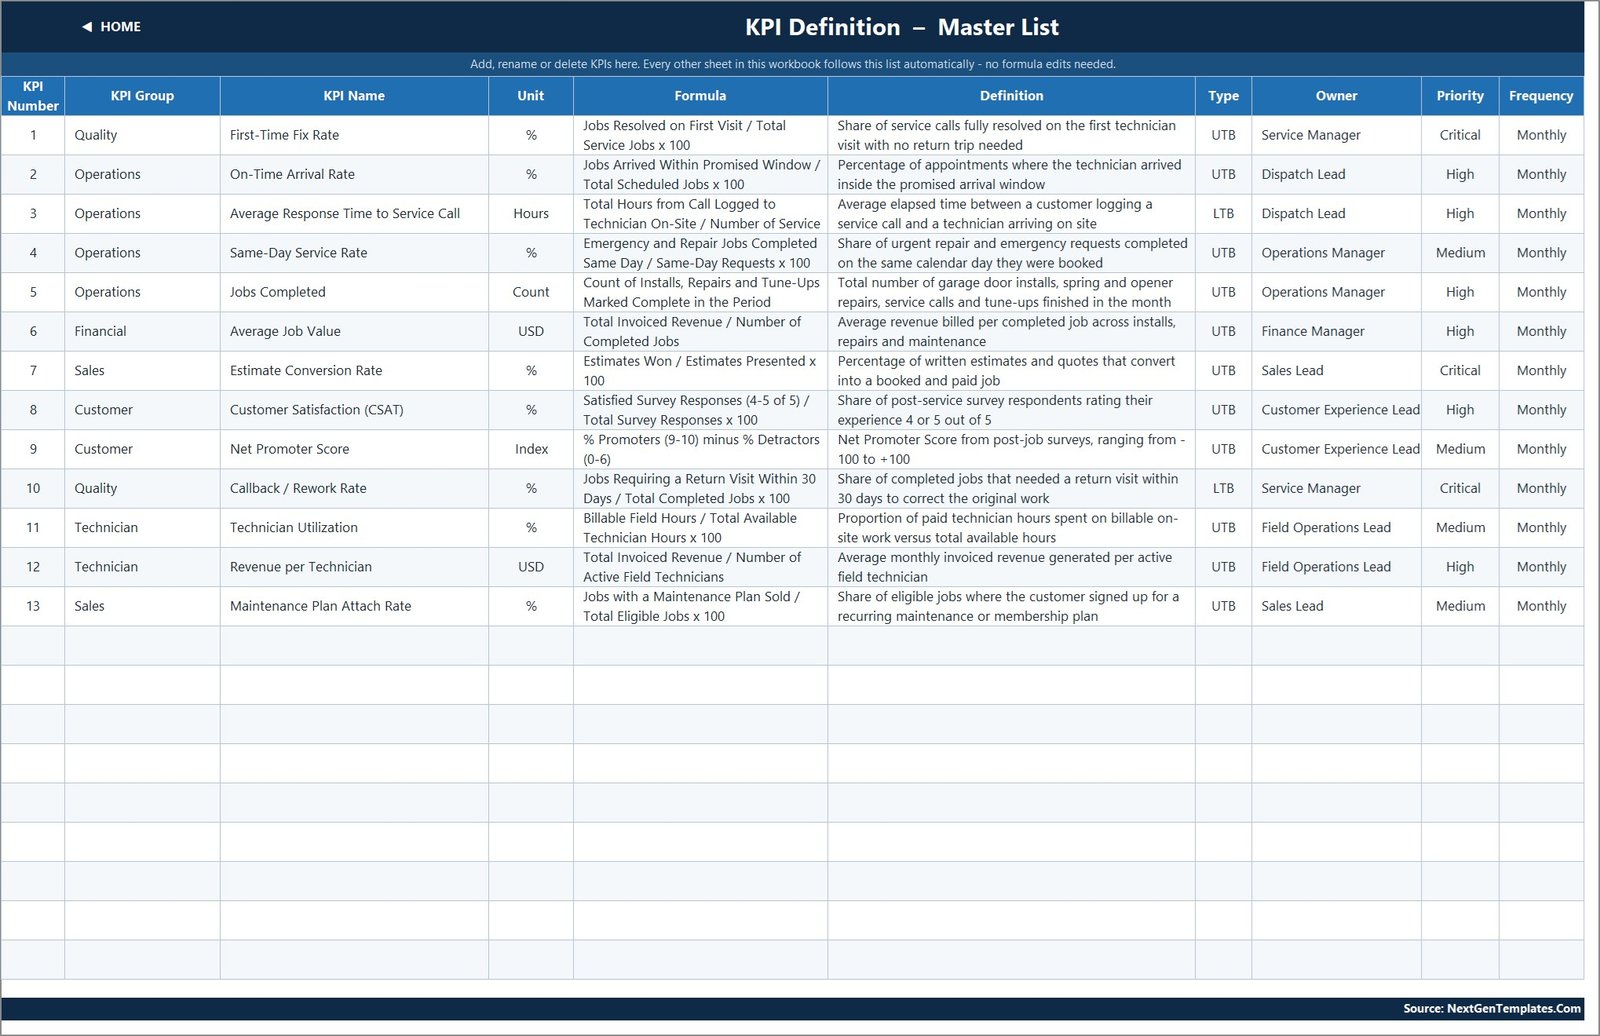
The master list, and the one sheet worth spending ten minutes on before you type a single number: KPI number, group, name, unit, formula, definition, type (UTB or LTB), owner, priority and frequency. Rename a KPI here and everything follows. Clear a row and the dashboard row blanks while the summary cards recount themselves.
Read Me, Support and Get More Templates
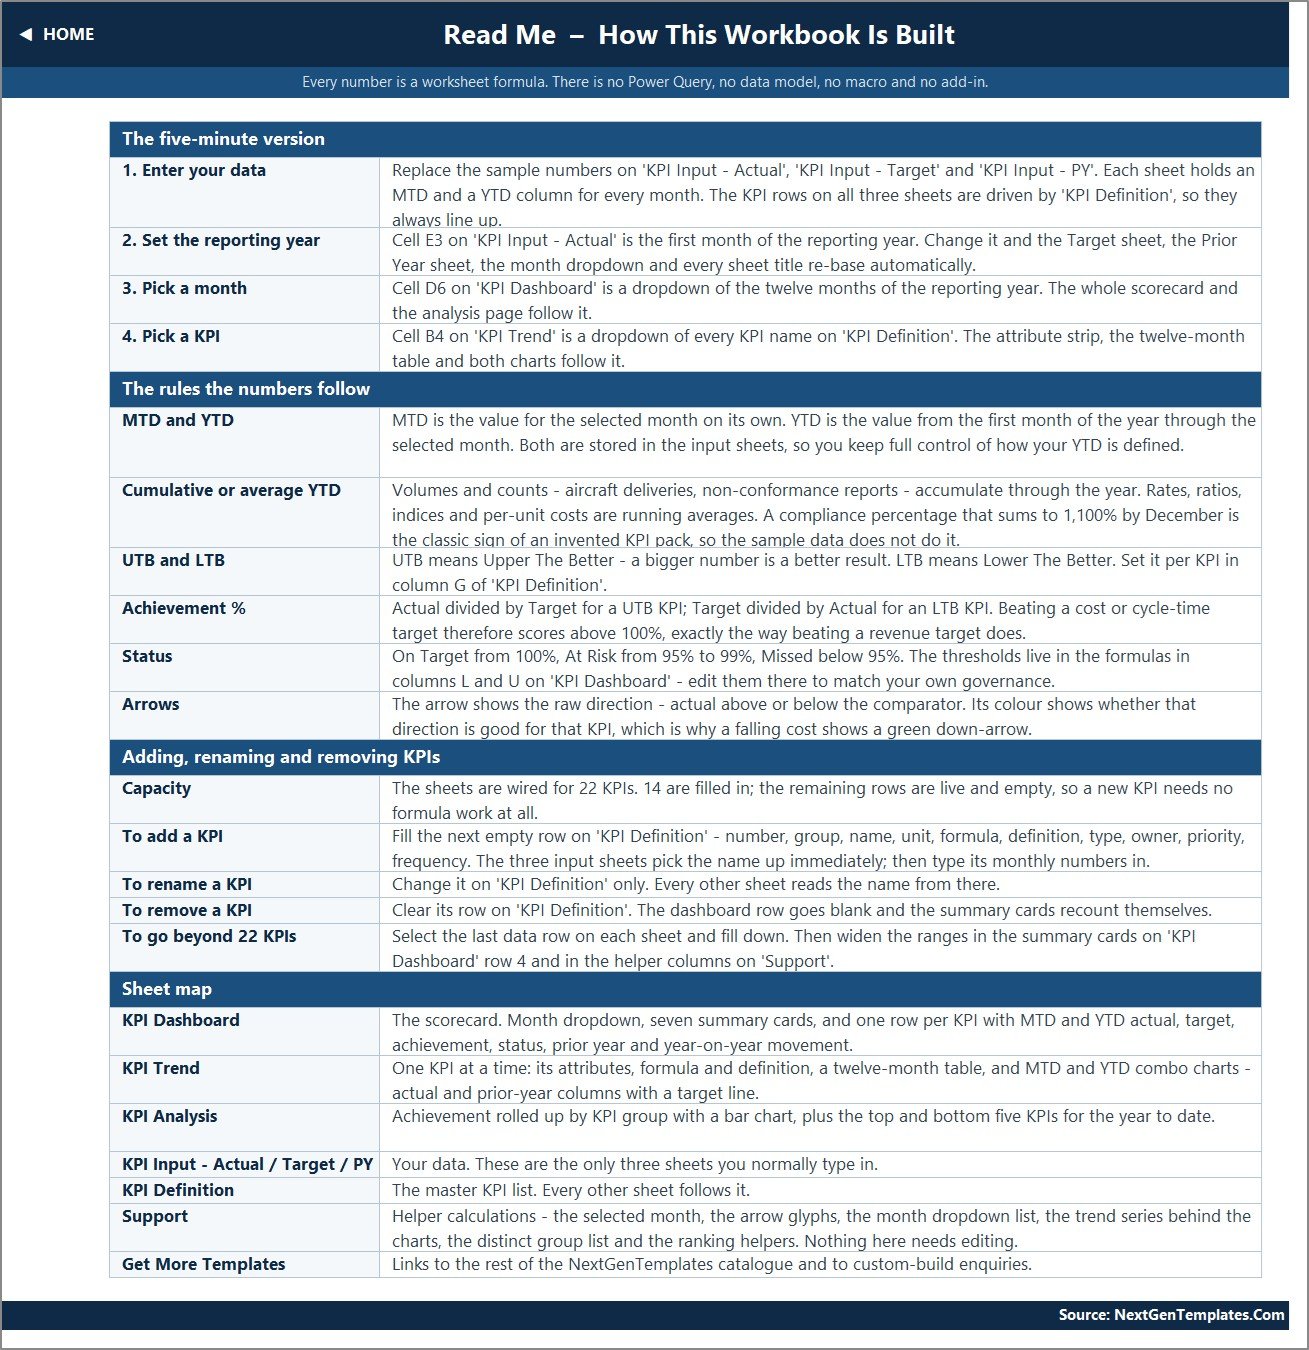
Read Me is a genuine build document, not filler – it explains how MTD and YTD are stored, when a YTD should accumulate and when it should average, how achievement and status are computed, what the arrows mean, and how to add, rename or remove a KPI. Support is hidden and holds the selected month, the arrow glyphs, the dropdown lists, the trend series and the ranking helpers. Get More Templates points at the wider catalogue.
Garage Door Service KPI Dashboard in Excel vs a Google Sheets scorecard vs field-service SaaS
| This Excel dashboard | Google Sheets KPI dashboard | Field-service SaaS | |
|---|---|---|---|
| Cost | One-off 19.99 (12.99 on sale) | One-off 13.99 | 50-200+ per user per month |
| Time to first chart | Minutes – sample data is already in | Minutes | Days to weeks |
| Offline | Yes | No | No |
| Collaboration | File sharing or OneDrive | Native, real time | Native |
| Charts | Native Excel combo charts | Sheets charts | Vendor visuals |
| Custom KPIs | Type a row, nine spare | Type a row | Often a paid tier |
| Dispatch, invoicing, payments | No | No | Yes |
| Where your data lives | Your machine | Google Drive | Vendor cloud |
Who should use this template
Owner-operators and two-to-thirty-van garage door companies that already capture jobs somewhere and want a monthly management review on one page. Franchise operators reporting a standard KPI set upward. Operations managers who need a board pack without a BI licence. Bookkeepers and fractional finance people producing a monthly pack for a trades client.
It is the wrong tool if you want live dispatch, GPS tracking, automatic sync from ServiceTitan or Jobber, or daily granularity. Every figure here is typed or pasted monthly, on purpose.
A straight answer on safety and licensing
Garage doors run on high-tension torsion springs and, in many jurisdictions, installation and repair are licensed and insured trades. This workbook measures performance. It is not a compliance system, it holds no certification records, and a green light on Callback / Rework Rate is not evidence that any particular job met code. Keep licensing, insurance, training records and incident logs wherever your regulator and insurer expect to find them.
Real-world use cases
- The monthly review. Pick last month, look at seven cards and thirteen rows, and have a fifteen-minute conversation grounded in numbers rather than impressions.
- Quality versus speed. Callback / Rework Rate sits three rows below First-Time Fix Rate, which makes the trade-off visible. A team that is fast and wrong shows up immediately.
- Dispatch performance. On-Time Arrival Rate and Average Response Time to Service Call, both against targets, turn a vague complaint into a measured gap.
- Recurring revenue. Trend Maintenance Plan Attach Rate across twelve months and you can see whether a sales push held or faded after six weeks.
- Hiring decisions. Revenue per Technician and Technician Utilization together answer whether the next van pays for itself.
- Multi-branch comparison. One copy per branch, identical definitions, genuinely comparable numbers.
Advantages of the Garage Door Service KPI Dashboard in Excel
- Nothing to learn. If you can use a dropdown and paste a column, you can run it.
- The formulas are readable. Achievement, status, arrows and the summary cards are all plain worksheet functions – VLOOKUP, MATCH, INDEX, COUNTIF, SUMPRODUCT. Click any cell and you can see exactly how the number was made.
- Direction handled properly. A lot of home-made KPI sheets quietly break on lower-is-better metrics. This one types each KPI and inverts the achievement calculation accordingly.
- It opens everywhere. Excel 2013 onward, Excel for Mac, Excel for the web – no macro warning, no add-in prompt, no data model.
- The definitions travel with the file. Every KPI carries its own formula, definition and owner, so a new manager can pick it up without a handover call.
Opportunities for improvement
Three things are worth knowing before you buy, because none of them is mentioned on the sales page and all three are easy to live with.
- The Home page and the Read Me both say “14 KPIs” while the file ships 13. Everything that calculates uses the real thirteen – the summary cards count them with COUNTIF – so the number is a stale label in two blocks of descriptive text, not a broken formula. Retype it if it bothers you.
- The Read Me carries a leftover example from another template. Its “Cumulative or average YTD” row illustrates the point with “aircraft deliveries, non-conformance reports”, which belongs to an aerospace workbook rather than a garage door one. The rule it describes is correct; only the example is wrong.
- YTD is typed, not derived. Each input sheet stores both an MTD and a YTD value per month, and the workbook does not calculate the second from the first. That is a deliberate design choice – it lets you decide per KPI whether the year to date accumulates (jobs completed) or averages (a rate) – but it does mean two numbers to enter per KPI per month rather than one. If you would rather it derived, a SUM or AVERAGE across the MTD row will do it in one formula.
A minor cosmetic point: on the Get More Templates page the “Need a Custom Dashboard?” panel clips a line of its own text when printed. It affects nothing that calculates.
Best practices
- Edit KPI Definition first. Set the thirteen names, units, types and owners before you enter a single number. Everything downstream reads from it.
- Set your reporting year once. Cell E3 on KPI Input – Actual. If you run April to March, set it there and let the workbook re-base everything.
- Be honest about targets. A dashboard where everything is green is a dashboard nobody reads. Set targets you might miss.
- Match the bands to your governance. The default is On Target from 100%, At Risk 95-99%, Missed below 95%. If your board uses 90% as the red line, change the two formulas in columns L and U.
- Decide your YTD convention and write it down. Volumes accumulate, rates average. Being inconsistent between KPIs is the fastest way to lose trust in the pack.
- Keep the prior-year sheet current. The vs-PY column is the most persuasive part of the scorecard, and it is worthless if last year was never filled in.
- Save a copy per year. The workbook is a single reporting year by design. Archive rather than overwrite.
Explore relevant templates
If you like this one, the same engine is available for neighbouring trades and other platforms:
- Septic Tank Service KPI Dashboard in Excel
- Pest Control Business KPI Dashboard in Excel
- Locksmith Business KPI Scorecard in Excel
- Locksmith Business KPI Dashboard in Power BI
- Garage Door Service KPI Dashboard in Google Sheets – the same line, built for Drive.
- Garage Door Service KPI Dashboard in Power BI – the Power BI edition.
- Garage Door Service KPI Scorecard in Google Sheets – the lighter scorecard family.
Frequently asked questions
What KPIs does the Garage Door Service KPI Dashboard in Excel track?
Thirteen: First-Time Fix Rate, On-Time Arrival Rate, Average Response Time to Service Call, Same-Day Service Rate, Jobs Completed, Average Job Value, Estimate Conversion Rate, Customer Satisfaction (CSAT), Net Promoter Score, Callback / Rework Rate, Technician Utilization, Revenue per Technician and Maintenance Plan Attach Rate.
How is this different from your Garage Door Service KPI Scorecard?
The scorecard is a separate, single-page product with its own KPI list. This dashboard adds the month picker, seven summary cards, a dedicated trend page for any single KPI and an analysis page with group roll-ups and top and bottom five performers. Different depth, same trade.
Do I need macros, Power Query or Power Pivot?
No. Plain worksheet formulas throughout, which is why it opens in Excel 2013 and later and in Excel for the web with no security prompt.
How long does setup take?
Twenty minutes to an hour, depending on whether your twelve months of history are already in a spreadsheet or still in a job book.
How does it compare to ServiceTitan or Jobber?
It does not compete with them. Those run your business – scheduling, dispatch, invoicing, payments. This reports on it. Plenty of companies use both: the software captures the jobs, the workbook turns a month of them into a management conversation.
Can I add a fourteenth KPI?
Yes. The sheets are wired for 22 and 13 are used, so type the new one on the next empty KPI Definition row and fill in its monthly numbers. No formula work.
Is anything locked or password protected?
Nothing at all, including the hidden Support sheet. Unhide it, read it, change it.
Does it calculate year-to-date automatically?
No. Both MTD and YTD are entered on the input sheets so you control the convention per KPI. See the third point under Opportunities for Improvement above.
About the author
NextGenTemplates builds ready-to-use Excel, Power BI and Google Sheets templates for small and mid-sized businesses – over 4,500 KPI dashboards and 870 analytics dashboards published to date, all editable, all shipped with sample data, and all built on formulas that are meant to be read rather than hidden. Custom builds are available: email [email protected].
Conclusion
A garage door business does not fail because nobody was working. It fails because the callbacks, the missed arrival windows and the slow drift in average job value never got measured until they were large. Thirteen numbers, reviewed once a month against a target and against last year, are usually enough to catch all three early.
That is the whole proposition of the Garage Door Service KPI Dashboard in Excel: a scorecard you can populate in an afternoon, read in fifteen minutes and hand to a manager without a training session. It is honest about what it does not do – no dispatch, no invoicing, no compliance records – and completely open about how it does what it does.
Get the Garage Door Service KPI Dashboard in Excel on NextGenTemplates →
Prefer video? Visit youtube.com/@NextGenTemplates for step-by-step walkthroughs of our Excel, Power BI and Google Sheets templates.