New: NextGenTemplates Academy - video courses on Excel formulas with AI and Pivot Tables & dashboards. Early-bird: 20% off with code EARLYBIRD20 - first 20 orders only.See the courses →
PKComments Off on Garage Door Service KPI Dashboard in Excel
Most garage door companies measure the wrong thing. They count jobs. A busy month feels like a good month, right up to the point where the callbacks land, the second
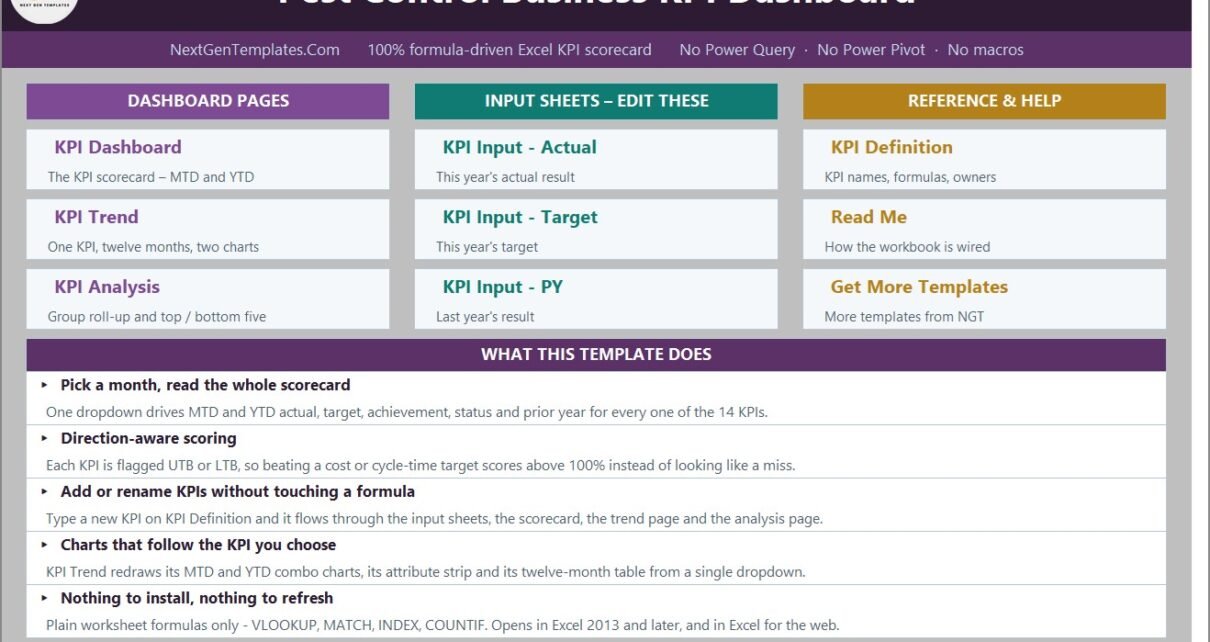
PKComments Off on Pest Control Business KPI Dashboard in Excel
The Pest Control Business KPI Dashboard in Excel tracks 15 pest-control KPIs across 6 KPI groups on 11 worksheets, driven by a single month dropdown. Seven summary cards, a full
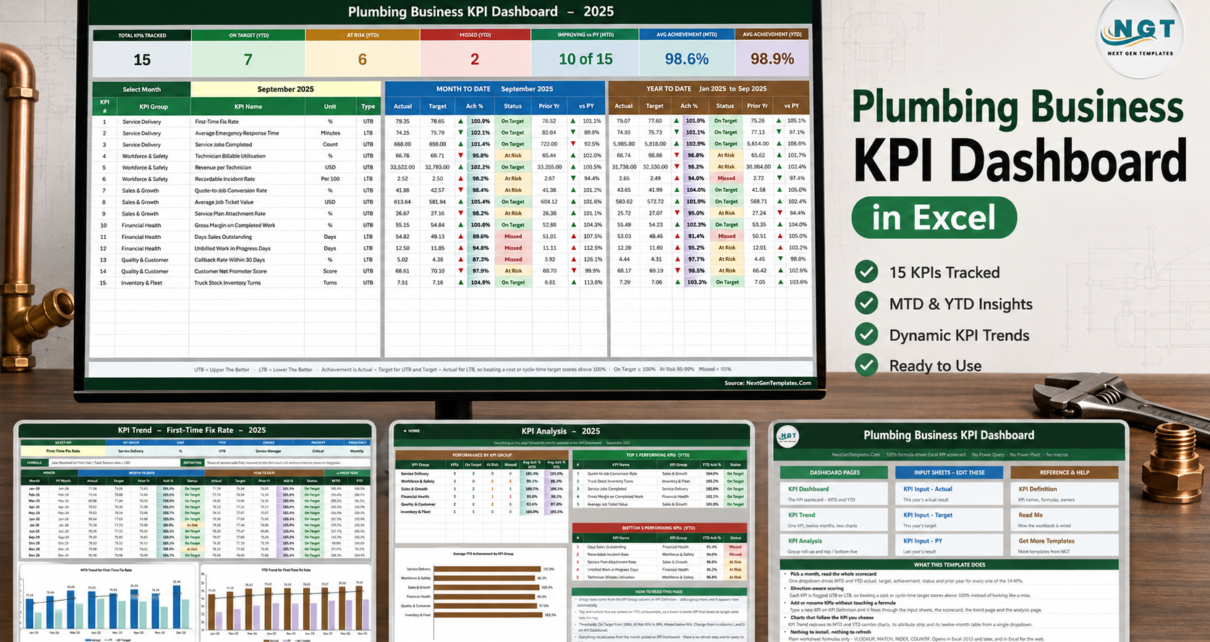
PKComments Off on Plumbing Business KPI Dashboard in Excel
Most plumbing companies measure exactly two things: revenue and whether the phone rang. The Plumbing Business KPI Dashboard in Excel replaces that with 15 KPIs across 6 groups on a
PKComments Off on Change Management KPI Dashboard in Excel
Change is constant in every business. Organizations need to adapt quickly to new technologies, processes, and market demands to stay competitive. However, managing change is never easy. Without proper monitoring
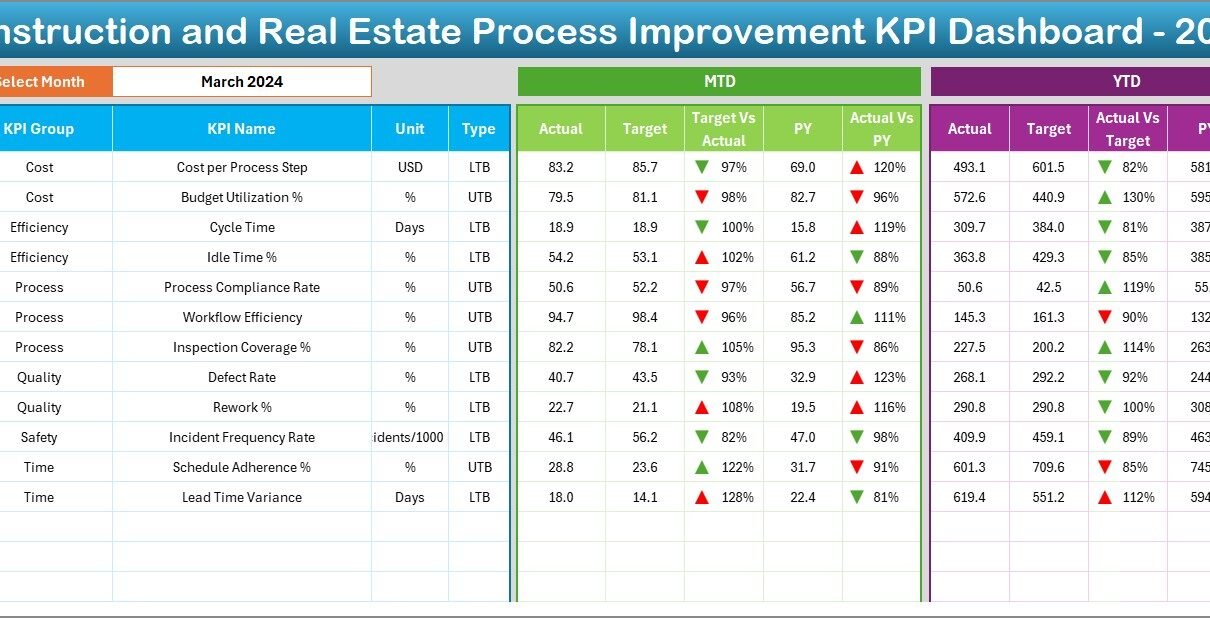
PKComments Off on Construction and Real Estate Process Improvement KPI Dashboard in Excel
In the highly competitive construction and real estate industry, data-driven decision-making is no longer optional—it’s essential. From managing project timelines to improving resource utilization, every decision impacts profitability, client satisfaction,