The Pest Control Business KPI Dashboard in Excel tracks 15 pest-control KPIs across 6 KPI groups on 11 worksheets, driven by a single month dropdown. Seven summary cards, a full month-to-date and year-to-date scorecard, a twelve-month trend page and a group roll-up page all recalculate from that one cell. Every figure is a plain worksheet formula: no macros, no Power Query, no Power Pivot and no add-ins.
Most pest-control firms already have the numbers. They sit in a field-service platform, a spreadsheet of job totals and somebody’s inbox. What is missing is the monthly page that says, plainly, which metrics beat target and which did not, with last year beside them. That is the whole job of this workbook, and it is why the Pest Control Business KPI Dashboard in Excel is a reporting layer rather than another system to run your business in.
Which product line this is – and which it is not
NextGenTemplates ships three families whose names look almost identical, so it is worth being blunt about which one you are reading about.
- This one – the Excel KPI Dashboard line. A month-picker scorecard with traffic lights, plus a KPI Trend page and a KPI Analysis page. Fifteen KPIs, three input sheets, no raw records.
- The analytical Excel Dashboard line. Pivot tables and slicers over job-level data. That is the Pest Control Dashboard in Excel and its Power BI twin.
- The Excel KPI Scorecard line. A shorter ten-KPI scorecard with a different sheet structure, like the Septic Tank Service KPI Scorecard in Excel.
They are complements, not duplicates. Plenty of operators run the analytical dashboard for weekly digging and the KPI dashboard for the monthly board pack.
Key Features of the Pest Control Business KPI Dashboard in Excel
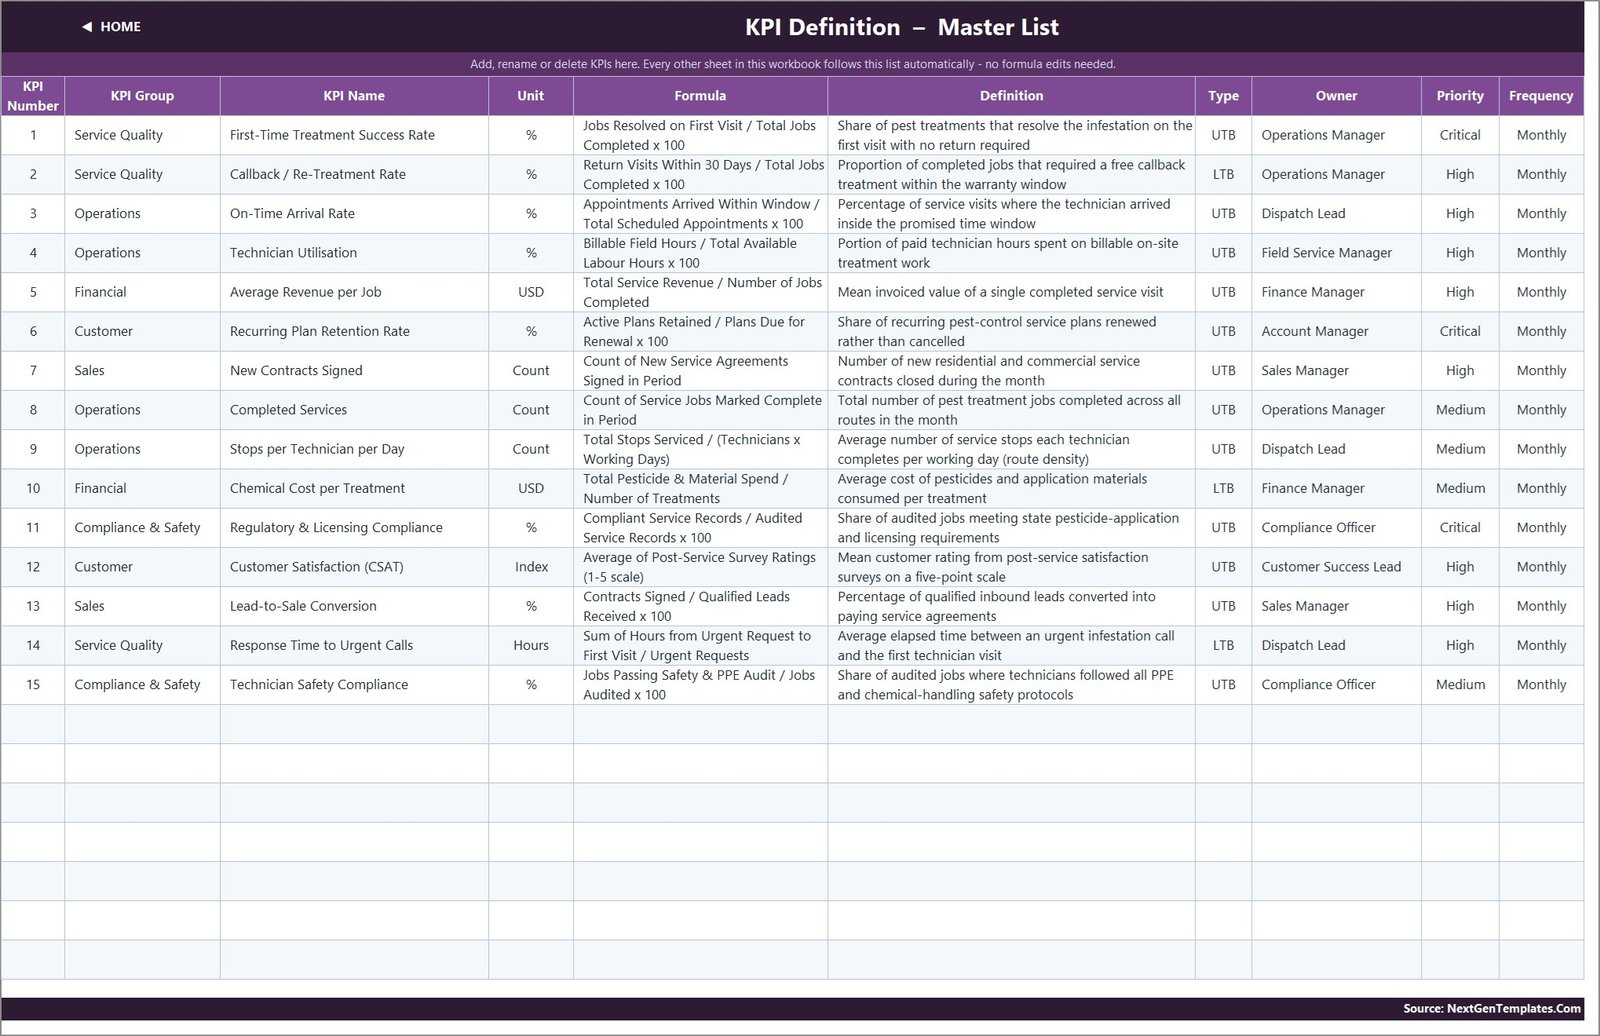
Fifteen KPIs written for this trade. First-Time Treatment Success Rate, Callback / Re-Treatment Rate, On-Time Arrival Rate, Technician Utilisation, Average Revenue per Job, Recurring Plan Retention Rate, New Contracts Signed, Completed Services, Stops per Technician per Day, Chemical Cost per Treatment, Regulatory & Licensing Compliance, Customer Satisfaction (CSAT), Lead-to-Sale Conversion, Response Time to Urgent Calls and Technician Safety Compliance. Each carries a unit, a written formula, a definition, an owner, a priority and a frequency.
One dropdown drives the whole file. Cell D6 on the KPI Dashboard sheet lists the twelve months of your reporting year. Change it and the seven cards, all fifteen KPI rows and the entire KPI Analysis page move with it. There is no refresh button because there is nothing to refresh.
Direction-aware scoring. Twelve of the fifteen KPIs are typed UTB – Upper The Better – and three are typed LTB: Callback / Re-Treatment Rate, Chemical Cost per Treatment and Response Time to Urgent Calls. Achievement is Actual divided by Target for a UTB metric and Target divided by Actual for an LTB one. A callback rate that falls therefore scores above 100% and shows a green down-arrow, which is the behaviour a service manager expects and the behaviour most home-made scorecards get wrong.
Twelve comparison columns per KPI. Each row shows actual, target, achievement %, status, prior year and year-on-year movement for the selected month, then the same six again for the year to date. No pivot table is involved.
Thresholds you can move. On Target starts at 100%, At Risk covers 95% to 99%, Missed is anything below 95%. Those bands live in the formulas in columns L and U on the KPI Dashboard sheet, so a firm with tighter governance edits two formulas.
Dashboard Pages Explanation
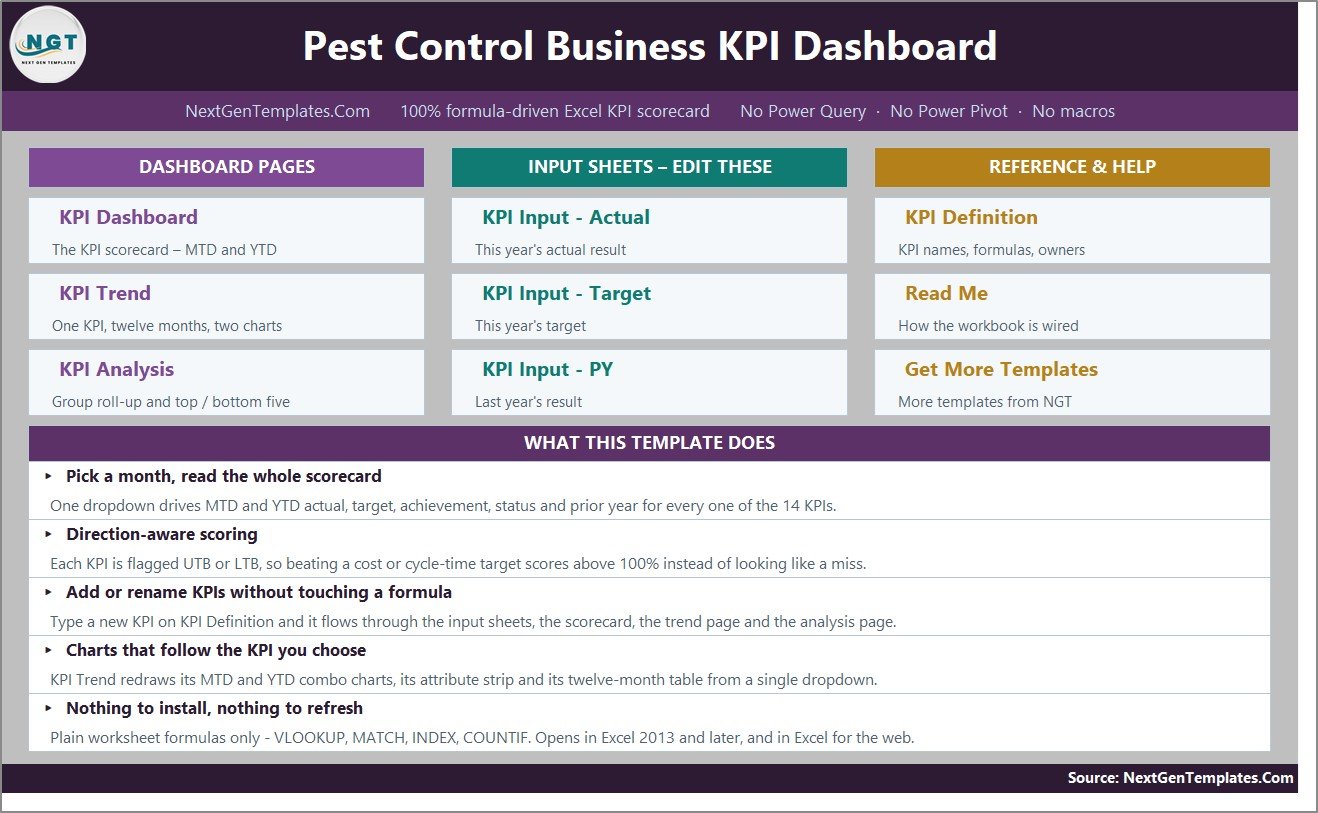
Home
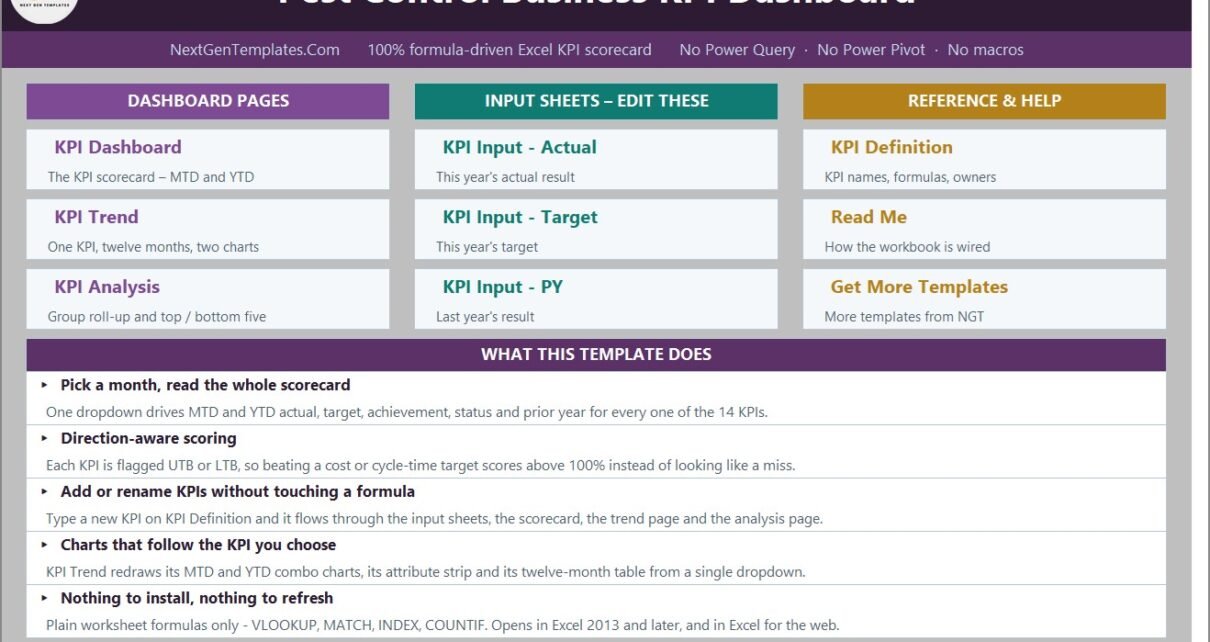
A three-column navigation page – dashboard pages, the input sheets you edit, reference and help – with a short summary of what the file does. Every sheet carries a HOME link back.
KPI Dashboard – the scorecard
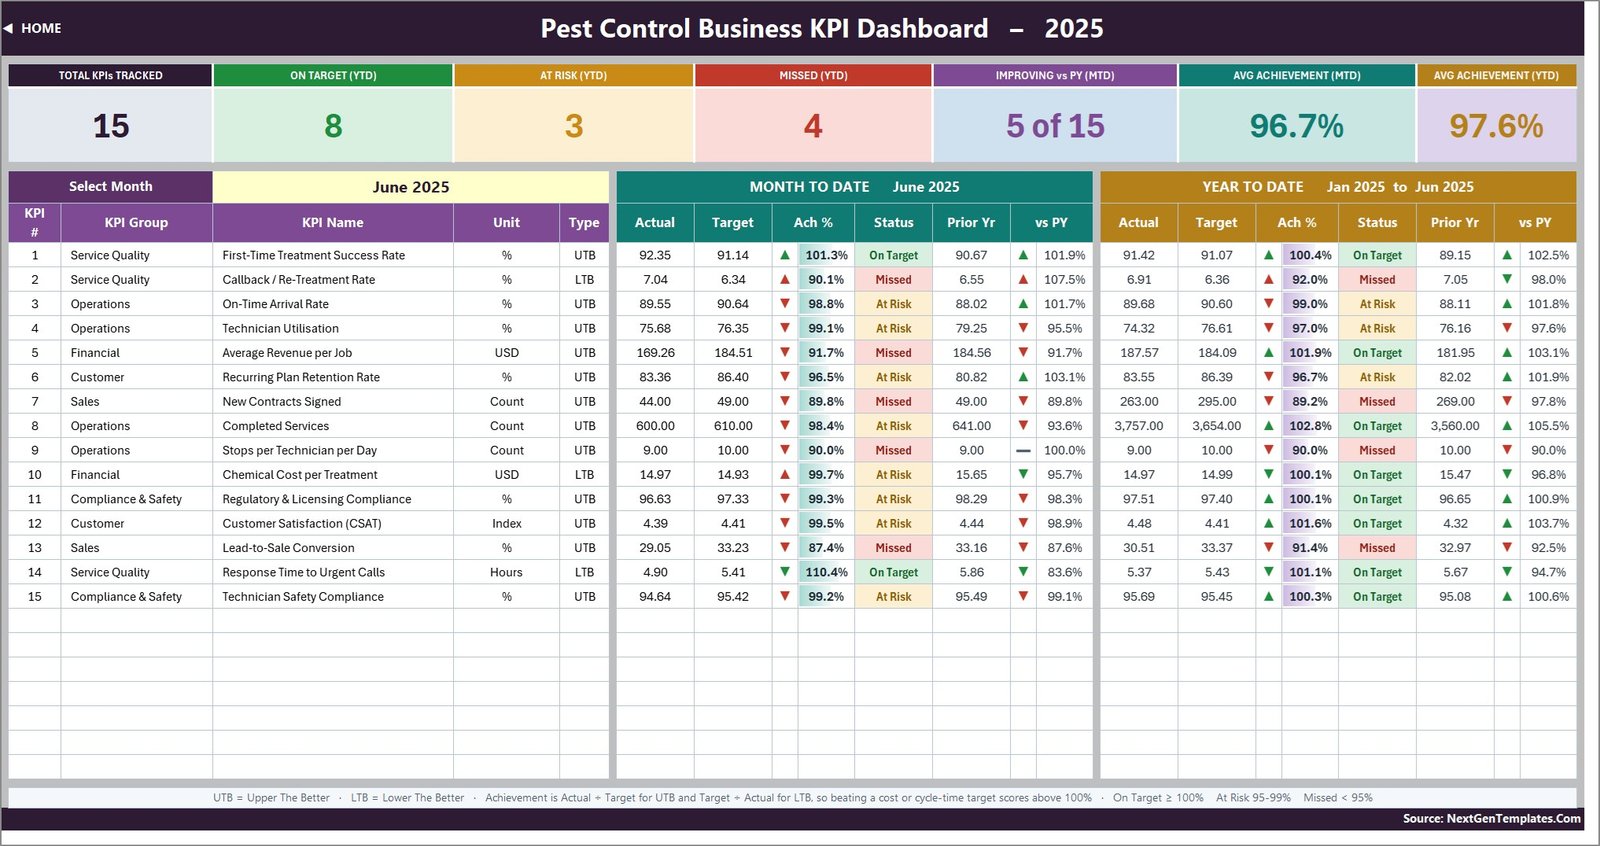
The page you will actually screenshot. In the shipped sample – reporting year 2025 with June selected – the seven cards read 15 total KPIs tracked, 8 On Target, 3 At Risk and 4 Missed on a year-to-date basis, 5 of 15 improving against prior year for the month, 96.7% average MTD achievement and 97.6% average YTD achievement. Below them sit the fifteen rows, colour-banded by status.
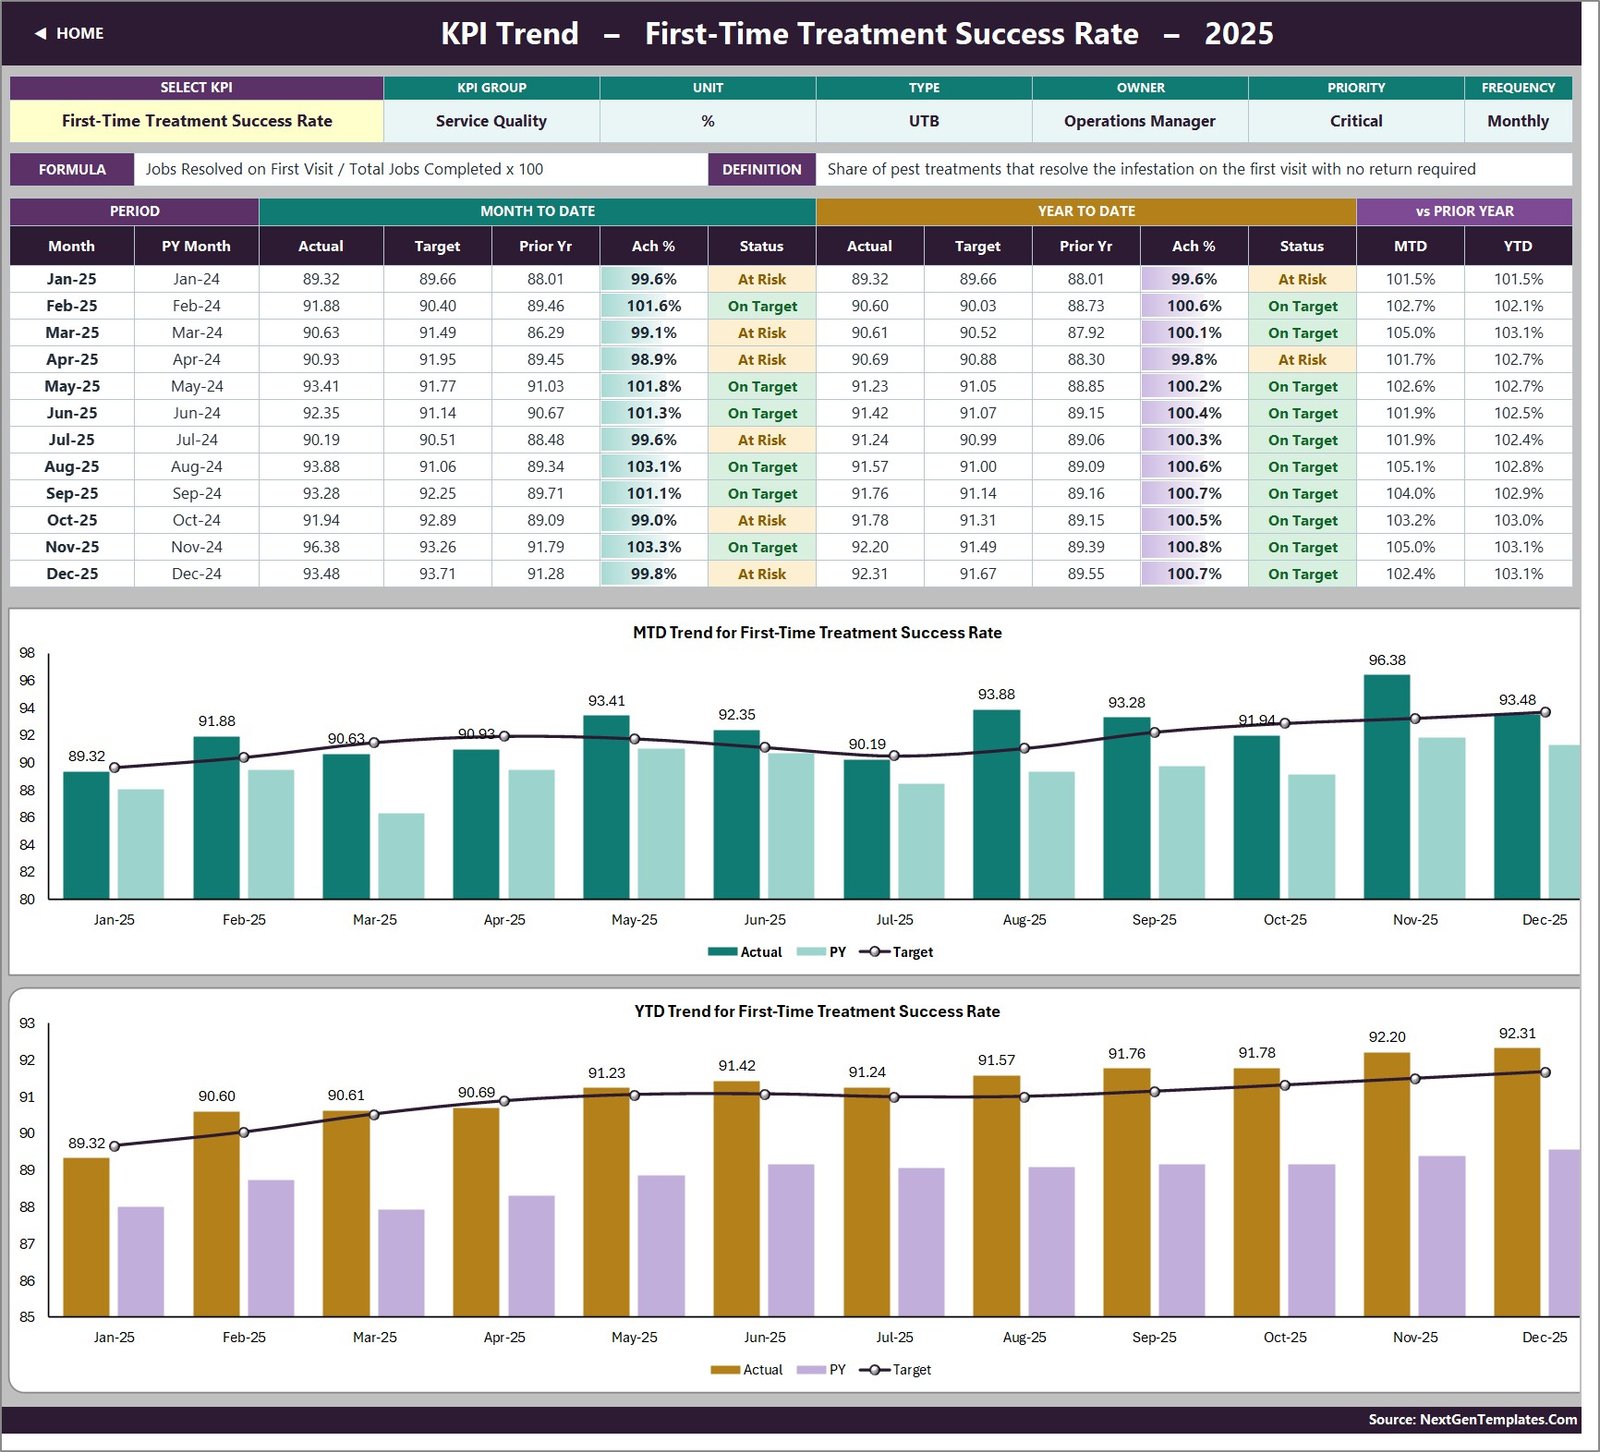
KPI Trend
Pick any single KPI in cell B4 and the page rebuilds around it: its group, unit, type, owner, priority and frequency in a strip across the top, then its formula and definition, then a twelve-month table of MTD and YTD actual, target, prior year, achievement and status, and finally two combo charts showing actual and prior-year columns against a target line.
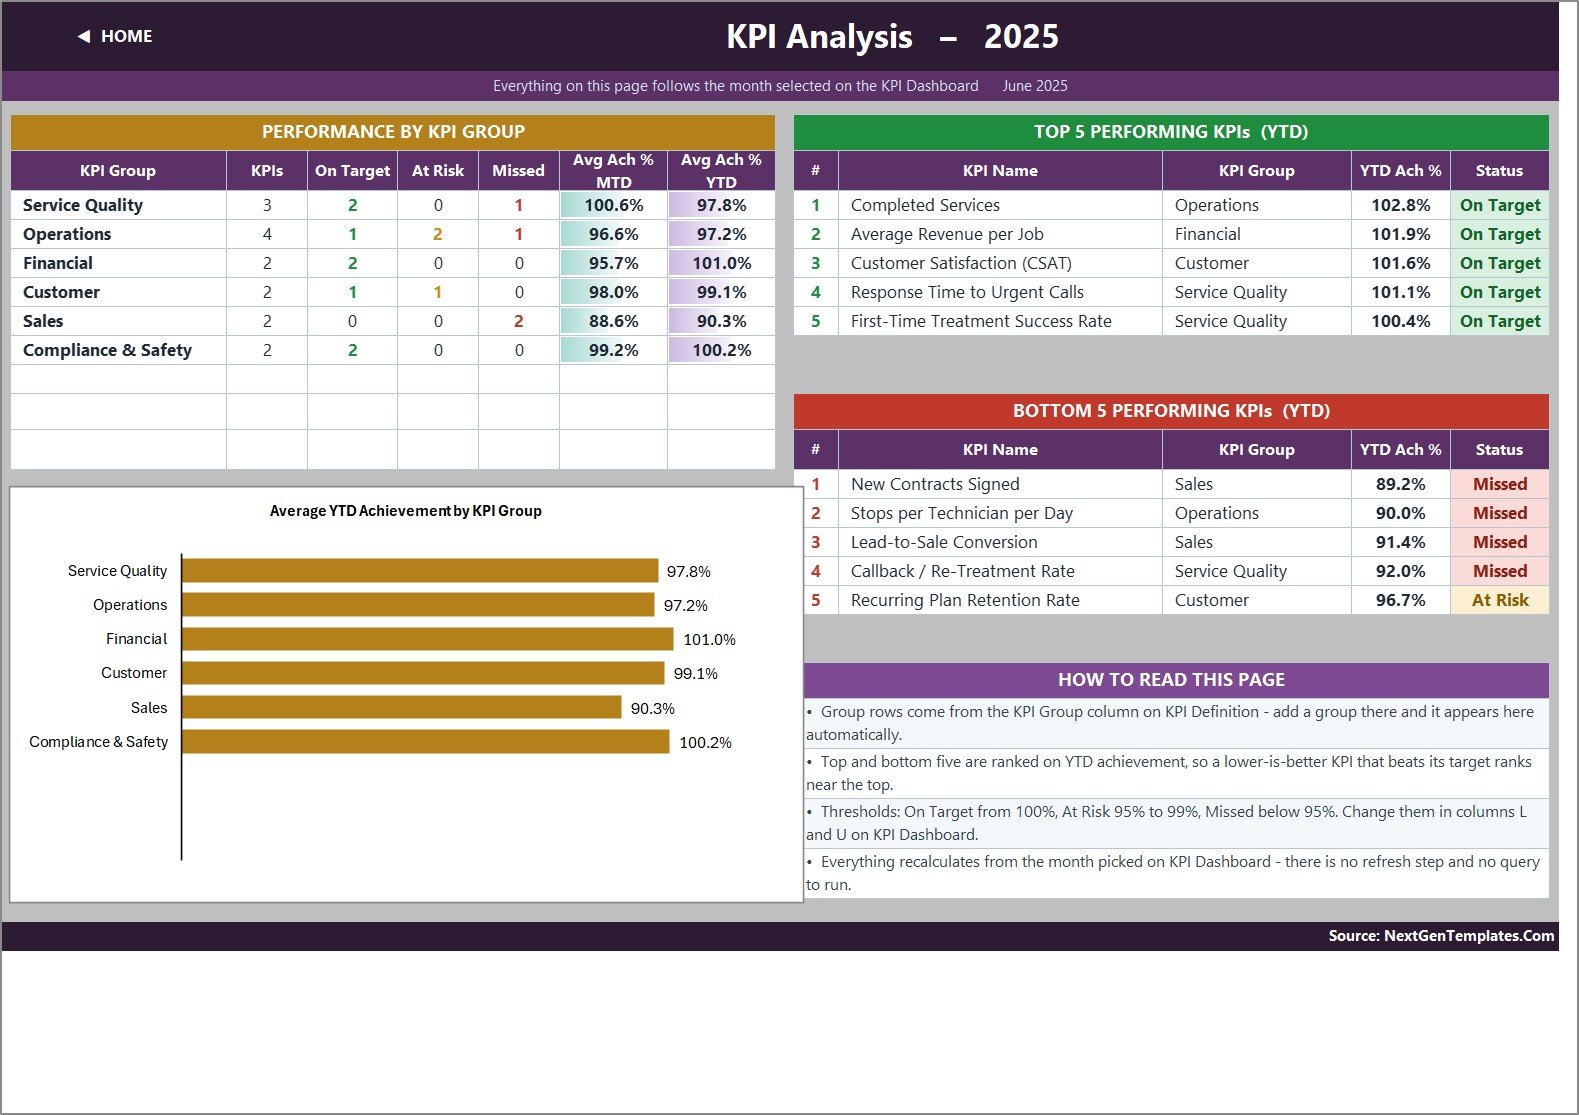
KPI Analysis
Achievement rolled up by KPI group, with a bar chart beside it, plus Top 5 and Bottom 5 performing KPIs for the year to date. In the sample the six groups hold 3, 4, 2, 2, 2 and 2 KPIs; Financial leads at 101.0% average YTD achievement and Sales trails at 90.3%, with New Contracts Signed and Lead-to-Sale Conversion both in the bottom five.
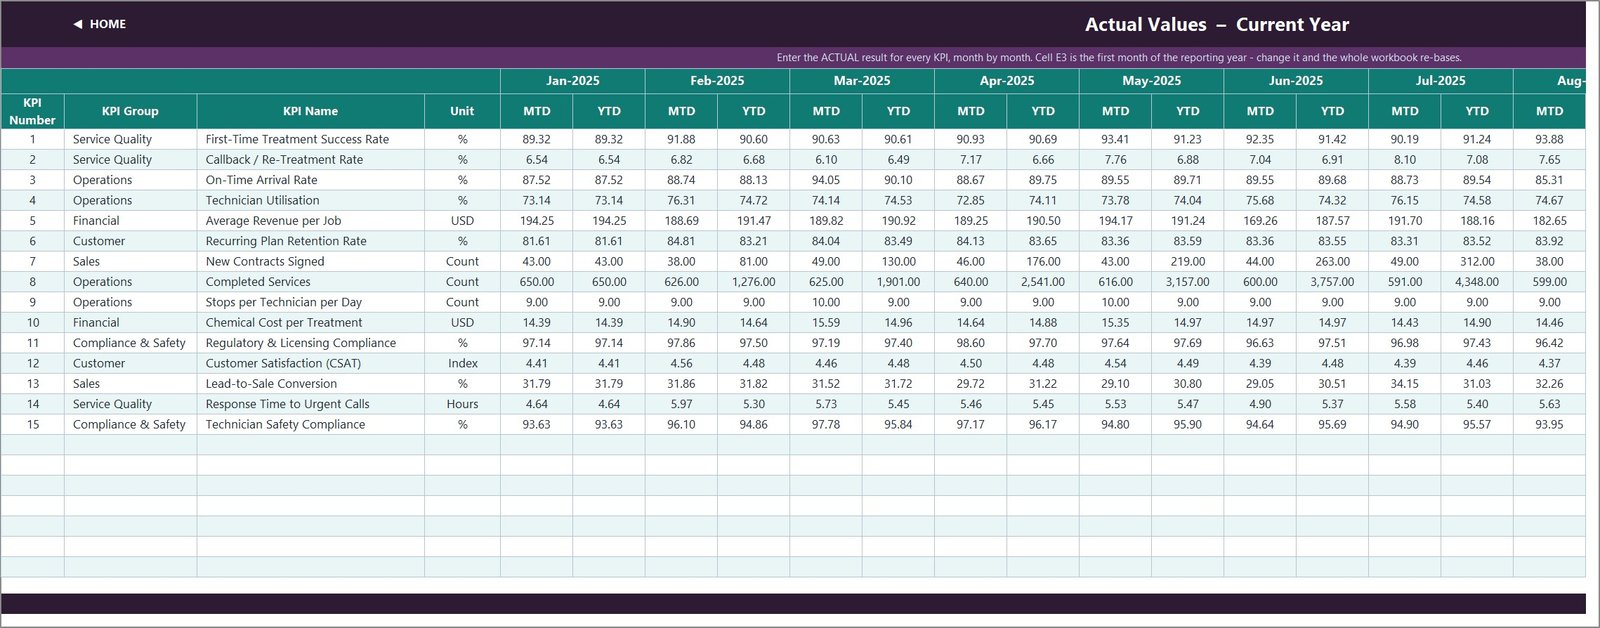
KPI Input – Actual, Target and Prior Year
The only three sheets you normally type in. Each holds an MTD and a YTD column for every month of the year, for every KPI, and the KPI rows on all three follow the KPI Definition sheet so they can never fall out of step. Cell E3 on the Actual sheet is the first month of the reporting year; change it and the other two sheets, the month dropdown and every sheet title re-base.
KPI Definition
The master list, and the sheet that makes the rest of the workbook maintainable. Ten columns per KPI. Rename a KPI here and every other sheet follows. Clear a row and the dashboard row blanks and the cards recount themselves.
Read Me, Support and Get More Templates
Read Me documents the five-minute setup, the MTD and YTD rules, UTB and LTB, the achievement formula, the status bands and how to add or remove KPIs. Support is a hidden helper sheet you never edit. Get More Templates links out to the wider catalogue.
Pest Control Business KPI Dashboard in Excel vs. a Google Sheets Scorecard vs. Paid Field-Service SaaS
| Feature | Pest Control Business KPI Dashboard in Excel | Google Sheets KPI scorecard | PestPac / ServiceTitan / Jobber |
|---|---|---|---|
| Cost | $12.99 one-time | $8.99-$13.99 one-time | $49-$300 / user / month |
| Platform | Excel 2013+ and Excel for the web | Browser only | Vendor cloud |
| Setup time | About 10 minutes | About 10 minutes | Weeks of onboarding |
| Works offline | Yes | No | No |
| Real-time collaboration | Via OneDrive or SharePoint | Yes | Yes |
| Direction-aware UTB / LTB scoring | Yes, per KPI | Yes, per KPI | Varies by vendor |
| Editable traffic-light bands | Yes – two formulas | Yes | Admin-configurable |
| Add your own KPI | Type a row, no formula work | Type a row | Custom fields, sometimes paid |
| Year-1 cost at 5 users | $12.99 | $8.99-$13.99 | $2,940-$18,000 |
For a pest-control operator who wants a monthly KPI board pack without paying per technician per month, the Pest Control Business KPI Dashboard in Excel sits in the sweet spot.
Who Should Use This Template
Perfect for:
- Owners and operations managers of residential and commercial pest-control firms running roughly 3 to 60 technicians
- Branch and regional managers who present a monthly scorecard and want MTD beside YTD on one page
- Franchise groups that need the same fifteen metrics measured the same way at every location
- Anyone who already exports monthly totals from a field-service platform and wants a clean reporting layer over them
Not a fit if:
- You need job-level or customer-level records. The workbook holds monthly KPI numbers only – there is no customer, address, technician-name, chemical, application or job table in it anywhere.
- You need scheduling, dispatch, routing, invoicing or a technician mobile app.
- You expect the file to manage pesticide compliance, applicator licensing, product registration, re-entry intervals or safety record-keeping. It does not, and the section below says exactly what it does instead.
A straight answer on compliance and safety
Pest control is a licensed, chemical-handling trade, so this deserves its own paragraph rather than a footnote. The Pest Control Business KPI Dashboard in Excel contains two Compliance & Safety KPIs – Regulatory & Licensing Compliance and Technician Safety Compliance – and each is a single percentage that you calculate somewhere else and type into an input cell. The workbook stores no chemical or product data, no registration numbers, no licence records, no application logs, no re-entry intervals and no audit trail. It cannot tell you whether you are compliant; it can only display the percentage you give it and colour it against the target you set. Treat it as a reporting page for a compliance figure, never as a compliance system.
Real-World Use Cases
Marcus runs a 14-technician firm in Texas. On the first Monday of the month he types last month’s totals onto the three input sheets, picks the month in cell D6 and screenshots the scorecard for his ops meeting. Because Callback / Re-Treatment Rate is typed LTB, a falling callback rate shows as a green down-arrow scoring above 100% instead of reading like a miss.
Priya manages four branches for a regional franchise. She keeps one copy per branch with an identical KPI Definition sheet, so Stops per Technician per Day means the same thing everywhere. The KPI Analysis page tells her within seconds which of the six groups is dragging a branch down – in her March pack it was Sales at both of her newer locations.
Dan is a solo operator with two subcontractors. He only reports six of the fifteen metrics, so he cleared the rows he did not want on KPI Definition. The dashboard rows went blank, the summary cards recounted, and he touched no formulas at all.
Advantages of the Pest Control Business KPI Dashboard in Excel
- One payment, no seats. At $12.99 it costs less than a single month of one seat on any field-service platform, and there is no renewal.
- Nothing to install or enable. Because it is pure worksheet formulas – VLOOKUP, MATCH, INDEX, COUNTIF and SUMPRODUCT – it opens in Excel 2013 and later, and in Excel for the web, with no macro prompt.
- Auditable. Every cell can be traced. Nothing is locked, hidden behind a data model, or computed by code you cannot read.
- Extensible without help. The sheets are wired for 22 KPI rows and 15 are used, so seven are live and empty.
- Sample data included. A full 2025 year of actual, target and prior-year numbers ships with it, so you see the whole thing working before you type anything.
Opportunities for Improvement
Three honest limitations, plus two documentation faults in this build that are worth knowing before you open it.
- YTD is typed, not derived. Both the MTD and the YTD figures are stored on the input sheets. That is deliberate – it lets you define YTD however your business defines it – but it does mean you enter two numbers per KPI per month rather than one.
- The Frequency column is a label, not a switch. All fifteen KPIs are on a monthly grid regardless of what Frequency says.
- No record-level detail. If you need to know which technician or which route caused a number to move, this file cannot tell you – the analytical Pest Control Dashboard can.
- The Home page and the Read Me sheet say “14 KPIs” while the workbook actually ships 15. Everything that calculates uses 15, and the summary card correctly reads 15; only those two pieces of static text are stale.
- The Read Me’s “Cumulative or average YTD” row still cites aerospace examples – aircraft deliveries and non-conformance reports – left over from a sibling build. The rule it describes is correct; the illustrations belong to a different template.
Best Practices
- Rename the fifteen sample KPIs to your own wording before you type any data. Every other sheet follows KPI Definition, so doing it first saves rework.
- Set the UTB or LTB type on every row deliberately. It is the single field that decides whether an improvement reads as green or red.
- Fill the Target sheet for the whole year in one sitting. Achievement, status and the summary cards are all meaningless without it.
- Agree your status bands once. If 95% is too generous for your business, edit columns L and U and leave them alone thereafter.
- Keep one file per reporting year and archive the previous one. The Prior Year sheet is what carries last year forward.
- Save it to OneDrive or SharePoint if more than one person types into it, so you get version history rather than emailed copies.
Explore Relevant Templates
- Pest Control Business KPI Dashboard in Excel – the template this article is about.
- Pest Control Business KPI Dashboard in Power BI – the same fifteen-KPI scorecard being prepared for Power BI Desktop.
- Pest Control Business KPI Scorecard in Google Sheets – the shorter ten-KPI scorecard line for the same trade.
- Pest Control Dashboard in Excel – the analytical line, with pivots and slicers over job-level records. Our walkthrough of it is here.
- Plumbing Business KPI Dashboard in Excel – the identical structure for a plumbing operation; see the full walkthrough.
- Septic Tank Service KPI Scorecard in Excel – a neighbouring field-service trade, and a good look at the scorecard line.
Frequently Asked Questions
What KPIs does the Pest Control Business KPI Dashboard in Excel track?
Fifteen KPIs in six groups: Service Quality (first-time treatment success, callback rate, urgent response time), Operations (on-time arrival, technician utilisation, completed services, stops per technician per day), Financial (average revenue per job, chemical cost per treatment), Customer (recurring plan retention, CSAT), Sales (new contracts signed, lead-to-sale conversion) and Compliance & Safety (two audit percentages).
Does it manage pesticide compliance or applicator licensing?
No. The Pest Control Business KPI Dashboard in Excel displays two compliance percentages that you calculate elsewhere and type in. It holds no chemical, registration, licence, application-record or re-entry-interval data of any kind and is not a compliance or safety management system.
Do I need macros, Power Query or Power Pivot?
No. The Pest Control Business KPI Dashboard in Excel is 100% worksheet formulas. There is no macro, no data model, no query and no add-in, so it opens cleanly in Excel 2013 and later and in Excel for the web.
How long does setup take?
About ten minutes if your monthly totals are already to hand: set the reporting-year cell, paste your MTD and YTD figures onto the three input sheets, then pick a month. Renaming the sample KPIs to your own wording adds another five minutes.
How does this compare to PestPac or ServiceTitan?
Those platforms run scheduling, dispatch and invoicing at roughly $49-$300 per user per month. The Pest Control Business KPI Dashboard in Excel does none of that – it is a one-time $12.99 reporting layer that turns monthly totals into a board-ready scorecard. Most buyers run both.
Can I add a sixteenth KPI?
Yes. The sheets are wired for 22 rows and 15 are filled, so seven are live and empty. Type the new KPI on KPI Definition and the input sheets, the scorecard, the trend page and the analysis page pick it up with no formula work.
Is anything locked or password protected?
No. Every sheet, formula and chart in the Pest Control Business KPI Dashboard in Excel is editable, and the hidden Support sheet can be unhidden and inspected.
About the Author
Built by PK – Microsoft Certified Professional with 15+ years of Excel, Google Sheets and Power BI experience. Founder of NextGenTemplates, reaching 300K+ subscribers across YouTube channels. Every template is hand-built and tested before release.
Conclusion
If you run a pest-control business and your monthly review is still a conversation rather than a page, the Pest Control Business KPI Dashboard in Excel closes that gap for the price of a takeaway. Fifteen KPIs, six groups, one month dropdown, MTD and YTD together, and no software to learn beyond the Excel you already have open.
👉 Click here to Purchase the Pest Control Business KPI Dashboard in Excel
Instant download · One-time payment · No subscription · Lifetime access
For more Excel dashboards, KPI scorecards and step-by-step tutorials, visit Youtube.com/@PK-AnExcelExpert.
Last updated: September 2026