Employee satisfaction plays a vital role in successful project delivery. When employees feel valued and engaged, their productivity rises and so does the success rate of your projects. But how can project managers track employee satisfaction effectively? That’s where a Project Management Employee Satisfaction KPI Dashboard in Excel becomes a game-changer.
In this article, we’ll walk you through everything you need to know—from the dashboard structure and key benefits to best practices and frequently asked questions. Whether you’re a project manager, HR leader, or business analyst, this guide will help you implement a robust and data-driven employee satisfaction monitoring system.
Click to Purchases Project Management Employee Satisfaction KPI Dashboard in Excel
What is a Project Management Employee Satisfaction KPI Dashboard?
A Project Management Employee Satisfaction KPI Dashboard is a visual reporting tool built in Microsoft Excel. It helps you track employee-related KPIs (Key Performance Indicators) that impact project performance. These include job satisfaction, training hours, performance scores, and more.
This dashboard allows managers to:
-
Monitor employee well-being and engagement
-
Compare current data with previous months or years
-
Set monthly and yearly targets
-
Improve project planning based on real-time workforce insights
The dashboard brings all essential data together into one place, making decision-making more accurate and faster.
Key Features of the Employee Satisfaction KPI Dashboard in Excel
Our ready-to-use dashboard comes with 7 dynamic and user-friendly worksheet tabs. Let’s break them down for a better understanding:
Home Sheet – Your Central Hub

The Home sheet acts as your dashboard index. It features 6 interactive buttons, each linking directly to a specific worksheet:
-
Dashboard
-
KPI Trend
-
Actual Numbers Input
-
Target Sheet
-
Previous Year Numbers
-
KPI Definition
With just a click, you can navigate across the entire dashboard effortlessly.
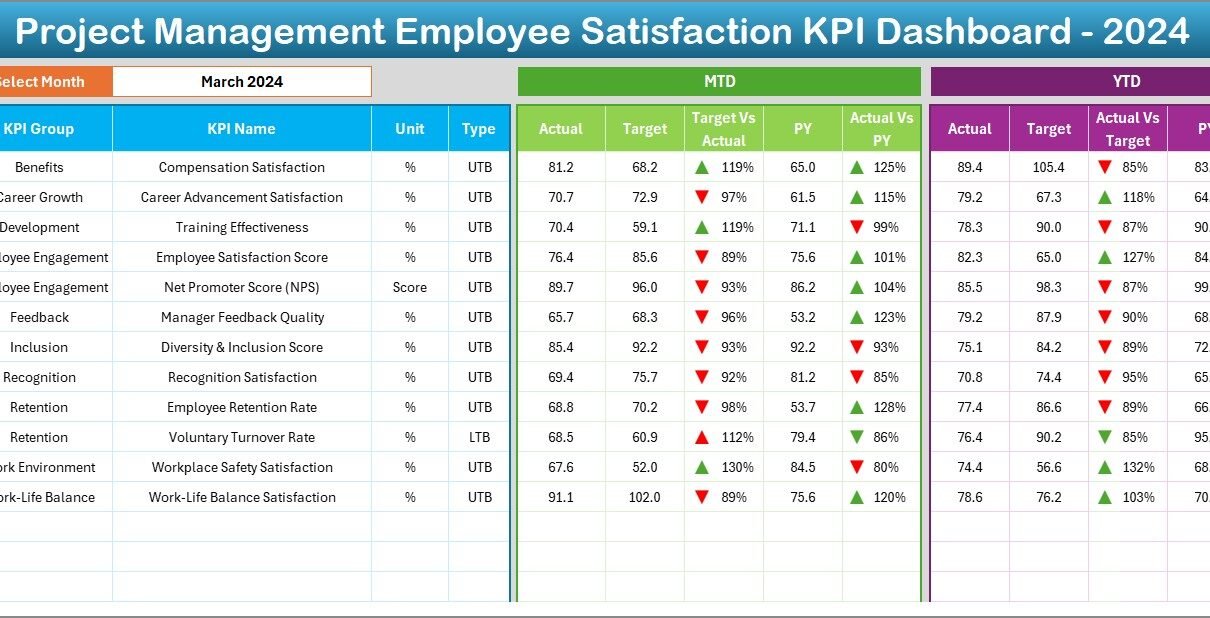
Dashboard Sheet – Real-Time Visualization
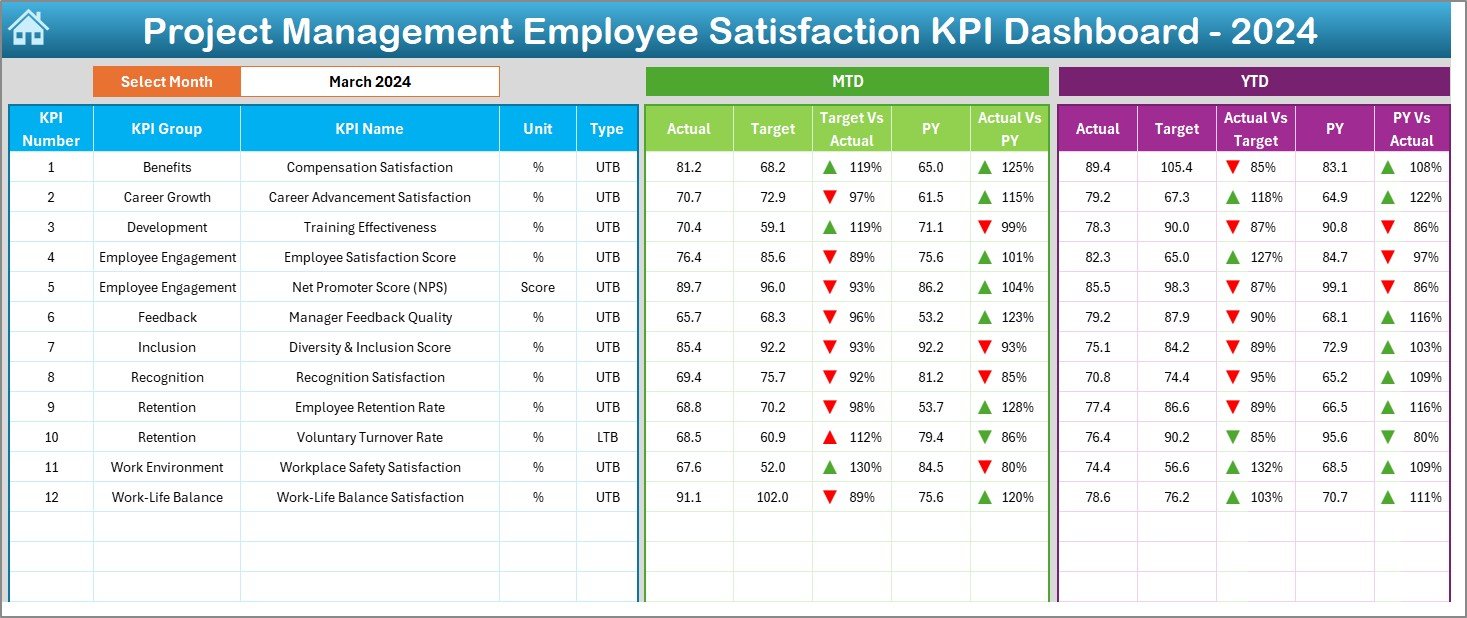
This is the heart of the template. You can select the month from a drop-down list (cell D3), and the entire dashboard updates accordingly.
It shows:
-
MTD (Month-to-Date) Actual, Target, and Previous Year values
-
YTD (Year-to-Date) Actual, Target, and Previous Year values
-
Conditional formatting with up/down arrows to highlight performance against targets and historical data
The result? You get an instant overview of how your team is performing.
Click to Purchases Project Management Employee Satisfaction KPI Dashboard in Excel
KPI Trend Sheet – Analyze Progress Over Time
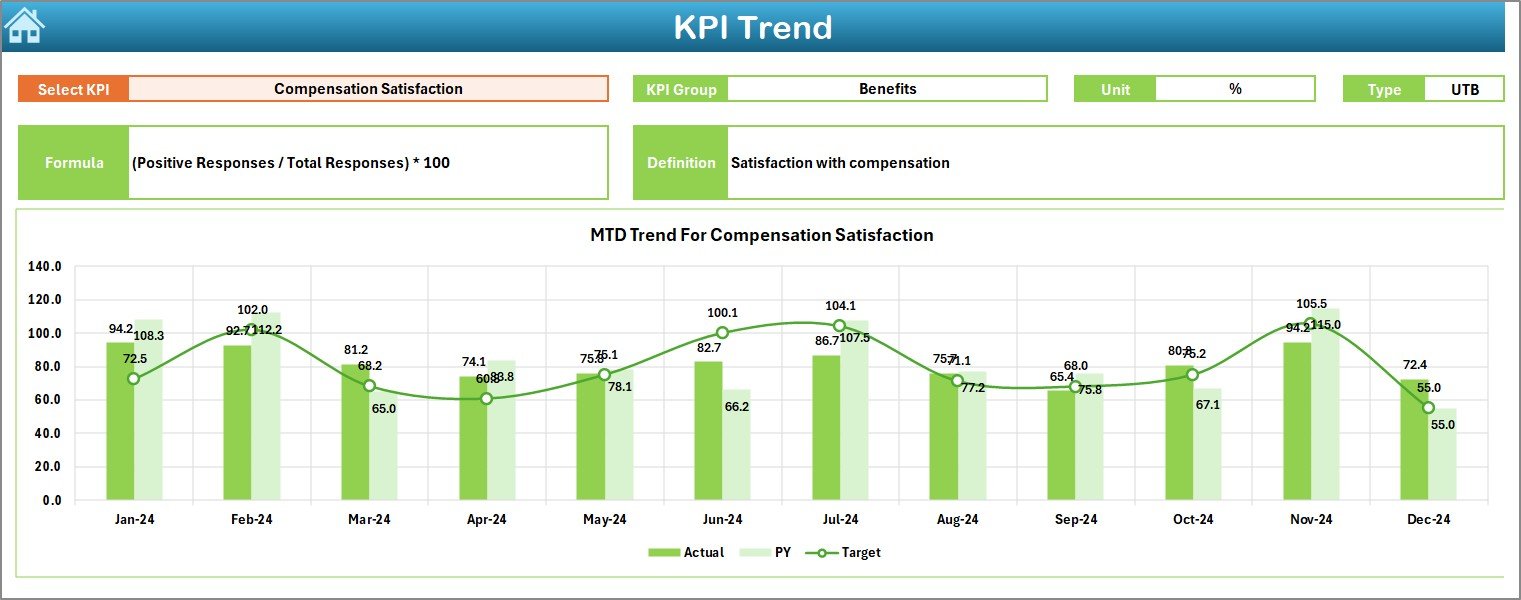
Use this sheet to dig deeper into individual KPIs. Once you select a KPI from cell C3, you’ll see:
-
KPI Group
-
KPI Unit
-
Type (LTB or UTB)
-
Formula
-
Definition
-
MTD and YTD trend charts for Actual, Target, and Previous Year
This helps you track performance trends and spot early signs of improvement or decline.
Actual Numbers Input Sheet – Feed the Engine
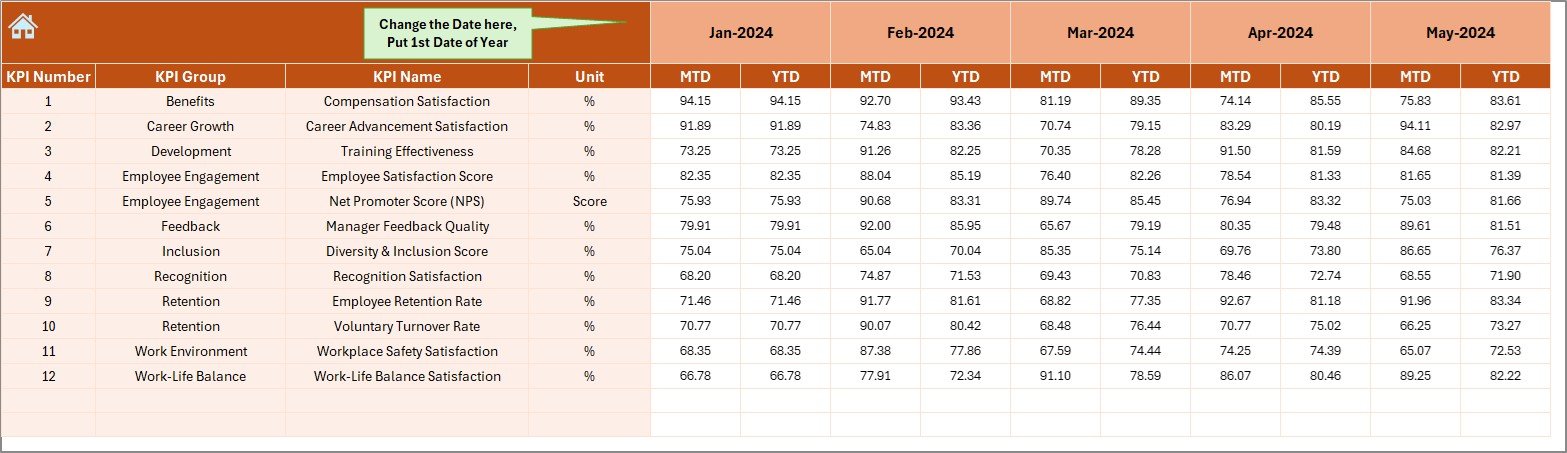
This is where you enter the real data for MTD and YTD for each KPI. Use the control cell (E1) to specify the starting month of the year, and the table adjusts accordingly.
By keeping this sheet updated monthly, your dashboard always reflects the current status of employee satisfaction metrics.
Target Sheet – Set Goals Clearly
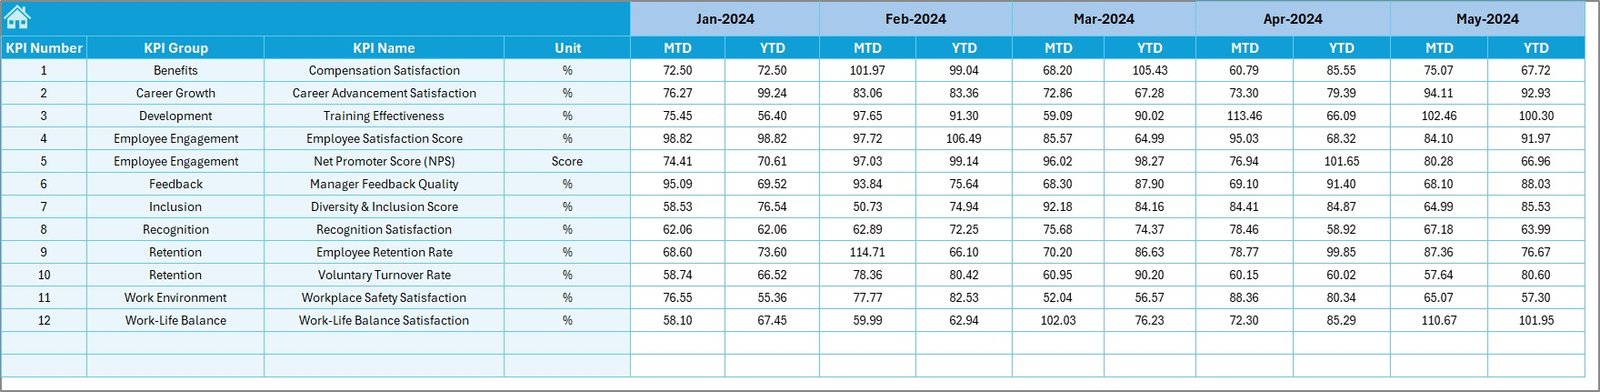
Input the MTD and YTD targets for each KPI. These numbers serve as benchmarks to evaluate actual performance.
Clearly defined targets are essential for any KPI-based strategy—they offer direction and drive accountability.
Previous Year Numbers Sheet – Historical Comparison
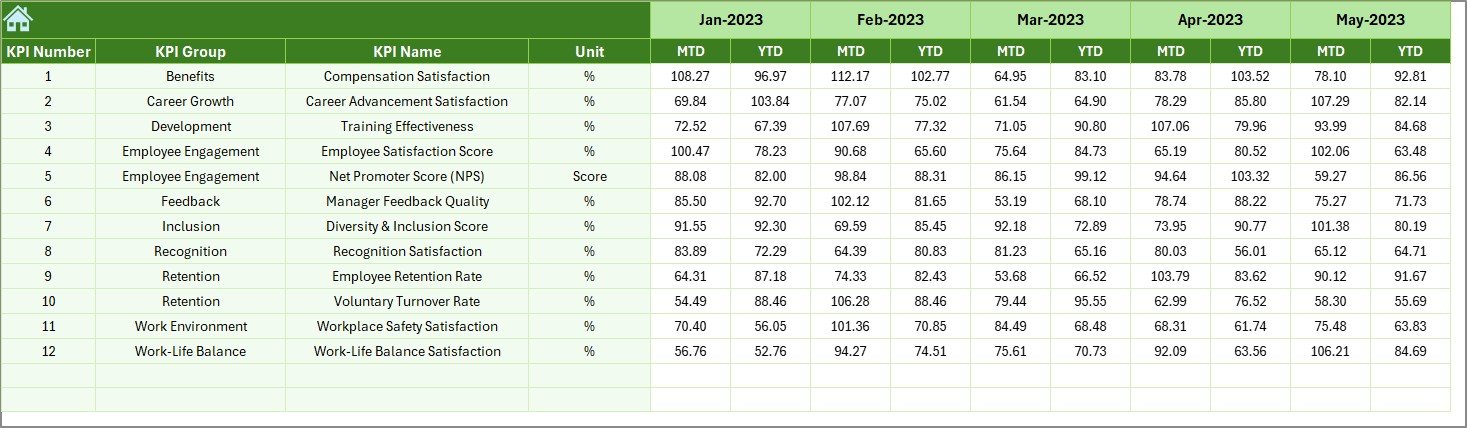
Historical context is critical. This sheet lets you enter last year’s data for each KPI, helping you evaluate year-over-year improvement or decline.
Comparing current results with previous achievements adds depth to your analysis.
KPI Definition Sheet – Know What You’re Measuring
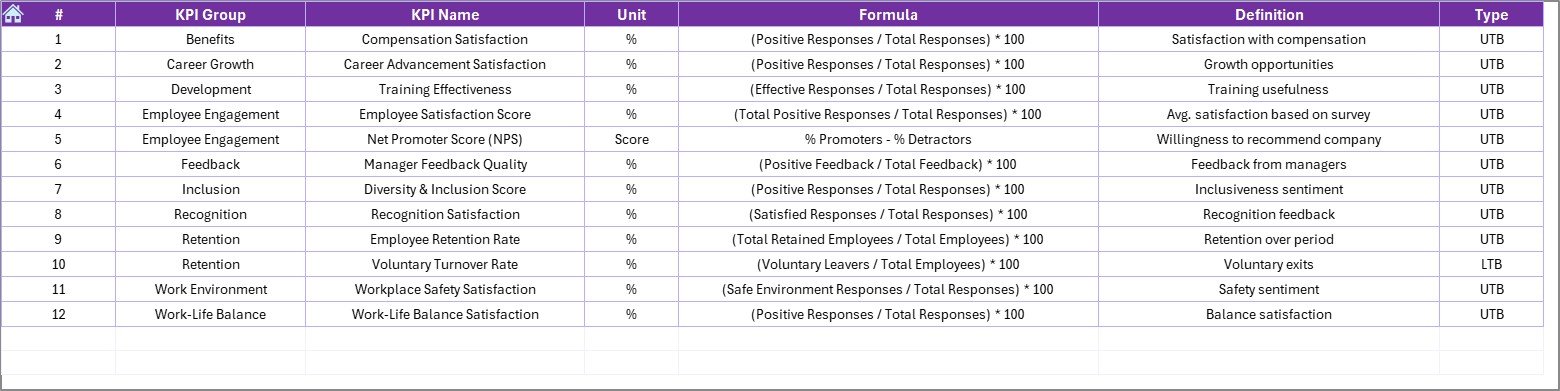
This sheet stores essential metadata:
-
KPI Name
-
KPI Group
-
Unit of Measurement
-
Calculation Formula
-
Short Definition
-
Type (UTB or LTB)
This ensures consistency in KPI reporting and makes onboarding easier for new users of the dashboard.
Advantages of the Project Management Employee Satisfaction KPI Dashboard
Let’s explore how this dashboard can transform your employee management and project delivery.
✅ Improved Employee Engagement
Employees feel heard when their feedback and productivity are tracked meaningfully. A transparent dashboard boosts motivation.
✅ Real-Time Decision-Making
No more guessing. Use real-time data to make confident decisions and adjust strategies on the fly.
✅ Better Project Outcomes
Satisfied employees are more productive, creative, and committed. That’s a win for any project.
✅ Easy Data Input and Customization
With structured input sheets and flexible month selection, updating the dashboard is hassle-free—even for non-technical users.
✅ Seamless Integration with Existing Processes
Since it’s Excel-based, you don’t need any new tools. It works with what your team already uses.
Best Practices for Using the Employee Satisfaction KPI Dashboard
To get the most out of this dashboard, follow these proven best practices:
1. Update Data Monthly
Keep the data current by updating the Actual Numbers Input sheet every month. This keeps your insights relevant and actionable.
2. Set Realistic Targets
Use historical data to set achievable MTD and YTD goals. Avoid unrealistic benchmarks that demotivate employees.
3. Involve Team Leaders
Get input from team leads when setting KPIs. This ensures that the metrics align with actual work dynamics.
4. Review Trends, Not Just Snapshots
Don’t rely solely on one month’s data. Look at trends using the KPI Trend sheet to identify patterns over time.
5. Keep KPI Definitions Simple
Ensure the KPI definitions are clear and easy to understand for everyone involved.
6. Use Conditional Formatting Wisely
Highlight changes and trends using visual cues like arrows, colors, or icons—but don’t overdo it. Keep it clean and focused.
Which KPIs Should You Track in the Dashboard?
While you can customize KPIs to suit your project, here are some employee satisfaction KPIs commonly used:
-
Employee Satisfaction Index – % score from internal surveys
-
Training Hours per Employee – Total training hours by employee
-
Absenteeism Rate – % of days missed vs total working days
-
Performance Score – Composite metric from performance evaluations
-
Attrition Rate – % of employees leaving the team/project
-
Employee Net Promoter Score (eNPS) – Willingness to recommend company
-
Internal Promotion Rate – % of employees promoted internally
-
Feedback Response Time – Avg. time to respond to employee feedback
-
Team Collaboration Score – Survey-based measure of teamwork
-
Onboarding Satisfaction – New hire satisfaction post onboarding
-
Employee Grievance Closure Rate – % of resolved issues
-
Work-Life Balance Rating – Self-reported balance rating
These KPIs offer a complete view of what drives team satisfaction within a project environment.
Why Excel Is the Best Tool for This Dashboard
You might wonder: Why not use Power BI or other advanced tools? Well, here’s why Excel is still a top choice:
-
Most organizations already use it
-
No additional software costs
-
Easy to customize and extend
-
Lightweight and fast for moderate datasets
-
Ideal for small to medium project teams
-
Can be used offline
Even in the age of cloud tools, Excel remains an unbeatable option for flexibility and accessibility.
How to Customize the Dashboard for Your Needs
One of the best parts of this template is its flexibility. Here are a few things you can modify:
-
Add new KPIs by updating the KPI Definition Sheet
-
Change the Year Start from cell E1 in the Actual Numbers Input Sheet
-
Alter the drop-down options for KPI selection or monthly view
-
Apply your color theme using Excel’s formatting tools
-
Add more slicers or filters to narrow down performance by team, department, or project phase
Whether you manage a tech project or a marketing initiative, you can tailor the dashboard to your environment easily.
Conclusion: Empower Your Projects with Smarter People Analytics
In today’s competitive environment, employee satisfaction isn’t just an HR metric—it’s a strategic driver for successful project delivery. A well-designed KPI dashboard not only empowers project managers to take better decisions but also builds a culture of accountability and transparency.
Using this Project Management Employee Satisfaction KPI Dashboard in Excel, you’ll stay ahead of issues, foster a productive team environment, and deliver better results. Plus, you’ll save time by automating the entire tracking process with one simple, powerful tool.
❓ Frequently Asked Questions (FAQs)
Q1. Can I use this dashboard for multiple projects at once?
Yes, you can duplicate the template and rename each workbook for different projects. You can also add a “Project Name” field to the KPI Definition or Input Sheets.
Q2. Do I need advanced Excel skills to use this dashboard?
No, basic Excel knowledge is enough. We’ve designed the dashboard with easy navigation, drop-downs, and clear input areas.
Q3. How often should I update the data?
We recommend updating the Actual Numbers monthly and reviewing the trend sheet regularly for ongoing insights.
Q4. Can I add more KPIs to the dashboard?
Absolutely! Just update the KPI Definition Sheet and add corresponding rows in the other input sheets.
Q5. Is this dashboard suitable for small teams?
Yes, it’s ideal for small and mid-sized teams. If your team grows, you can scale the dashboard by adding more filters and team-level KPIs.
Q6. Can this dashboard be shared with others?
Yes, you can share the Excel file via email, OneDrive, or SharePoint. Make sure to lock input sheets if you want to restrict editing access.
Visit our YouTube channel to learn step-by-step video tutorials