Tracking growth in project management is no longer a luxury—it’s a necessity. That’s where a Project Management Growth Metrics KPI Dashboard in Excel comes into play. This powerful tool helps project managers, business analysts, and stakeholders monitor key growth metrics and make timely, data-driven decisions. If you want to track performance, set realistic targets, and compare actual vs previous results all in one place, this dashboard is your go-to solution.
Let’s dive into the features, advantages, best practices, and everything else you need to know.
Click to Purchases Project Management Growth Metrics KPI Dashboard in Excel
What Is a Project Management Growth Metrics KPI Dashboard?
A KPI (Key Performance Indicator) Dashboard is a dynamic visual representation of critical project metrics. Specifically, this Excel-based dashboard focuses on growth-related KPIs within project management. From tracking monthly progress to analyzing year-over-year performance, this dashboard gives you a complete picture of your project’s success.
Overview of the Dashboard Worksheets
This dashboard template comes with 7 fully functional and interconnected worksheets. Here’s what each sheet offers:
Home Sheet

-
Works as an index page
-
Includes 6 buttons that take you directly to each key sheet
-
Provides easy navigation to keep your workflow smooth
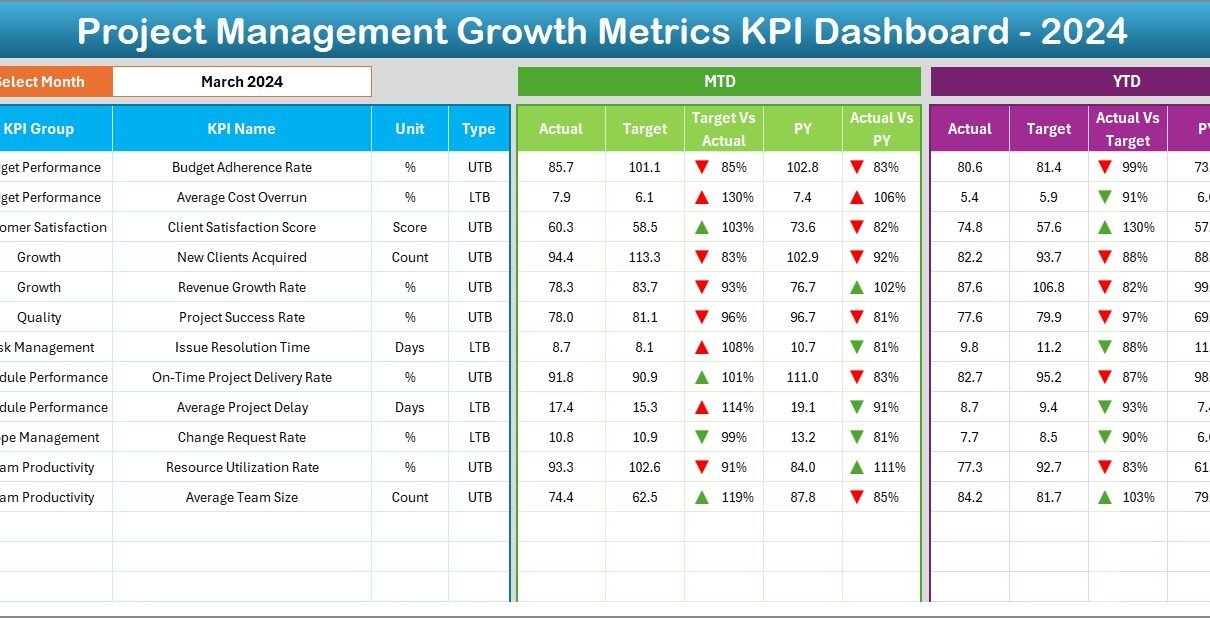
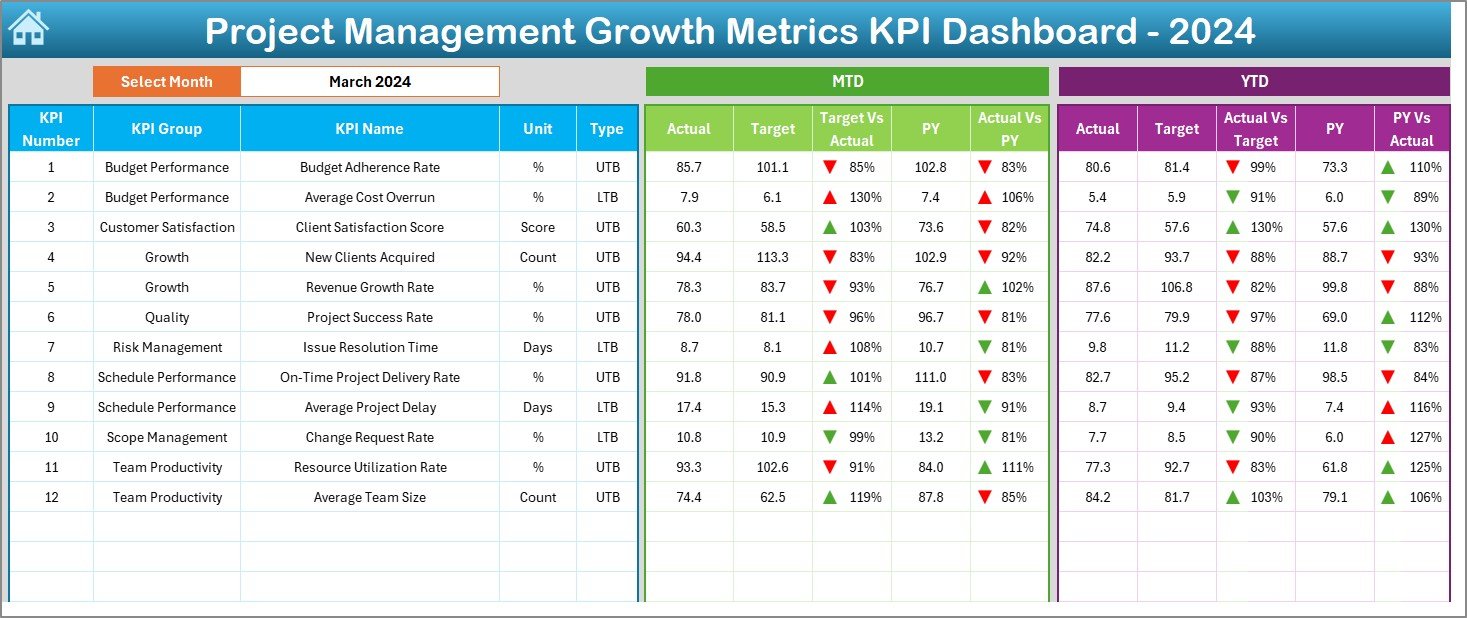
Dashboard Sheet
-
This is the main visual interface
-
Select the desired month from a dropdown in cell D3
-
Instantly updates all metrics including:
- MTD (Month-to-Date) Actual, Target, and Previous Year
- YTD (Year-to-Date) Actual, Target, and Previous Year
- Conditional formatting with up/down arrows for quick insights
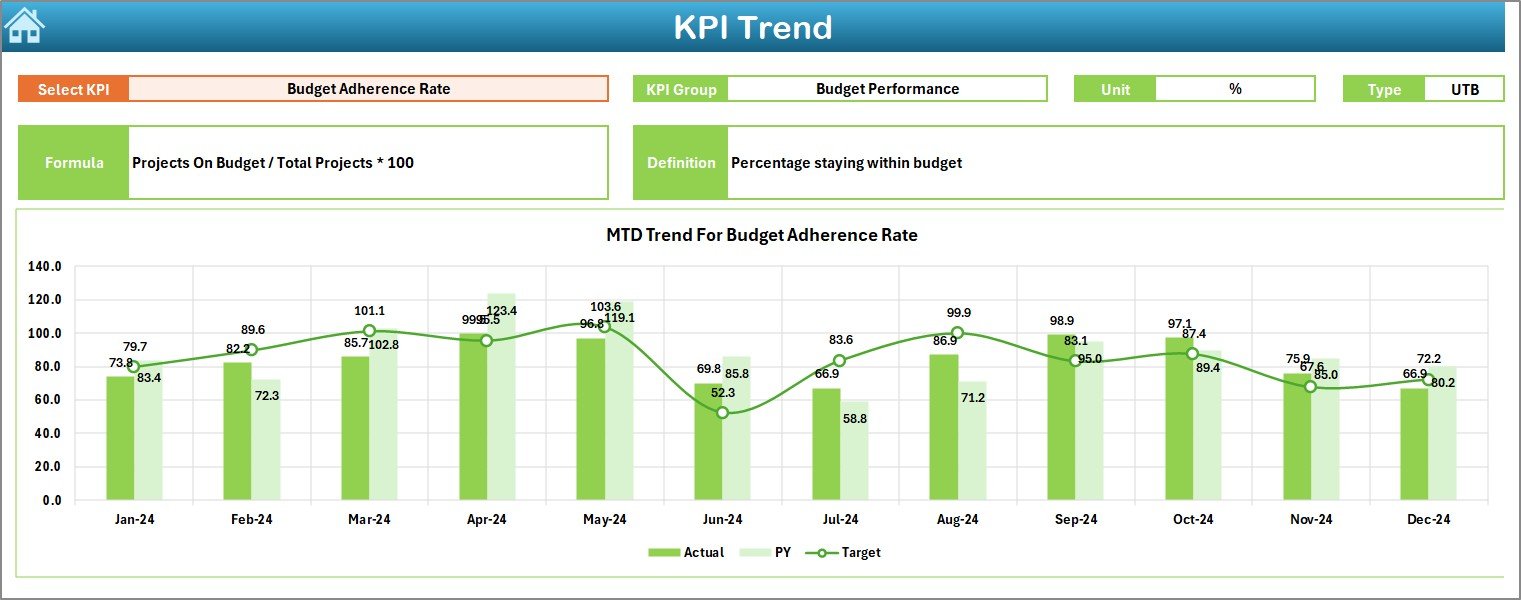
KPI Trend Sheet
-
Choose your KPI from the dropdown in cell C3
Shows:
- KPI Group
- Unit of Measurement
- KPI Type (UTB – Upper the Better / LTB – Lower the Better)
- Formula and Definition
-
Includes trend charts for MTD and YTD comparisons
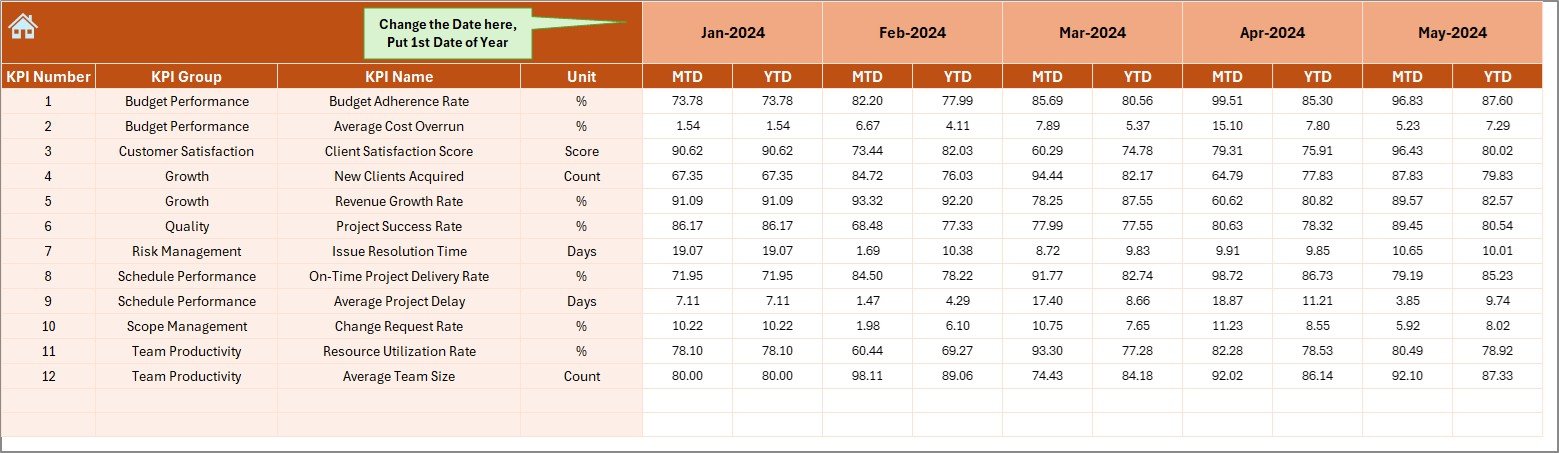
Actual Numbers Input Sheet
-
Input actual data for MTD and YTD values
-
Change the starting month using cell E1
-
Auto-updates the dashboard when new data is entered
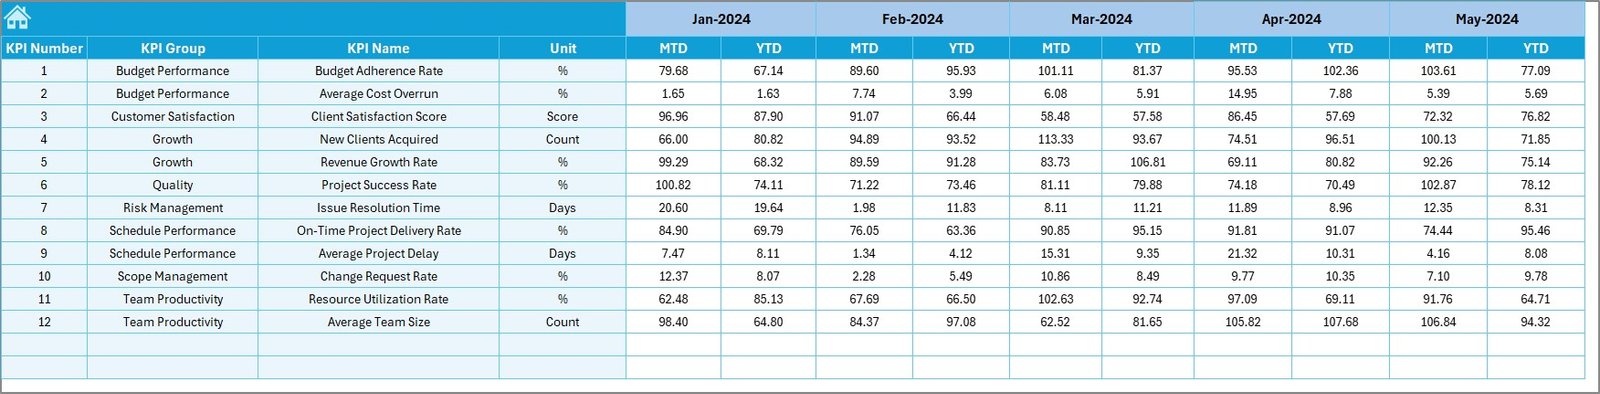
Target Sheet
-
Input monthly and yearly targets for each KPI
-
Ensures you’re measuring actual performance against realistic benchmarks
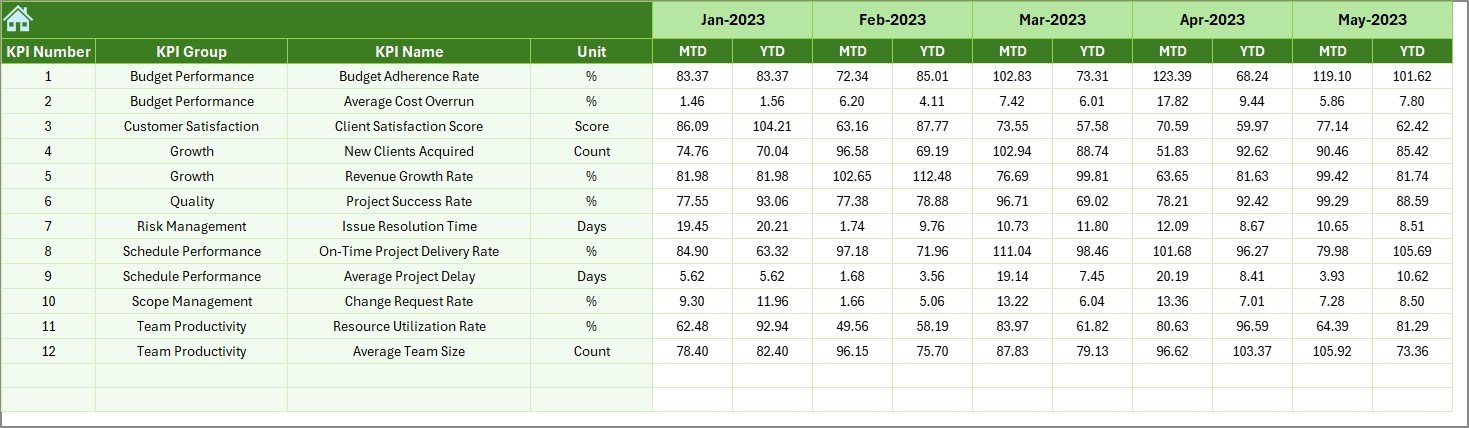
Previous Year Numbers Sheet
-
Input last year’s data for accurate year-over-year comparison
Click to Purchases Project Management Growth Metrics KPI Dashboard in Excel
KPI Definition Sheet
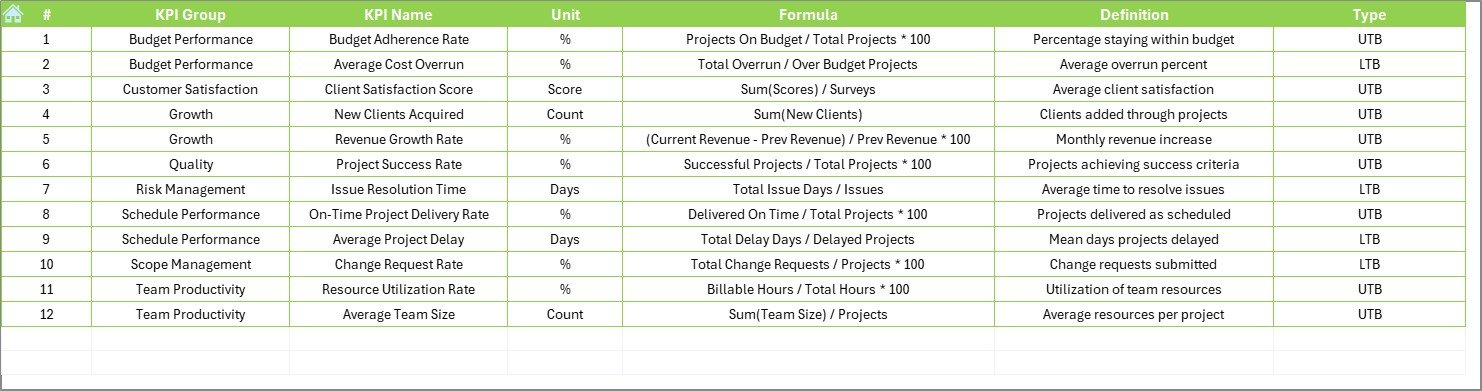
Document all KPIs with:
- Name
- Group
- Unit
- Formula
- Clear definition
Advantages of the Project Management Growth Metrics KPI Dashboard
📈 Clear Visibility of Project Performance
Easily track how well your project is progressing month over month and year over year.
⏱️ Real-Time Insights
Instantly updates when you change data or select a new month—no need to refresh or recalculate.
📊 Visual Comparison Tools
Use conditional formatting, trend charts, and arrow indicators to compare Actual vs Target and Actual vs Previous Year.
🧩 Easy Customization
You can add, remove, or modify KPIs as your project evolves.
🤝 Stakeholder Communication
Provides a professional, polished report that’s easy for stakeholders to understand.
Best Practices for Using This KPI Dashboard
To get the most out of this tool, follow these best practices:
1. Keep KPI Definitions Clear and Simple
Use the KPI Definition Sheet to define all your KPIs so that everyone understands what’s being measured.
2. Update Data Consistently
Input MTD, YTD, Target, and Previous Year data each month to ensure your dashboard stays relevant and accurate.
3. Choose Actionable KPIs
Focus on KPIs that reflect growth, like:
-
Project completion rate
-
Budget variance
-
On-time delivery rate
-
Resource utilization
4. Use the Trend Sheet Regularly
Analyzing trends helps you detect early signs of growth or bottlenecks.
5. Review with Your Team
Use this dashboard as part of your monthly or quarterly reviews to align the team’s focus and action plan.
Why Choose Excel for Project KPI Tracking?
Excel remains one of the most accessible and flexible platforms for KPI dashboards. Here’s why:
-
No expensive software needed
-
Works offline
-
Supports formulas, charts, drop-downs, and conditional formatting
-
Highly customizable for any team size or industry
Conclusion
The Project Management Growth Metrics KPI Dashboard in Excel simplifies performance tracking and helps your team stay aligned on growth goals. With clear visuals, trend analysis, and actionable KPIs, this dashboard is a must-have for any project-focused organization.
❓ Frequently Asked Questions (FAQs)
1. Can I customize the KPIs in the dashboard?
Yes, you can easily add or edit KPIs in the KPI Definition Sheet and all linked sheets will auto-adjust accordingly.
2. Is Excel good enough for serious project tracking?
Absolutely. With the right structure, Excel can handle complex calculations, interactive charts, and even automation using formulas and VBA.
3. Can this dashboard be used for multiple projects?
Yes. You can duplicate the workbook or use separate sheets for each project while maintaining a unified structure.
4. Do I need advanced Excel skills to use it?
Not at all. Basic knowledge of Excel navigation, data entry, and dropdown selections is enough.
5. How often should I update the data?
Ideally, update it monthly for MTD and YTD numbers. This ensures your insights are always up to date.
Visit our YouTube channel to learn step-by-step video tutorials