Tracking stakeholder-focused KPIs is vital for any project’s success. Without the right tools, project managers can easily miss red flags, delay communication, and fall short on expectations. That’s where the Project Management Stakeholder Reporting KPI Dashboard in Excel comes in — a smart and ready-to-use solution that simplifies reporting and enhances decision-making.
In this comprehensive article, we’ll explore everything you need to know about this dashboard — including its structure, benefits, best practices, and frequently asked questions.
What Is a Project Management Stakeholder Reporting KPI Dashboard in Excel?
A Project Management Stakeholder Reporting KPI Dashboard is a dynamic Excel-based tool designed to capture and present key performance indicators (KPIs) related to stakeholder communication, project progress, and overall engagement effectiveness. This dashboard helps project teams:
Click to Purchases Project Management Stakeholder Reporting KPI Dashboard in Excel
-
Monitor progress across stakeholder-facing KPIs
-
Report performance updates in real time
-
Ensure transparency and accountability in project communications
Because it’s built in Excel, it’s easy to customize, user-friendly, and doesn’t require complex software installations.
Why Is Stakeholder Reporting Important in Project Management?
Stakeholders influence the project’s direction, scope, and outcomes. Timely updates, performance metrics, and engagement scores ensure they remain informed and aligned. By using a stakeholder-focused KPI dashboard, you:
-
Build trust through transparent communication
-
Prevent misunderstandings and scope creep
-
Provide data-driven status updates
-
Strengthen decision-making through real-time insights
That’s why stakeholder reporting isn’t just a formality — it’s a strategic necessity.
What’s Included in This Excel-Based KPI Dashboard?
This ready-to-use Excel template consists of seven well-structured worksheet tabs, each playing a specific role in tracking and reporting KPIs. Let’s explore them in detail:
Home Sheet – Your Navigation Hub
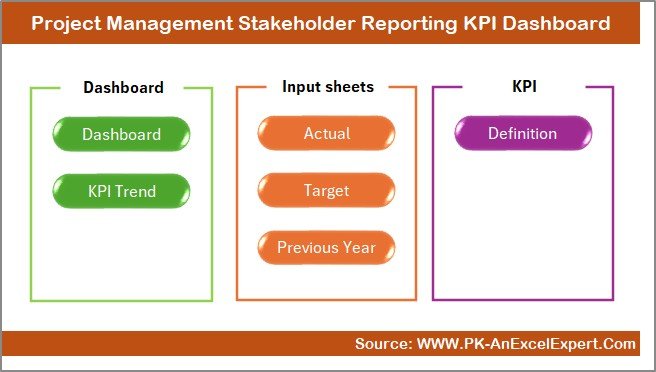
The Home sheet acts as your dashboard’s control panel. It features 6 clickable buttons that help users quickly navigate to different worksheet tabs. This ensures users — especially stakeholders — can access any report without fumbling through tabs.
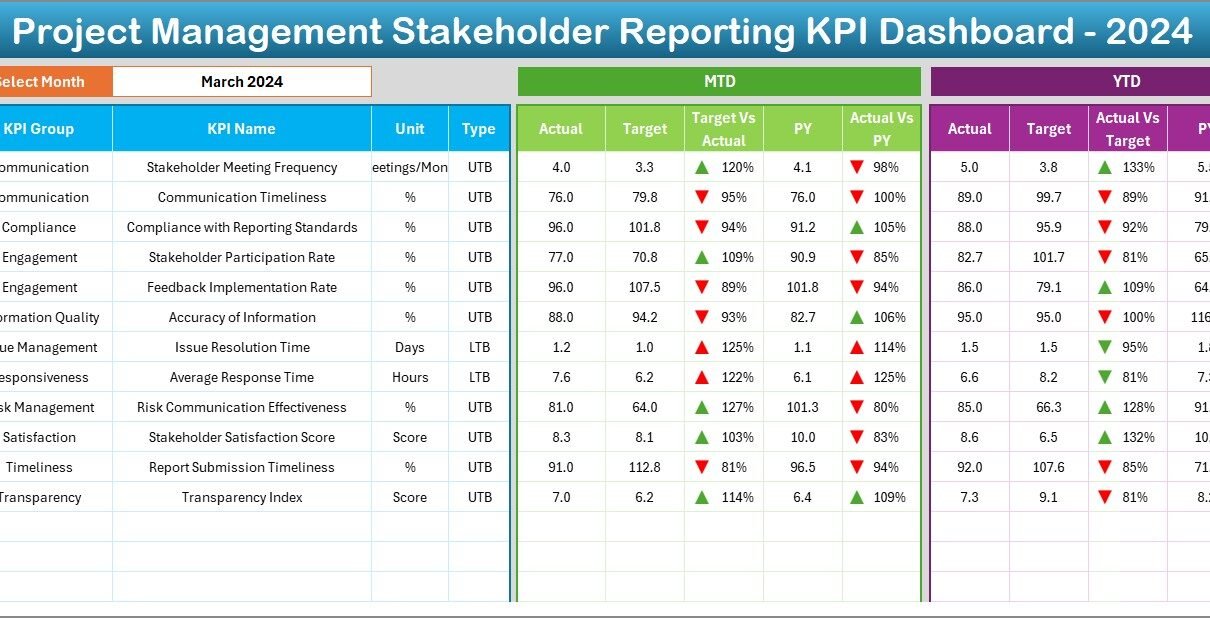
Dashboard Sheet – Real-Time KPI Insights
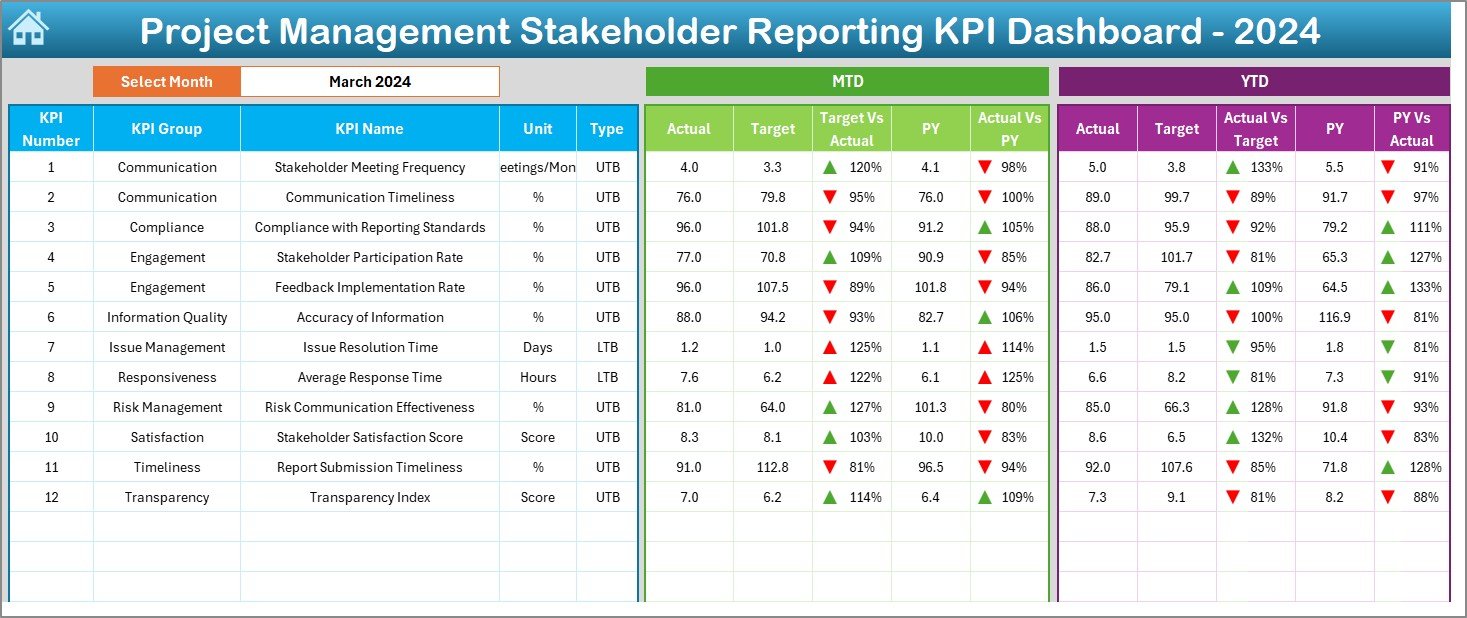
This is the main visual dashboard. Here’s what you’ll find:
-
A dropdown in cell D3 to select the reporting month
-
Automatically updating numbers based on the selected month
Key metrics including:
- MTD (Month-to-Date): Actual, Target, and Previous Year
- YTD (Year-to-Date): Actual, Target, and Previous Year
-
Conditional formatting with arrows to show whether performance is up or down
This setup makes performance review intuitive and actionable at a glance.
KPI Trend Sheet – Visualize Performance Over Time
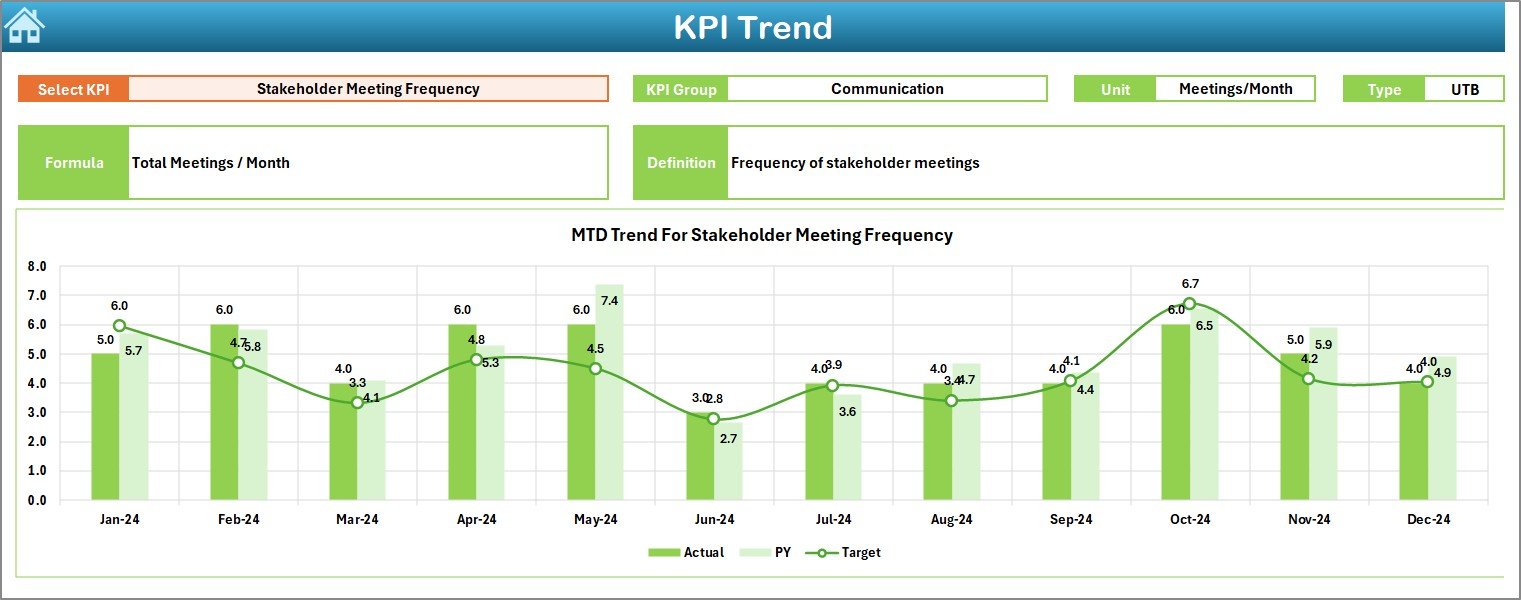
Stakeholders love trends — this sheet is designed exactly for that:
-
Dropdown in cell C3 to select any KPI
Displays:
- KPI Group
- Unit of measurement
- KPI Type (Lower the Better or Upper the Better)
- KPI Formula and short Definition
-
MTD and YTD trend charts for Actual, Target, and Previous Year
This lets users track patterns, detect anomalies, and understand performance over time.
Actual Numbers Input Sheet – Input Made Easy
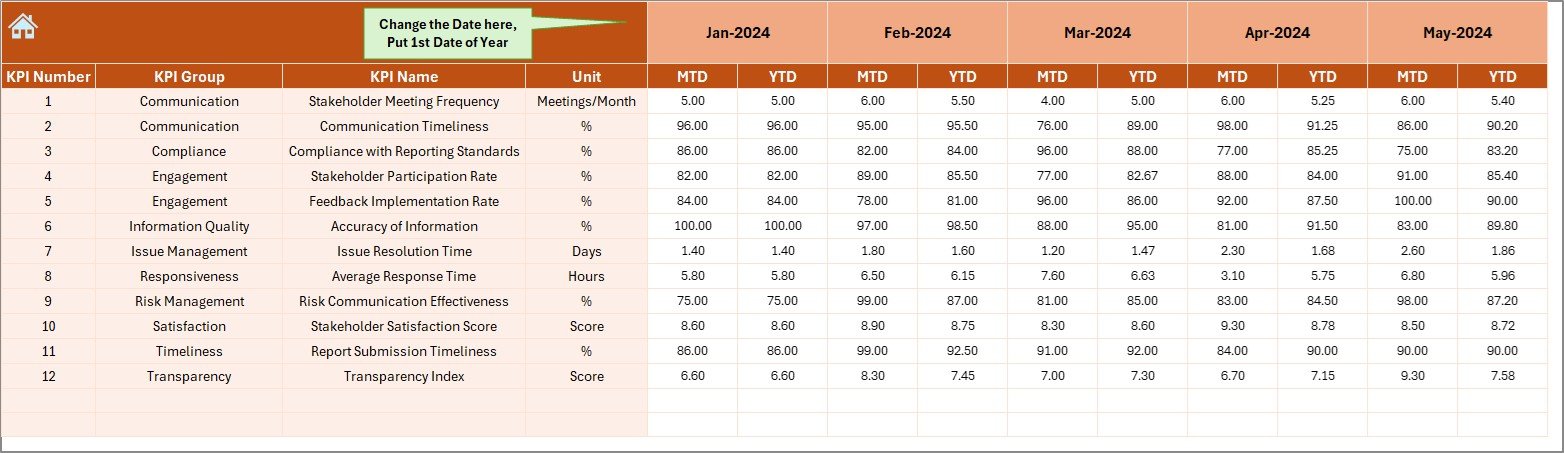
This is where users enter the actual performance data:
-
MTD and YTD values for each KPI
-
Month selector in cell E1 to align reporting period
-
Easy data entry makes it quick to maintain
Accurate inputs ensure the dashboard reflects the real picture — and drives meaningful conversations.
Target Sheet – Define What Success Looks Like
Click to Purchases Project Management Stakeholder Reporting KPI Dashboard in Excel

Here, you enter target numbers for each KPI:
-
MTD and YTD targets by month
-
Used to compare against actual values on the dashboard
-
Helps project managers and stakeholders stay aligned on performance goals
This enables objective performance evaluation.
Previous Year Numbers Sheet – Historical Comparison

Use this sheet to store past year’s data:
-
Same format as Actual and Target inputs
-
Makes year-over-year comparisons simple
-
Adds historical context to current performance
Looking back helps stakeholders understand long-term progress.
KPI Definition Sheet – Your KPI Reference Library
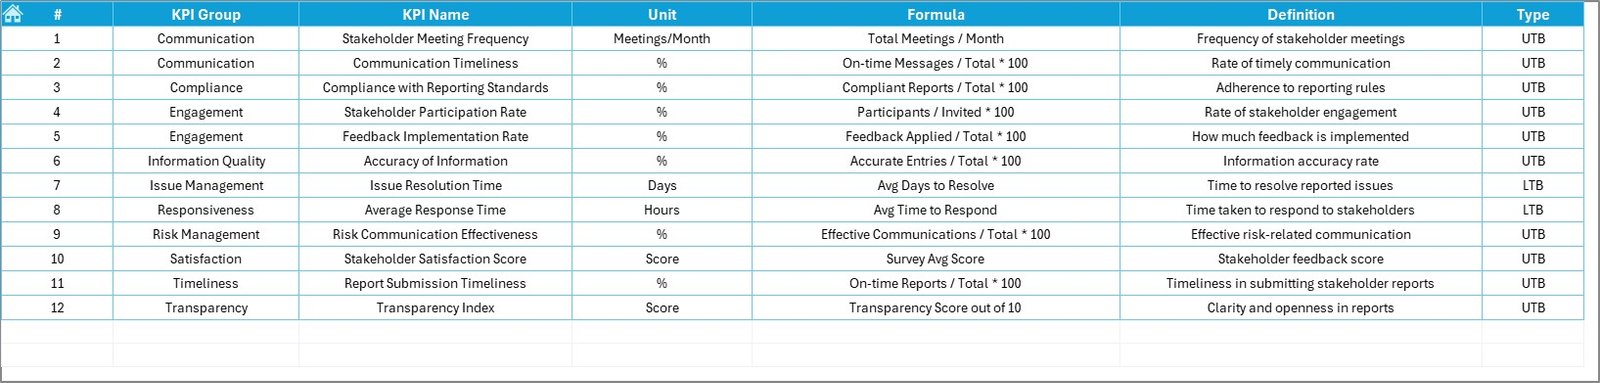
Finally, this sheet serves as a KPI documentation center:
-
Includes columns for KPI Name, Group, Unit, Formula, and Definition
-
Ensures transparency in how each metric is calculated
-
Makes onboarding easier for new stakeholders
Everyone stays on the same page — which is crucial in collaborative environments.
Advantages of Using This Stakeholder Reporting KPI Dashboard
✅ Easy to Use
No complex software or formulas — just a well-organized Excel template anyone can use.
✅ Customizable
Modify KPIs, change formulas, or update visuals based on project requirements.
✅ Real-Time Reporting
With dropdown-based month selection, reports refresh instantly.
✅ Improved Stakeholder Communication
Visual dashboards make it easier to share updates in meetings or via email.
✅ Data-Driven Decision Making
Combines actual, target, and historical numbers to support better project decisions.
✅ Saves Time
You won’t need to create new reports every month — just update data, and the dashboard does the rest.
Best Practices for the Project Management Stakeholder KPI Dashboard
To make the most of this Excel-based solution, follow these best practices:
✅ Define KPIs Clearly from the Start
Ensure every KPI has a clear purpose, formula, and ownership. Use the KPI Definition tab to document each metric.
✅ Update Data Regularly
Input actuals and targets consistently — ideally on a weekly or monthly basis — to keep the dashboard relevant.
✅ Use Color Coding Effectively
Conditional formatting with arrows and color indicators helps stakeholders understand performance at a glance.
✅ Protect Sensitive Sheets
Lock or hide input sheets to prevent accidental data overwrites.
✅ Train Your Team
Walk your stakeholders through the dashboard to ensure they know how to use it effectively.
✅ Keep It Simple
Don’t overload with too many KPIs. Focus on 10–15 metrics that truly matter to your stakeholders.
How Can This Dashboard Improve Stakeholder Relationships?
Strong relationships are built on trust and clarity. Here’s how this dashboard strengthens both:
-
Transparency: Everyone sees the same data in one place
-
Clarity: KPI definitions remove ambiguity
-
Responsiveness: Performance trends help project teams react faster
-
Accountability: Targets vs actuals encourage ownership and follow-through
Whether you’re managing internal stakeholders, clients, or vendors, this dashboard turns data into meaningful conversations.
Use Cases Across Different Projects
This Excel-based KPI dashboard fits well in various industries and project types:
-
IT Projects: Monitor delivery timelines, bug resolution rates, stakeholder satisfaction scores
-
Construction Projects: Track cost variance, milestone completion, contractor responsiveness
-
Marketing Campaigns: Report on lead generation, engagement metrics, or client approvals
-
Consulting Engagements: Showcase billing utilization, deliverable status, and client feedback
Wherever stakeholders need updates, this tool delivers.
Conclusion
A Project Management Stakeholder Reporting KPI Dashboard in Excel offers more than just charts and tables — it empowers you to engage, align, and deliver better outcomes with your stakeholders. By using this powerful yet simple Excel template, you streamline reporting, clarify expectations, and ultimately drive project success.
If you want to stop wasting hours on manual reports and start making smarter decisions, this dashboard is your perfect starting point.
Frequently Asked Questions (FAQs)
Q1. What KPIs should be included in a stakeholder reporting dashboard?
Include KPIs that matter most to stakeholders like Milestone Completion Rate, Budget Adherence, Risk Mitigation Success, and Stakeholder Satisfaction Score.
Q2. How often should I update this dashboard?
Update it monthly to ensure the dashboard reflects accurate MTD and YTD performance. Weekly updates are even better for high-velocity projects.
Q3. Can I use this template for different projects?
Yes! The template is fully customizable. You can change KPI names, formulas, and data based on your specific project needs.
Q4. Do I need Excel expertise to use this?
Not at all. If you know basic Excel — like data entry and dropdowns — you can use this dashboard comfortably.
Q5. Is this dashboard suitable for client presentations?
Absolutely. The visual layout and trend charts make it perfect for stakeholder meetings, client updates, and executive reviews.
Q6. What if I want to track more than 12 KPIs?
You can expand the rows and charts as needed. Just ensure the formulas and charts are updated accordingly.
Visit our YouTube channel to learn step-by-step video tutorials
Click to Purchases Project Management Stakeholder Reporting KPI Dashboard in Excel
Watch the step-by-step video Demo: