DIY Craft Marketplaces Dashboard in Power BI is built for handmade sellers, craft marketplace founders, ecommerce analysts, and retail consultants who need a clear way to review marketplace performance. In craft businesses, small changes in fees, returns, category mix, and regional shipping behavior can change the real profit picture quickly. This Power BI template brings the important metrics into one editable PBIX report with 5 dashboard pages, 5 executive KPI cards, slicers, marketplace visuals, category analysis, regional trends, and order-status reporting.
You can open the file in Power BI Desktop, replace or connect your own marketplace data, refresh the report, and use the pages for sales review, pricing decisions, channel comparison, and monthly business reporting. For Power BI setup guidance, Microsoft also provides official documentation for getting started with Power BI Desktop.
DIY Craft Marketplaces Dashboard in Power BI
Key Features of DIY Craft Marketplaces Dashboard in Power BI
- Overview reporting: Track Total Orders, Total Revenue, Total Cost, Return Rate, and Net Profit in one executive page.
- Marketplace analysis: Compare channels by net profit, units sold, and profit margin.
- Category insights: Review which product categories produce revenue, cost, and unit movement.
- Regional trends: Understand orders, marketplace fees, revenue, and net profit by region.
- Order insights: Analyze customer type, monthly orders, and order status behavior.
- Interactive slicers: Filter the report quickly and review focused performance views.
- Editable PBIX file: Customize visuals, measures, colors, fields, and pages in Power BI Desktop.
Dashboard Pages Explanation
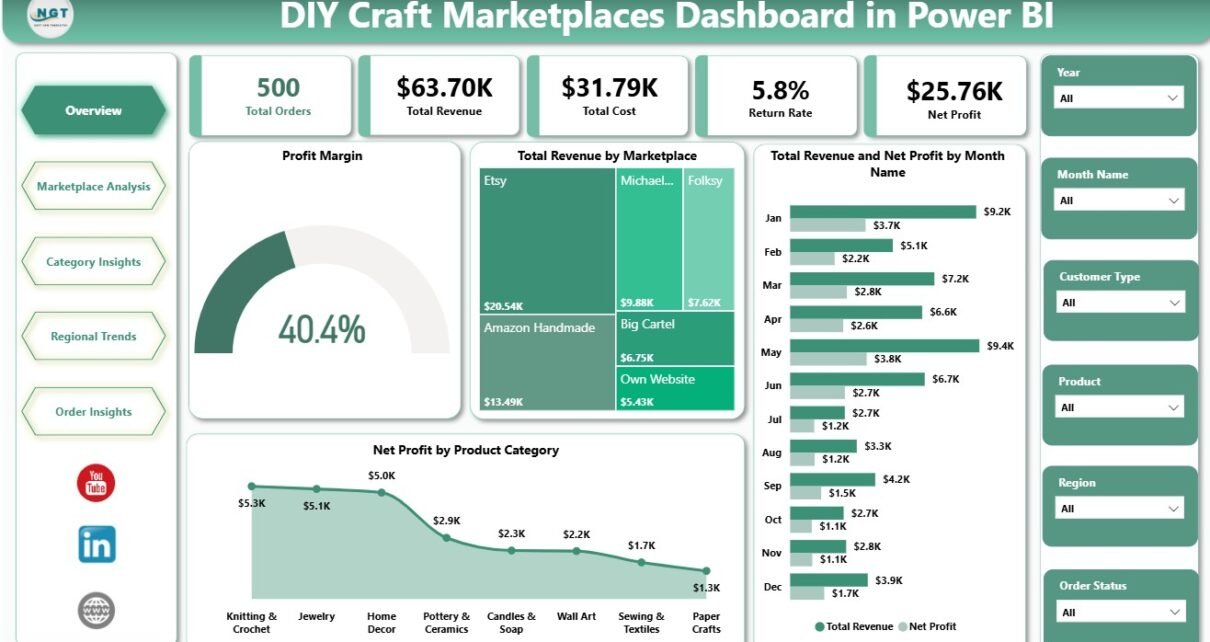
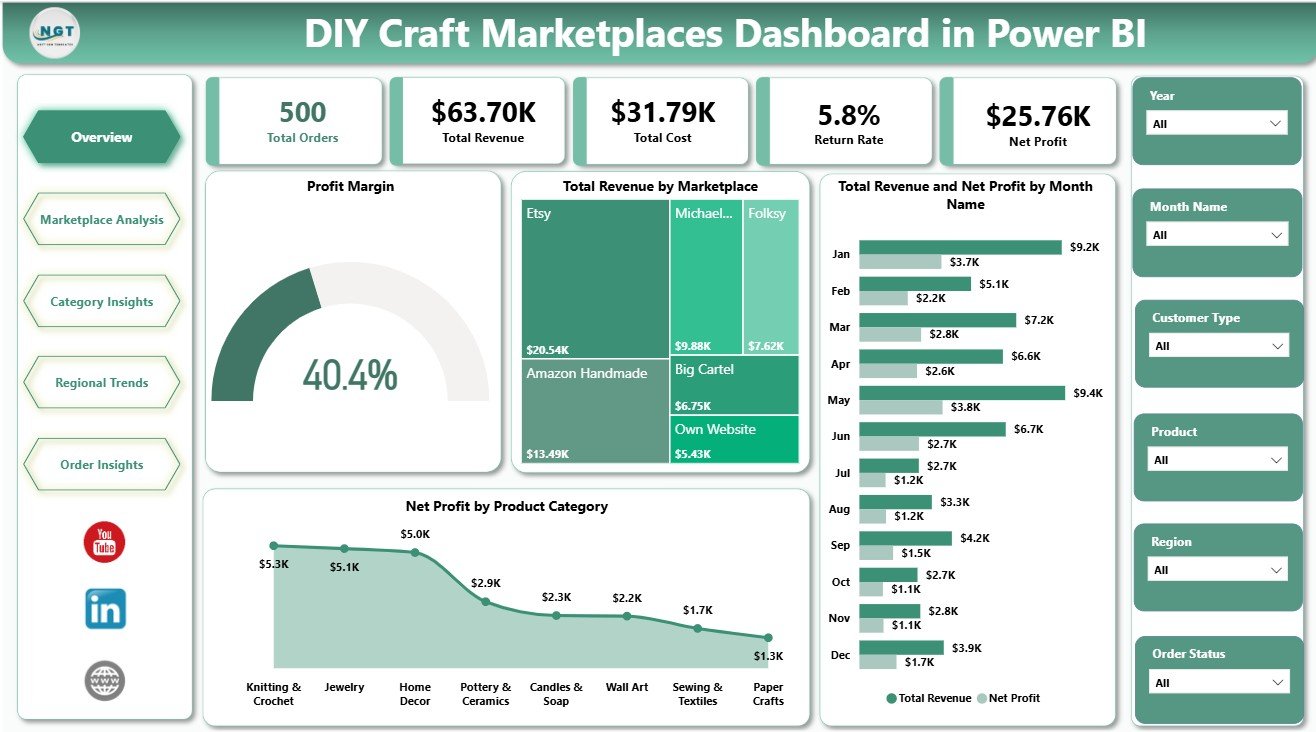
1. Overview Page
The Overview Page is the executive summary of the report. It shows Total Orders, Total Revenue, Total Cost, Return Rate, and Net Profit at the top so users can understand order volume, sales value, cost pressure, returns, and profitability before moving into detailed pages.
Profit Margin by Dashboard Filters changes with the active slicer selections, helping users see margin for a selected marketplace, region, category, or order segment. Total Revenue by Marketplace compares channel contribution, while Total Revenue and Net Profit by Month Name shows whether monthly sales growth is also producing real profit.
Net Profit by Product Category highlights which handmade product groups are adding the most value after costs. This is useful for production planning, seasonal product decisions, and promotion focus.
2. Marketplace Analysis
The Marketplace Analysis page compares selling channels using Net Profit by Marketplace, Total Units Sold by Marketplace, and Profit Margin by Marketplace. A craft seller can use this page to see whether a high-volume marketplace is also profitable, or whether fees and returns are reducing margin.
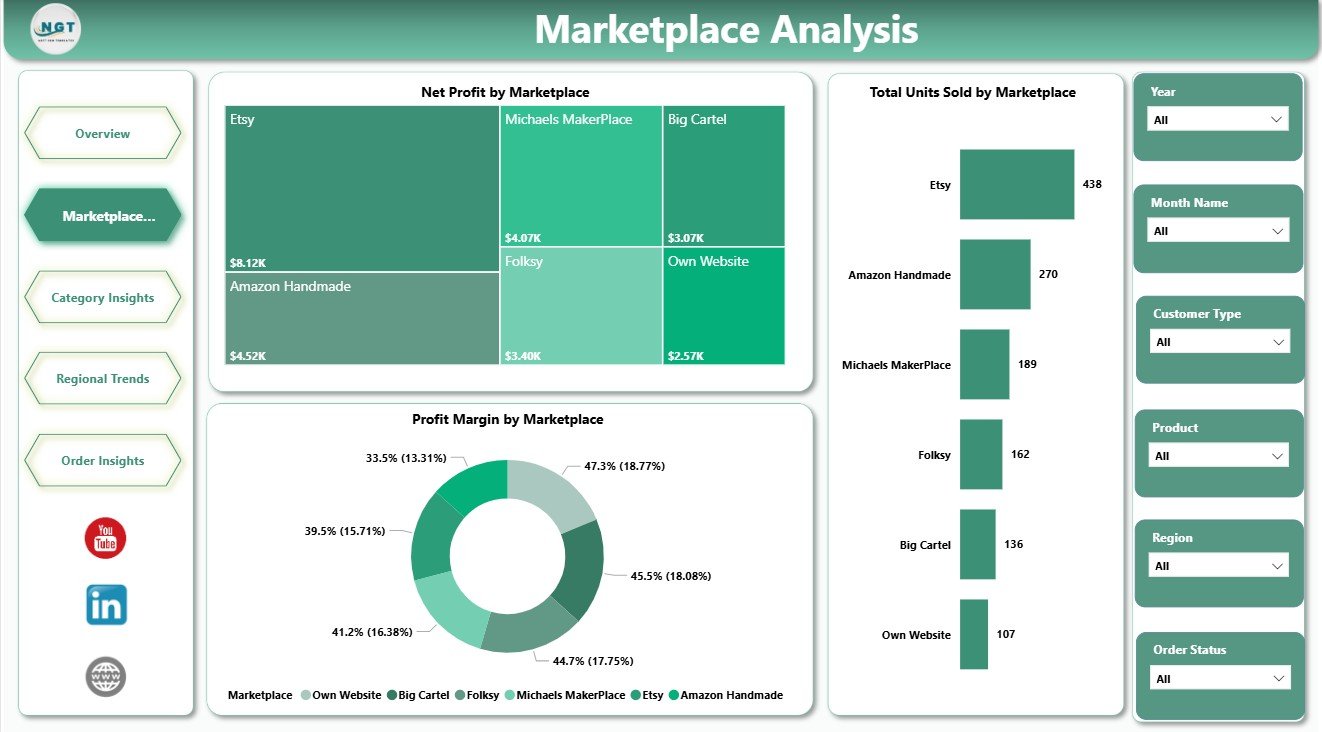
Marketplace Analysis
3. Category Insights
The Category Insights page reviews Total Units Sold by Product Category, Total Revenue by Product Category, and Total Revenue and Total Cost by Product Category. This is helpful when a seller offers jewelry, candles, printable goods, decor, accessories, or other handmade categories and wants to compare sales value against production or fulfillment cost.
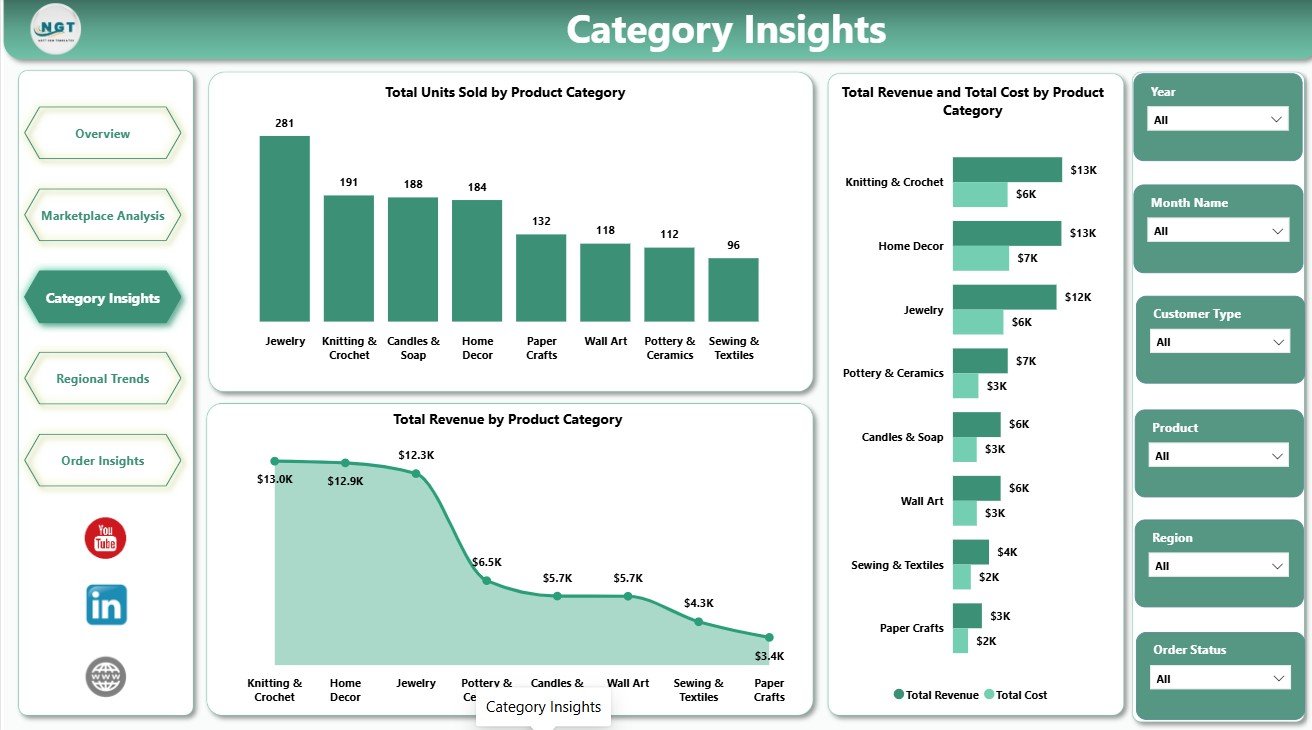
Category Insights
4. Regional Trends
The Regional Trends page focuses on geographic performance. Total Orders by Region shows demand concentration, Total Marketplace Fees by Region shows fee pressure, and Total Revenue and Net Profit by Region compares regional sales with actual profitability.
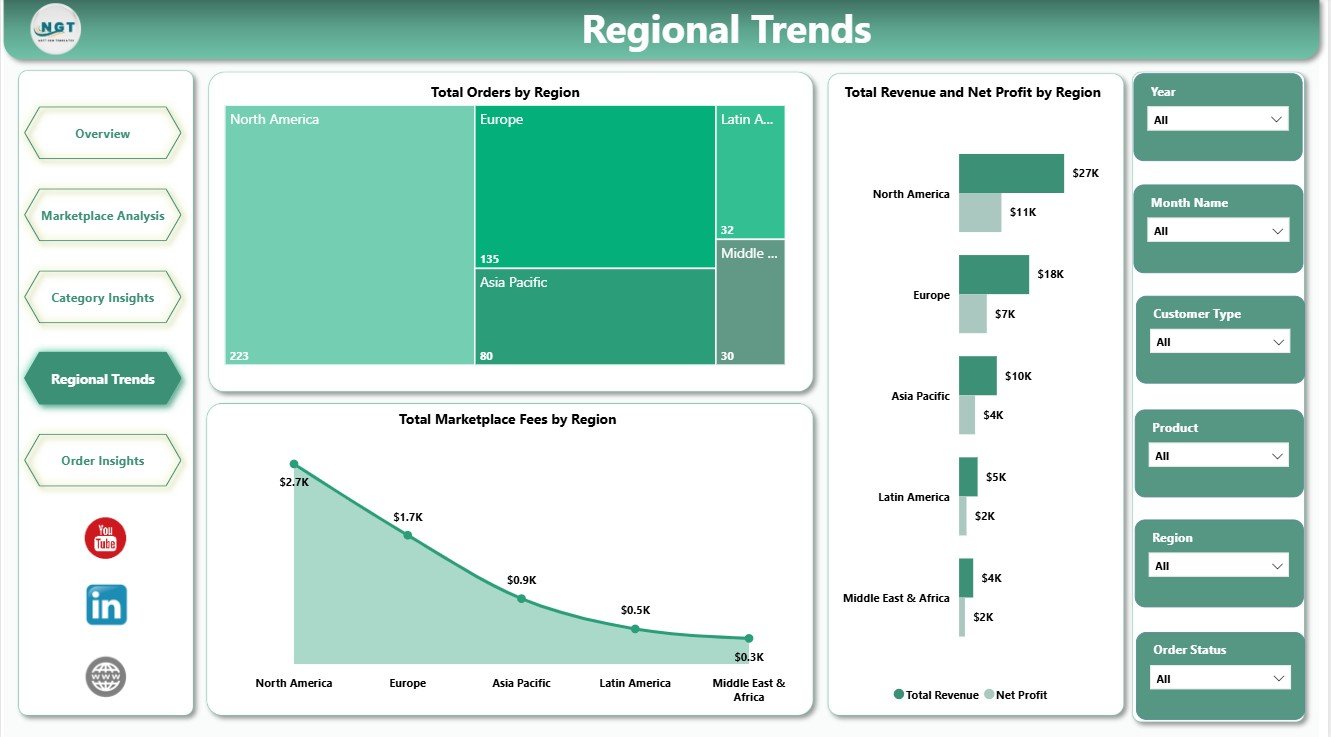
Regional Trends
5. Order Insights
The Order Insights page shows Total Revenue by Customer Type, Total Orders by Month Name, and Total Orders by Order Status. It helps users understand whether revenue is coming from new or repeat customers, how orders move month by month, and whether pending, returned, cancelled, or completed orders need attention.
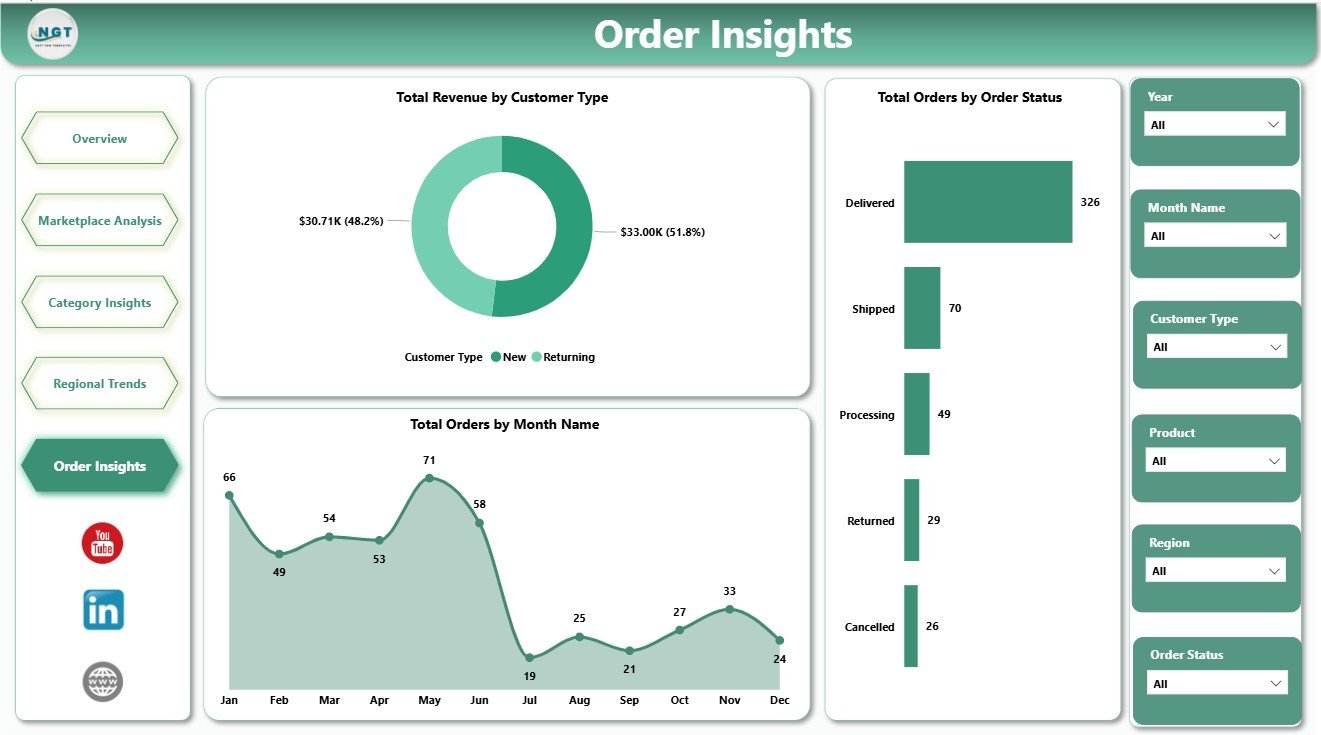
Order Insights
DIY Craft Marketplaces Dashboard in Power BI vs. Tableau vs. Paid Ecommerce SaaS – Feature Comparison
| Feature | This Power BI Template | Tableau Alternative | Paid Ecommerce SaaS |
|---|---|---|---|
| Cost | $17.99 one-time | Separate Tableau licensing | Monthly or annual subscription |
| Platform | Power BI Desktop and Power BI Service | Tableau Desktop or Cloud | Vendor cloud platform |
| Setup time | Open PBIX, connect data, refresh | Requires report build work | Requires onboarding and integration |
| Real-time team collaboration | Available after publishing with the right Microsoft licensing | Available with Tableau Cloud | Usually included by plan |
| Mobile access | Available through Power BI apps after publishing | Available through Tableau apps | Usually included |
| Customizable fields | Editable model, visuals, and measures | Editable if rebuilt in Tableau | Limited by vendor configuration |
| Share with link | Available through Power BI Service | Available after publishing | Usually available |
| Marketplace profit analysis | Included pages and visuals | Must be created manually | Depends on the SaaS plan |
| Year-1 cost at 5 users | $17.99 plus any Microsoft licensing you use | Often much higher licensing cost | Often hundreds or thousands of dollars |
Who Should Use This Template
This template is a good fit for handmade sellers, Etsy-style business owners, small ecommerce founders, marketplace analysts, retail consultants, product category managers, and Power BI learners. It is especially useful when the team wants to compare revenue, costs, profit, orders, regions, customer types, and order status without building every report page from scratch.
It is not the right fit for teams that need live API sync from marketplaces, automated bookkeeping, inventory replenishment, shipping label generation, or enterprise-level data governance already configured.
Real-World Use Cases
Maya, handmade jewelry seller: Maya reviews marketplace profit margin each month to decide where to promote her best-selling products.
Ravi, ecommerce analyst: Ravi uses Category Insights to compare revenue and cost by product category before recommending pricing changes.
Elena, marketplace consultant: Elena uses Regional Trends and Order Insights during client reporting calls to explain where fulfillment or return issues are affecting profit.
Advantages of DIY Craft Marketplaces Dashboard in Power BI
The main advantage is speed. The report pages, charts, and KPI cards are already structured, so users can focus on data preparation and business review. Power BI also makes it easier to customize measures, publish to a workspace, create filtered views, and reuse the same model for recurring reporting.
The template also encourages more complete marketplace analysis. Instead of looking only at revenue, users can review cost, returns, marketplace fees, regions, categories, customer type, order status, and net profit together.
Opportunities for Improvement
This is a template, not a live connector. Users still need to export, prepare, or connect their own marketplace data. Teams with many platforms may want to add extra fields, automate data refresh through Power Query, or connect the report to a central database later.
Best Practices
- Keep marketplace, region, product category, month, customer type, and order status values consistent.
- Validate cost, marketplace fee, and return fields before reviewing profit.
- Refresh the model after replacing the sample data.
- Save a clean backup before changing measures or relationships.
- Use slicers during review meetings to compare one channel or region at a time.
Explore Relevant Templates
You can download the product here: DIY Craft Marketplaces Dashboard in Power BI. You may also like DIY Craft Marketplaces Dashboard in Excel, Discount Stores Dashboard in Power BI, and the Power BI Dashboard Templates category.
Frequently Asked Questions
What does this dashboard track?
It tracks orders, revenue, cost, return rate, net profit, marketplace fees, marketplaces, product categories, regions, customer type, monthly orders, and order status.
Do I need advanced Power BI skills?
No. The pages and visuals are already built, but basic Power BI Desktop knowledge helps when replacing data sources or customizing fields.
Can I use this for Etsy or Amazon Handmade?
Yes, if you prepare or map your marketplace data to the report structure.
Can I customize the dashboard?
Yes. You can edit visuals, slicers, colors, measures, fields, and report pages in Power BI Desktop.
Is Power BI Desktop required?
Yes. The PBIX file opens in Power BI Desktop. Publishing and sharing may require Power BI Service licensing.
Is this a live connector?
No. It is a Power BI template. You need to connect or replace the sample data with your own data.
About the Author
Built by PK – Microsoft Certified Professional with 15+ years of Excel, Google Sheets, and Power BI experience. Founder of NextGenTemplates, reaching 300K+ subscribers across YouTube channels. Every template is hand-built and tested before release.
Conclusion
The DIY Craft Marketplaces Dashboard in Power BI gives craft sellers and marketplace analysts a practical way to review orders, revenue, cost, returns, marketplace fees, categories, regions, customer behavior, and net profit from one report. It is a strong starting point for teams that want Power BI marketplace reporting without beginning from a blank canvas.
For more Excel and Power BI tutorials, visit PK An Excel Expert on YouTube.