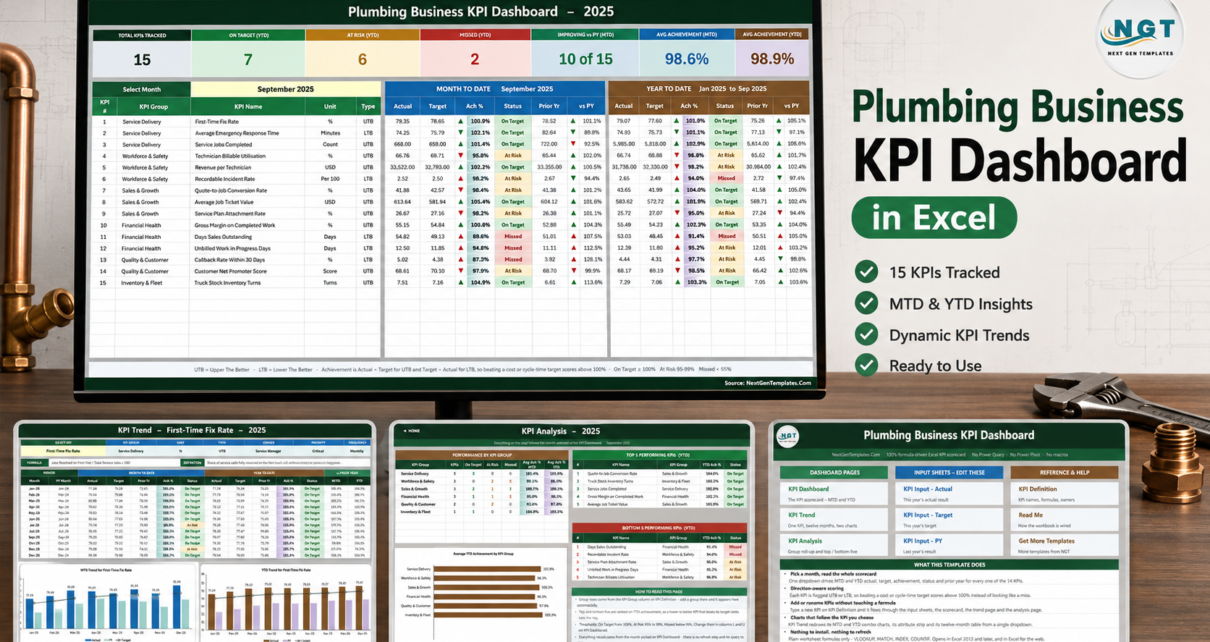
Most plumbing companies measure exactly two things: revenue and whether the phone rang. The Plumbing Business KPI Dashboard in Excel replaces that with 15 KPIs across 6 groups on a single scorecard – first-time fix rate, emergency response time, technician billable utilisation, quote-to-job conversion, gross margin, days sales outstanding, callback rate and eight more – each carrying MTD and YTD actual, target, achievement percentage, traffic-light status and a prior-year comparison. Pick a month from one dropdown and all 11 worksheets follow it.
The whole workbook is plain worksheet formulas – VLOOKUP, MATCH, INDEX, COUNTIF. There is no Power Query, no data model, no macro and no add-in, so the file is an ordinary .xlsx that opens in Excel 2013 and later and in Excel for the web (Microsoft’s own Excel help and learning hub covers both), with nothing to enable and nothing to refresh. A full 2025 sample year is already loaded so the dashboard is populated the moment it opens.
Key Features of the Plumbing Business KPI Dashboard in Excel
One dropdown drives the whole scorecard
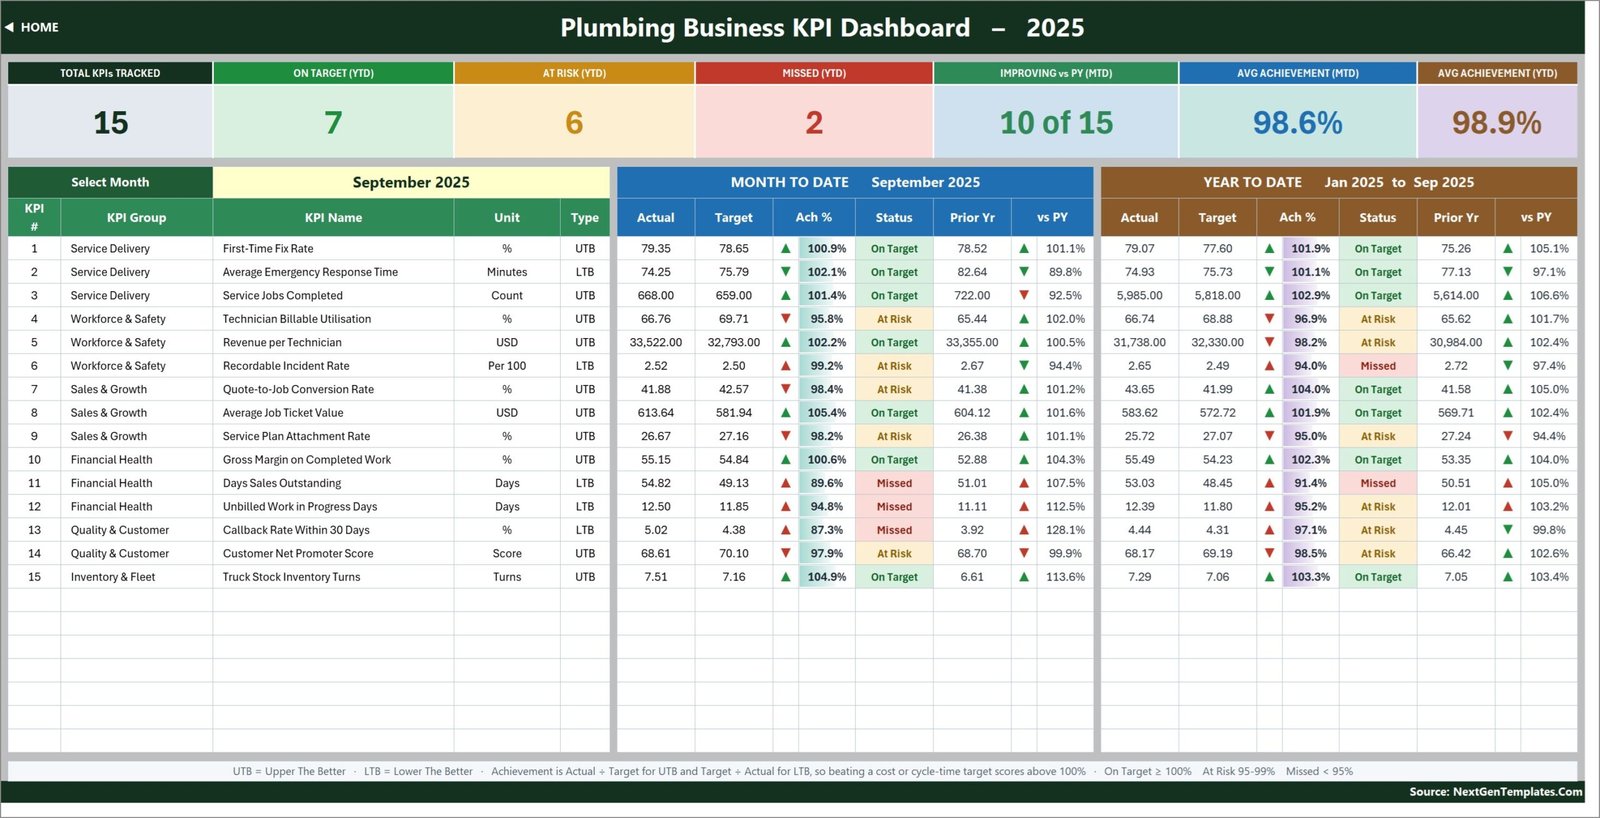
Cell D6 on KPI Dashboard lists the twelve months of the reporting year. Change it and the seven summary cards, all 15 KPI rows and the entire KPI Analysis page recalculate. There is no refresh step and no query to run.
Direction-aware achievement scoring
Every KPI is flagged UTB (Upper The Better) or LTB (Lower The Better) in column G of KPI Definition. Achievement is Actual / Target for UTB and Target / Actual for LTB. That single rule is why Average Emergency Response Time at 74.25 minutes against a 75.79-minute target scores 102.1% rather than looking like a 98% shortfall – beating a cycle-time target is a win, and the workbook scores it as one.
Traffic lights you can re-tune
On Target from 100%, At Risk 95-99%, Missed below 95%. The thresholds live in ordinary formulas in columns L and U of KPI Dashboard. If your board calls 98% acceptable, change the number – you are not arguing with a locked measure.
Movement arrows that know the direction of good
The arrow shows the raw direction against the comparator; its colour shows whether that direction is good for that KPI. A falling callback rate therefore shows a green down-arrow, and a falling first-time fix rate shows a red one.
Add KPIs by typing, not by editing formulas
The sheets are wired for 22 KPI rows and 15 are filled. Type a sixteenth on KPI Definition – number, group, name, unit, formula, definition, type, owner, priority, frequency – and it appears immediately on all three input sheets, the scorecard, the trend page and the analysis page.
Dashboard Pages Explanation
Home
A navigation page with three tile columns: the dashboard pages, the three input sheets you edit, and the reference pages. Every tile is a hyperlink, and every other sheet carries a HOME button back to it.
KPI Dashboard
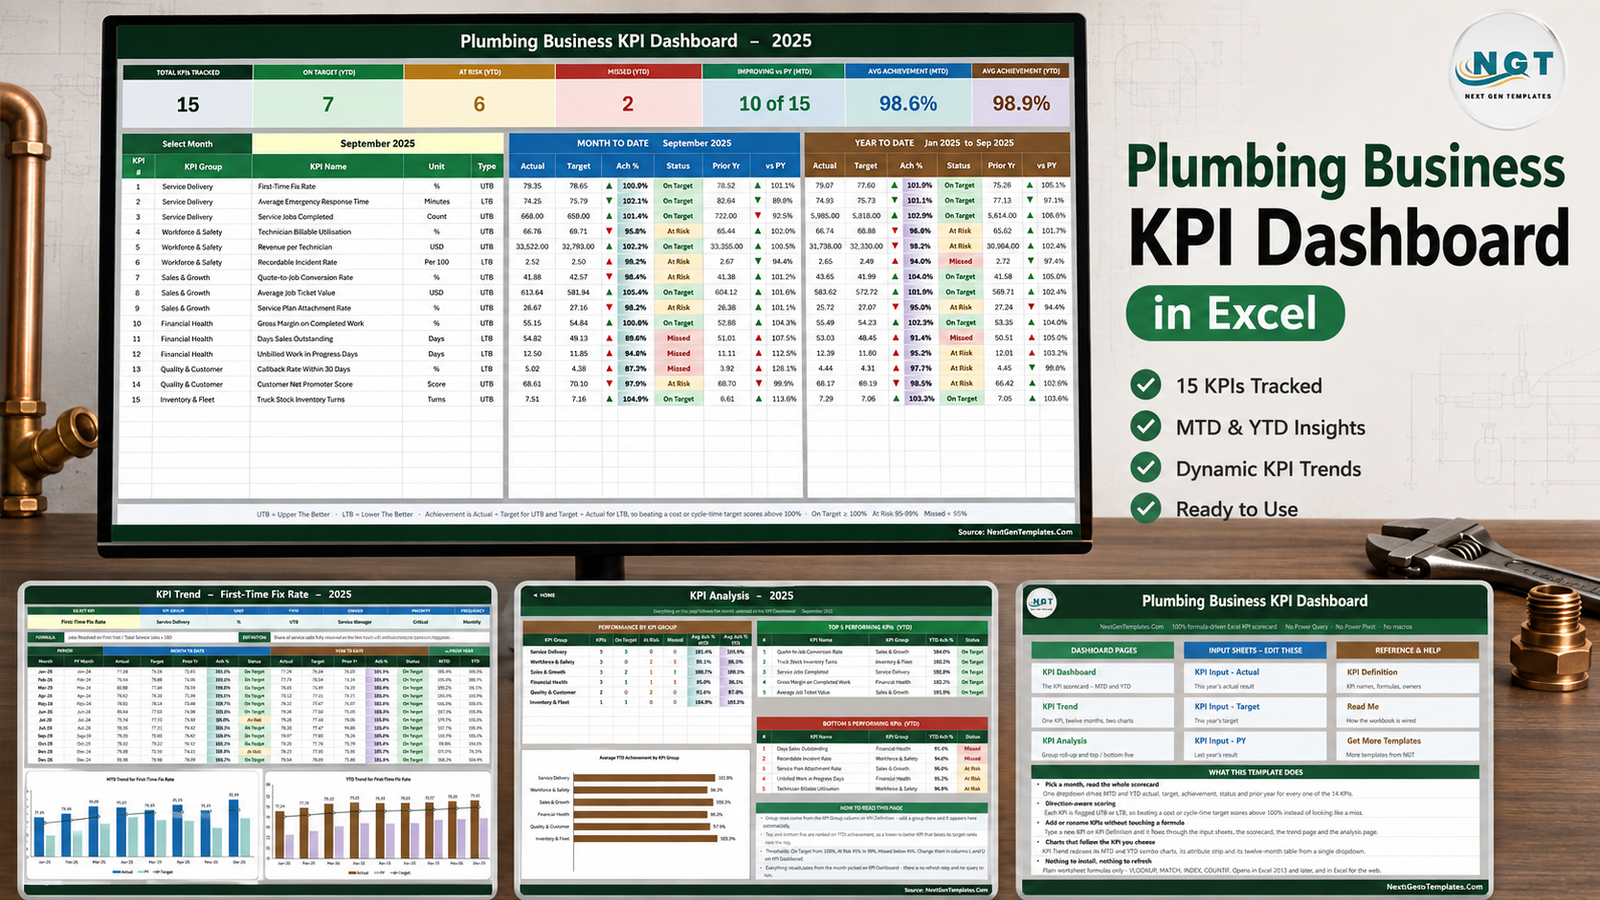
The scorecard. Seven summary cards run along the top: Total KPIs Tracked, On Target (YTD), At Risk (YTD), Missed (YTD), Improving vs PY (MTD), Avg Achievement (MTD) and Avg Achievement (YTD). In the shipped September 2025 sample they read 15, 7, 6, 2, 10 of 15, 98.6% and 98.9%. Below them, one row per KPI with the MTD block and the YTD block side by side.
KPI Trend
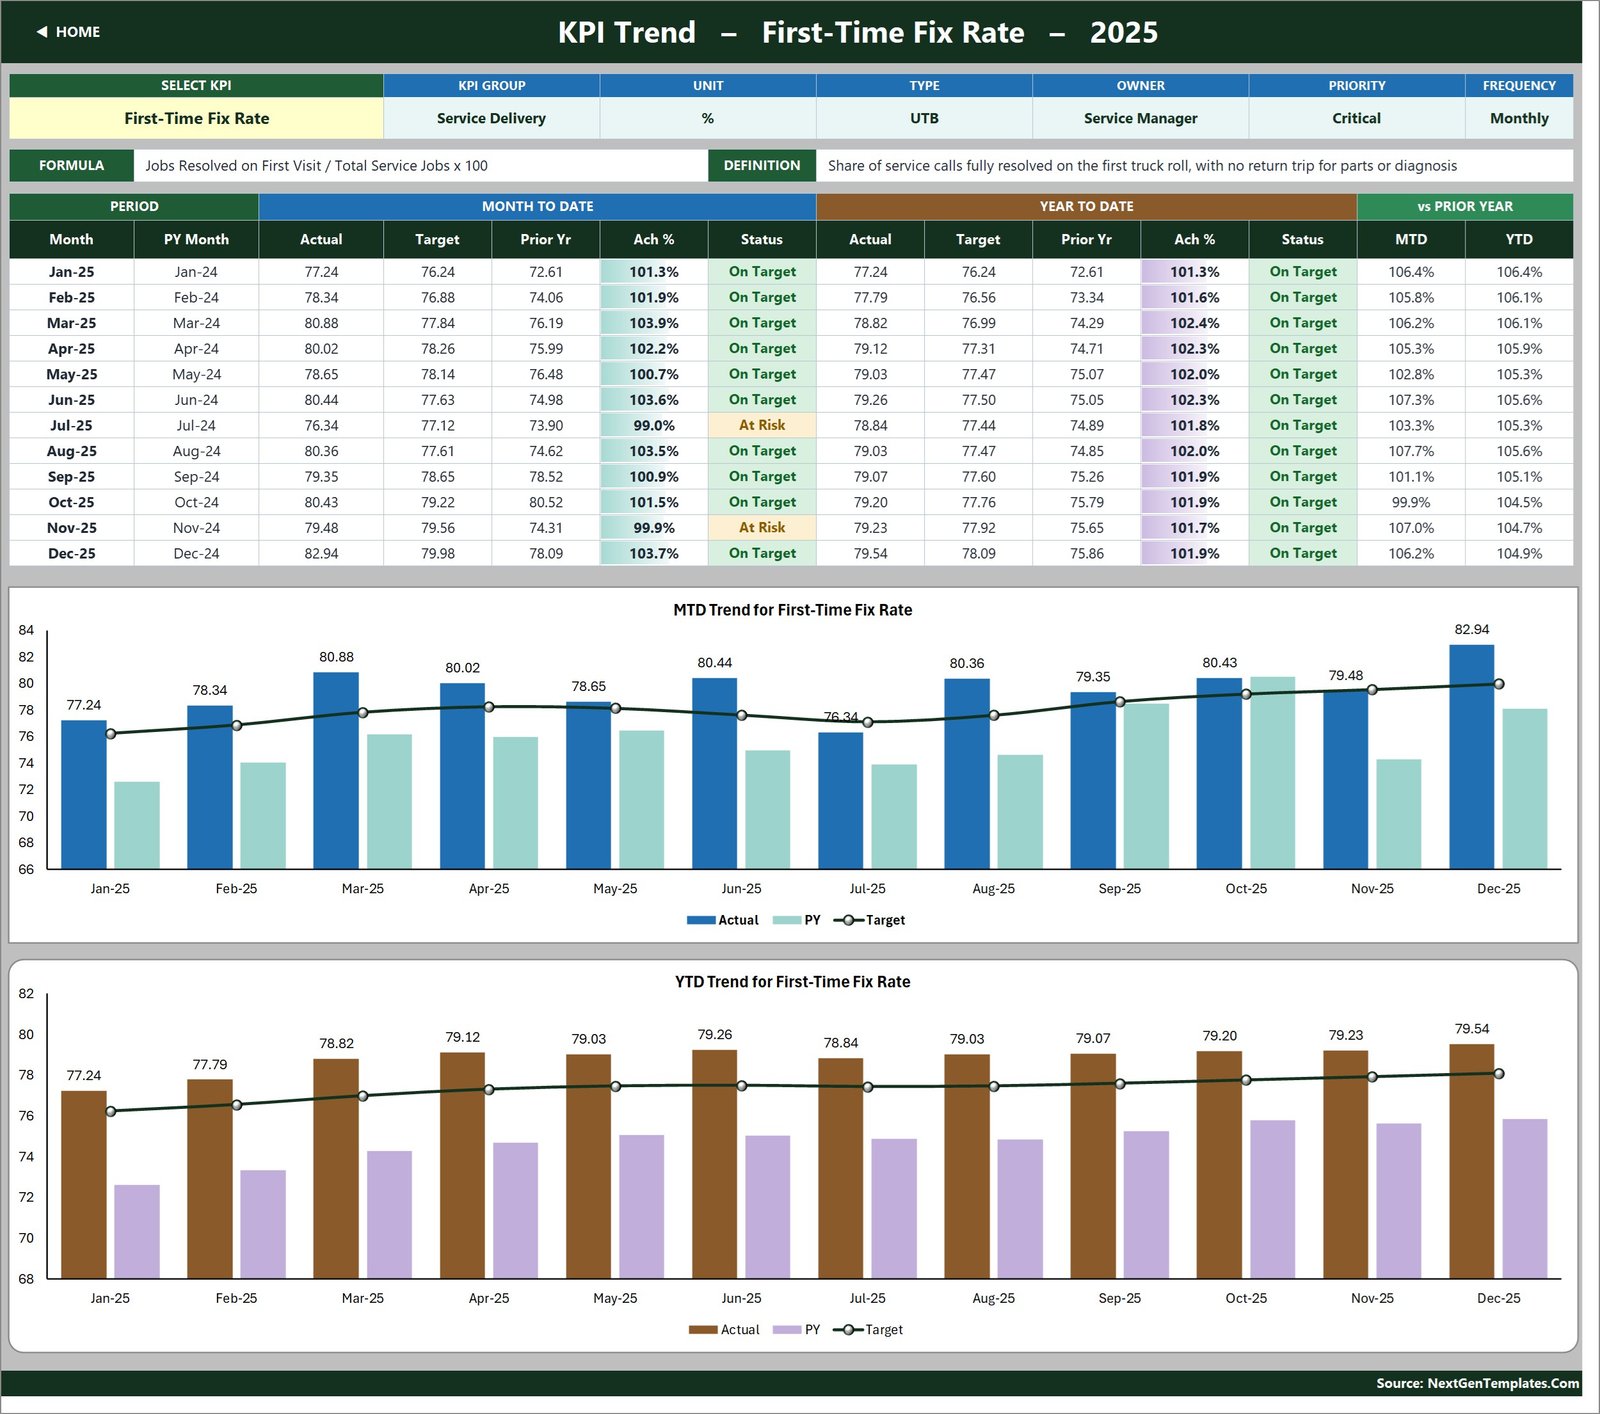
One KPI at a time, chosen in cell B4. The page shows its group, unit, type, owner, priority and frequency, its formula and definition, a twelve-month table of MTD and YTD actual / target / prior-year / achievement / status, and two combo charts – MTD Trend for First-Time Fix Rate and YTD Trend for First-Time Fix Rate in the sample – each plotting actual and prior-year columns against a target line.
KPI Analysis
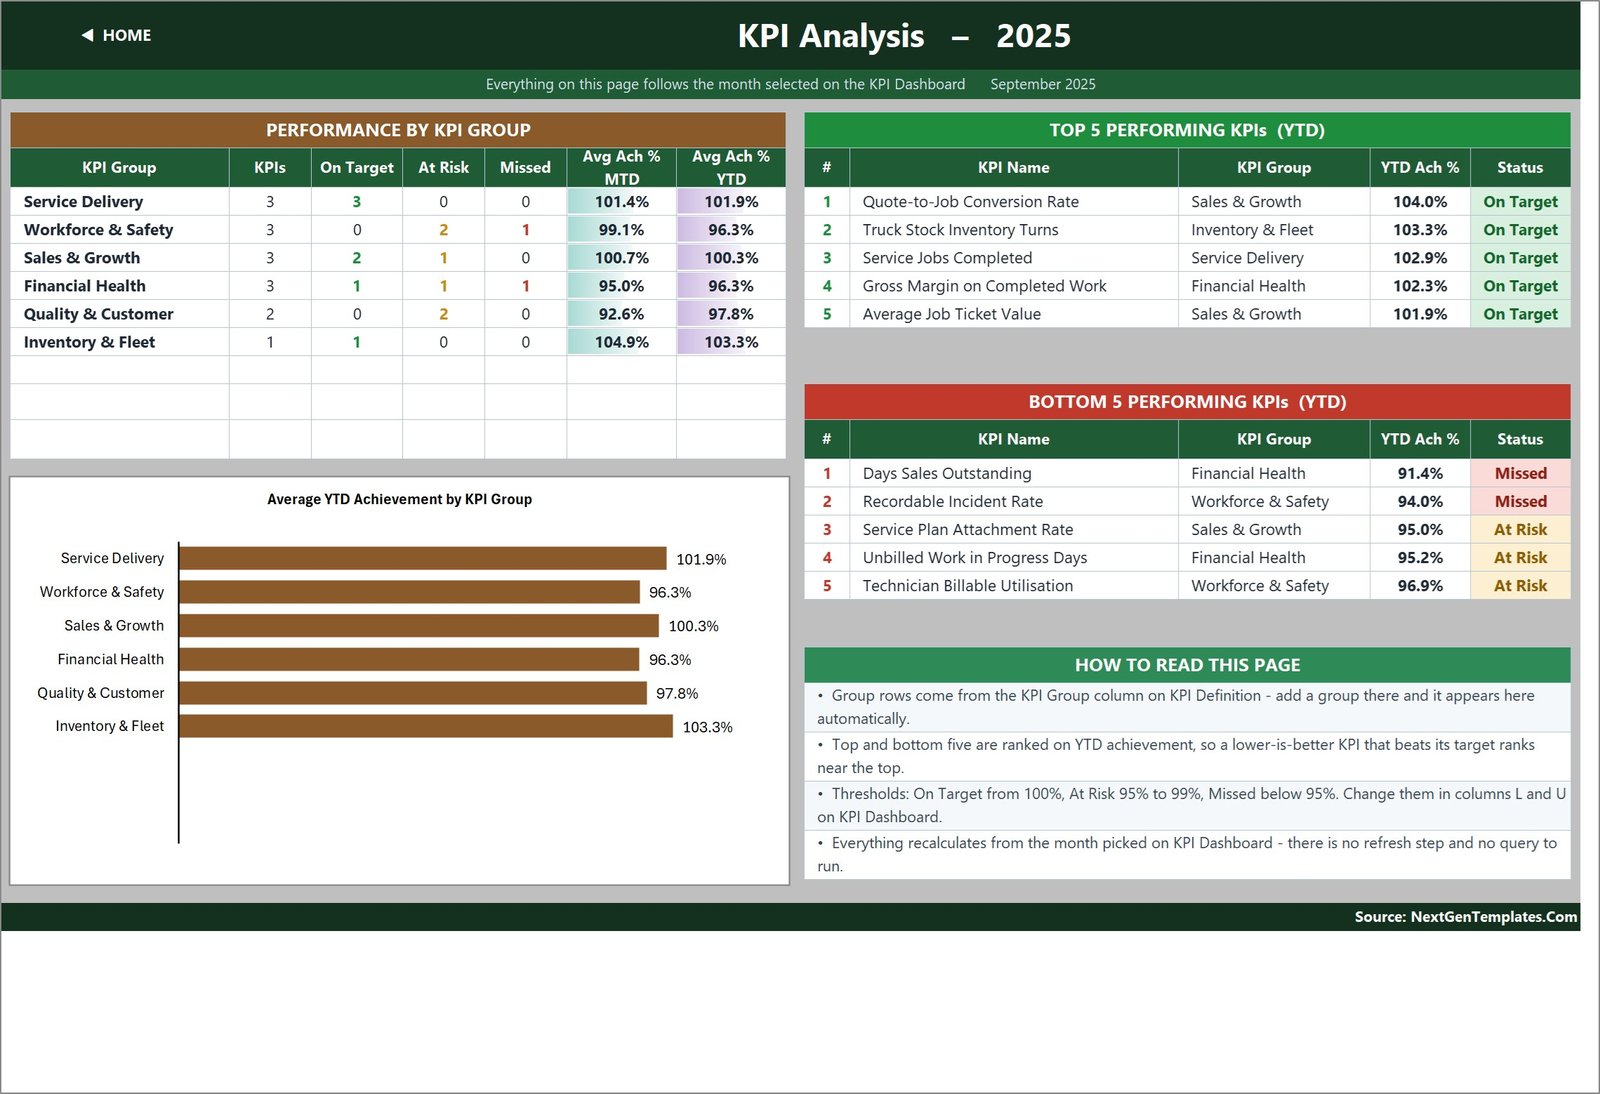
Achievement rolled up by KPI group, with a count of On Target / At Risk / Missed per group and an Average YTD Achievement by KPI Group bar chart. Beside it sit the top five and bottom five KPIs for the year to date. In the sample, Quote-to-Job Conversion Rate leads at 104.0% and Days Sales Outstanding trails at 91.4%.
KPI Input – Actual, Target and PY
The three sheets you type in. Each carries an MTD and a YTD column for every month of the year, so you keep control of how your own year-to-date is defined – volumes and counts accumulate, rates and per-unit costs are running averages. Cell E3 on the Actual sheet sets the first month of the reporting year and everything else re-bases from it.
KPI Definition, Support, Read Me and Get More Templates
KPI Definition is the master list every other sheet follows. Support holds the helper calculations behind the dropdowns, arrow glyphs, chart series and rankings. Read Me documents the wiring in one page, and Get More Templates links out to the wider catalogue.
Plumbing Business KPI Dashboard vs. Google Sheets vs. Paid Field-Service SaaS – Feature Comparison
| This template (Excel) | Google Sheets KPI dashboard | ServiceTitan / Housecall Pro tier | |
|---|---|---|---|
| Cost | One-off, under 20 | One-off, similar | Monthly subscription per technician |
| Platform | Excel 2013+, Excel for the web | Browser only | Cloud plus mobile app |
| Setup time | Minutes – sample year already loaded | Minutes | Weeks, usually with onboarding |
| Real-time team collaboration | Via OneDrive / SharePoint co-authoring | Native | Native |
| Mobile access | Excel mobile app | Browser / Sheets app | Purpose-built technician app |
| Customisable fields | Every cell – nothing locked or hidden | Every cell | Only what the vendor exposes |
| Share with a link | Yes, through OneDrive | Yes | Yes |
| Year-1 cost at 5 users | Under 20 total | Similar one-off | Typically four figures and up |
| Dispatch, scheduling, invoicing | No – reporting only | No | Yes |
| Add a KPI yourself | Type it on KPI Definition | Type it | Vendor roadmap |
Who Should Use This Template
Owner-operators and 5-50 technician plumbing companies that already know their monthly numbers and want them scored the same way every month. Service managers who have to hand a board or a private-equity owner a single page. Multi-trade contractors who want one identical scorecard format across plumbing, HVAC and electrical divisions, because the KPI list is typed rather than hard-coded.
It is not for anyone expecting the file to collect data. There is no job list, no customer table, no invoice register and no technician roster. You type fifteen numbers a month on each input sheet and the scorecard does the rest. It also does no dispatch and no scheduling, it is not accounting or invoicing software, and it does not check or track licensing, permits, backflow certification, apprenticeship hours or plumbing code compliance – none of those fields exist anywhere in the workbook. Keep compliance records with your licensing authority and your own compliance system.
Real-World Use Cases
The first-Monday review. An 18-van residential company opens the scorecard on the first Monday of the month. Because Callback Rate Within 30 Days sits three rows below First-Time Fix Rate, a callback spike and a fix-rate dip get discussed as one problem instead of two separate agenda items.
The board pack. A commercial contractor’s service manager prints KPI Dashboard for the month plus KPI Trend for whichever KPI is trending badly. In the sample year that is Days Sales Outstanding, bottom of the YTD ranking at 91.4% and driven by commercial general-contractor accounts.
The multi-trade roll-up. A finance controller runs three copies – plumbing, HVAC, electrical – with different KPI lists but identical layout, so the group review reads the same way whichever division is on screen.
Advantages of the Plumbing Business KPI Dashboard in Excel
- Nothing to install. Plain .xlsx, no macro prompt, no add-in, no data model to refresh.
- Every formula is readable. Nothing is locked, hidden or password protected – you can trace and extend any calculation.
- Fifteen KPIs that suit a trade, not a generic business. Truck stock inventory turns, service plan attachment rate, unbilled work-in-progress days and OSHA recordable incident rate are on the list because plumbing companies actually run on them.
- Prior-year context on every row, so a good number against target that is worse than last year still shows as a red arrow.
- Seven spare KPI rows already wired, plus documented instructions for going past 22.
Opportunities for Improvement
Three things are worth knowing before you buy, so nothing is a surprise:
- MTD and YTD are both entered, not derived. The input sheets store a YTD column per month deliberately, so you control the definition – but it does mean you supply both figures rather than letting the workbook accumulate them for you.
- The Home page and the Read Me capacity note still say “14 KPIs”. The file ships 15, and every sheet that calculates uses all 15 – the Total KPIs Tracked card, KPI Definition and the group roll-up all agree on 15. The “14” is stale label text carried over from an earlier build of this template line.
- The Read Me’s “cumulative or average YTD” note still uses aerospace examples (“aircraft deliveries, non-conformance reports”) from the first build of this line. The rule it describes is correct and applies unchanged to plumbing volumes and rates; only the illustration is from the wrong industry.
Best Practices
- Set your reporting year in cell E3 before typing any data – it re-bases the Target sheet, the PY sheet, the month dropdown and every sheet title at once.
- Fix the KPI list on KPI Definition first, then type numbers. Renaming a KPI later is safe, but deciding the list up front saves a pass over three sheets.
- Set the UTB / LTB flag deliberately. Getting it wrong is the single most common reason a scorecard reads backwards.
- Enter targets for the whole year at once. Month-by-month targets typed late tend to drift towards whatever the actual turned out to be.
- Move the At Risk band to match your governance rather than arguing with 95%. It is a formula, not a rule.
- Keep last year’s file. The PY sheet is only as useful as the prior-year numbers you are willing to keep typing.
Explore Relevant Templates
- Plumbing Business KPI Dashboard in Excel – the template in this article.
- Plumbing Business KPI Dashboard in Power BI and Plumbing Business KPI Dashboard in Google Sheets – the same scorecard on the other two platforms.
- Plumbing Business KPI Scorecard in Excel – a separate, more compact scorecard line with a different KPI set.
- Plumbing Contractor Dashboard in Excel – the analytical dashboard line, with slicers and record-level data instead of a monthly scorecard.
- Electrical Contractor KPI Dashboard in Excel and Garden Centers KPI Dashboard in Excel – the same scorecard engine on neighbouring topics.
- HVAC Contractor KPI Scorecard in Excel – the trades sibling.
Frequently Asked Questions
Is this the same as the Plumbing Business KPI Scorecard in Excel?
No. They are two separate products from two separate template lines. This one is the month-picker dashboard family – a KPI Dashboard page, a KPI Trend page and a KPI Analysis page across 11 worksheets, with 15 KPIs. The Scorecard is a more compact single-page product with its own KPI set. Buyers often own both; they are not duplicates.
Does it dispatch jobs or raise invoices?
No. It is a reporting layer. If you already run a field-service platform, this is where the month’s numbers go to be read. If you do not, it is the cheapest way to start measuring at all.
Does it check licensing, permits or plumbing code?
No. There is no licence field, no permit register, no backflow certification tracker and no code reference in the workbook, and it should not be relied on for compliance of any kind.
Do I need macros or Power Query?
Neither. It is a plain .xlsx built entirely from worksheet formulas, so it opens without a security prompt and needs no refresh.
Can I change the KPIs to my own?
Yes – that is the design. Rename or replace them on KPI Definition and every other sheet follows. Seven spare rows are already wired.
Are the figures in the screenshots real plumbing data?
No. The 2025 numbers are generated sample data so the dashboard is populated on first open. Replace them with your own.
What is in the download?
A zip containing Plumbing Business KPI Dashboard.xlsx and the Excel KPI Dashboard User Manual PDF.
About the Author
Built by PK – Microsoft Certified Professional with 15+ years of Excel, Google Sheets, and Power BI experience. Founder of NextGenTemplates, reaching 300K+ subscribers across YouTube channels. Every template is hand-built and tested before release.
Conclusion
A plumbing business does not fail because nobody looked at revenue. It fails because the callback rate crept up for four months while everybody looked at revenue. The Plumbing Business KPI Dashboard in Excel puts 15 measures on one page, scores each in the direction that is actually good for it, flags the misses in red, and shows the twelve-month shape behind any one of them – all from formulas you can read and change. Get the Plumbing Business KPI Dashboard in Excel, replace fifteen numbers, and your month is scored.
For walkthroughs of this and other Excel dashboards, subscribe at youtube.com/@PKAnExcelExpert.