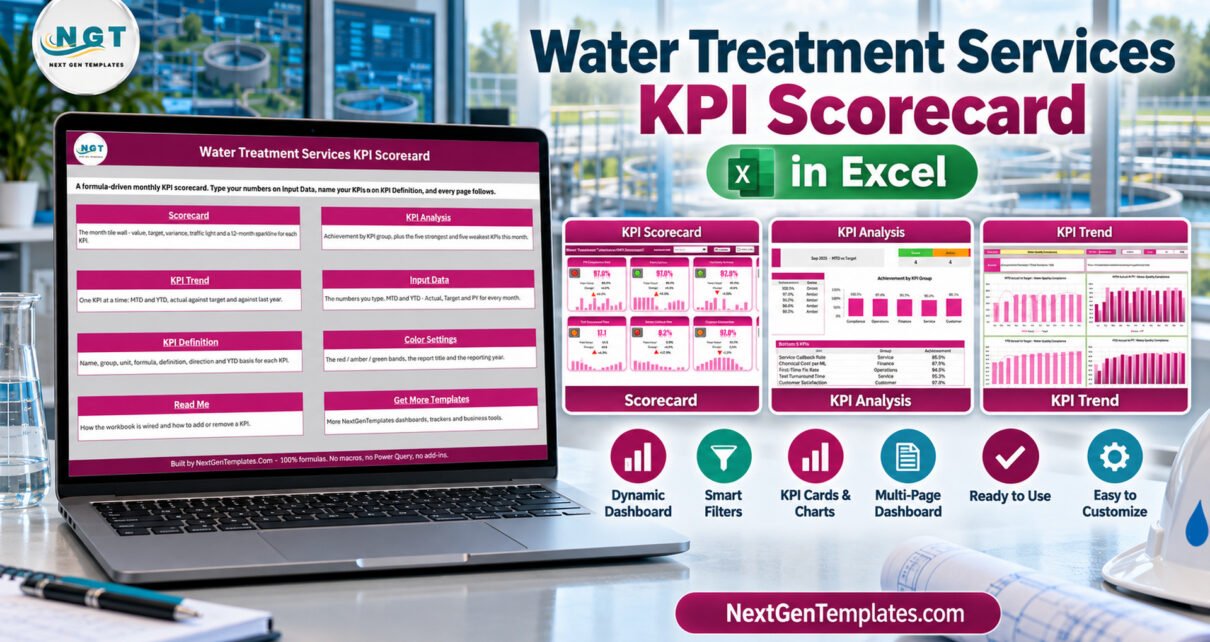
Water Treatment Services KPI Scorecard in Excel turns monthly operating figures into a consistent management review. Instead of rebuilding a slide or chasing separate sheets, a team can review ten supplied KPIs across five groups, switch between MTD and YTD, compare actuals with target, previous year, or prior month, and use formula-driven traffic lights to focus the conversation. The workbook contains nine visible worksheets, supports twenty KPIs, and uses no macros.
This article explains the exact workbook shown in the screenshots. It is a KPI scorecard, not the separately drafted Water Treatment Services KPI Dashboard, and it does not claim to be a SCADA, laboratory, work-order, billing, or regulatory filing system.
That distinction matters because a scorecard supports a specific management rhythm. The team agrees what each KPI means, records the approved monthly results, reviews status against an agreed comparison, and follows up outside the workbook. It does not collect sensor readings or decide whether a treatment process is compliant. Used within that boundary, it can replace an inconsistent month-end collage with one stable view. Managers can see the current result, the gap, the direction of good performance, the twelve-month pattern, the group context, and the definition behind the number without opening several separate files.
Key Features of Water Treatment Services KPI Scorecard in Excel
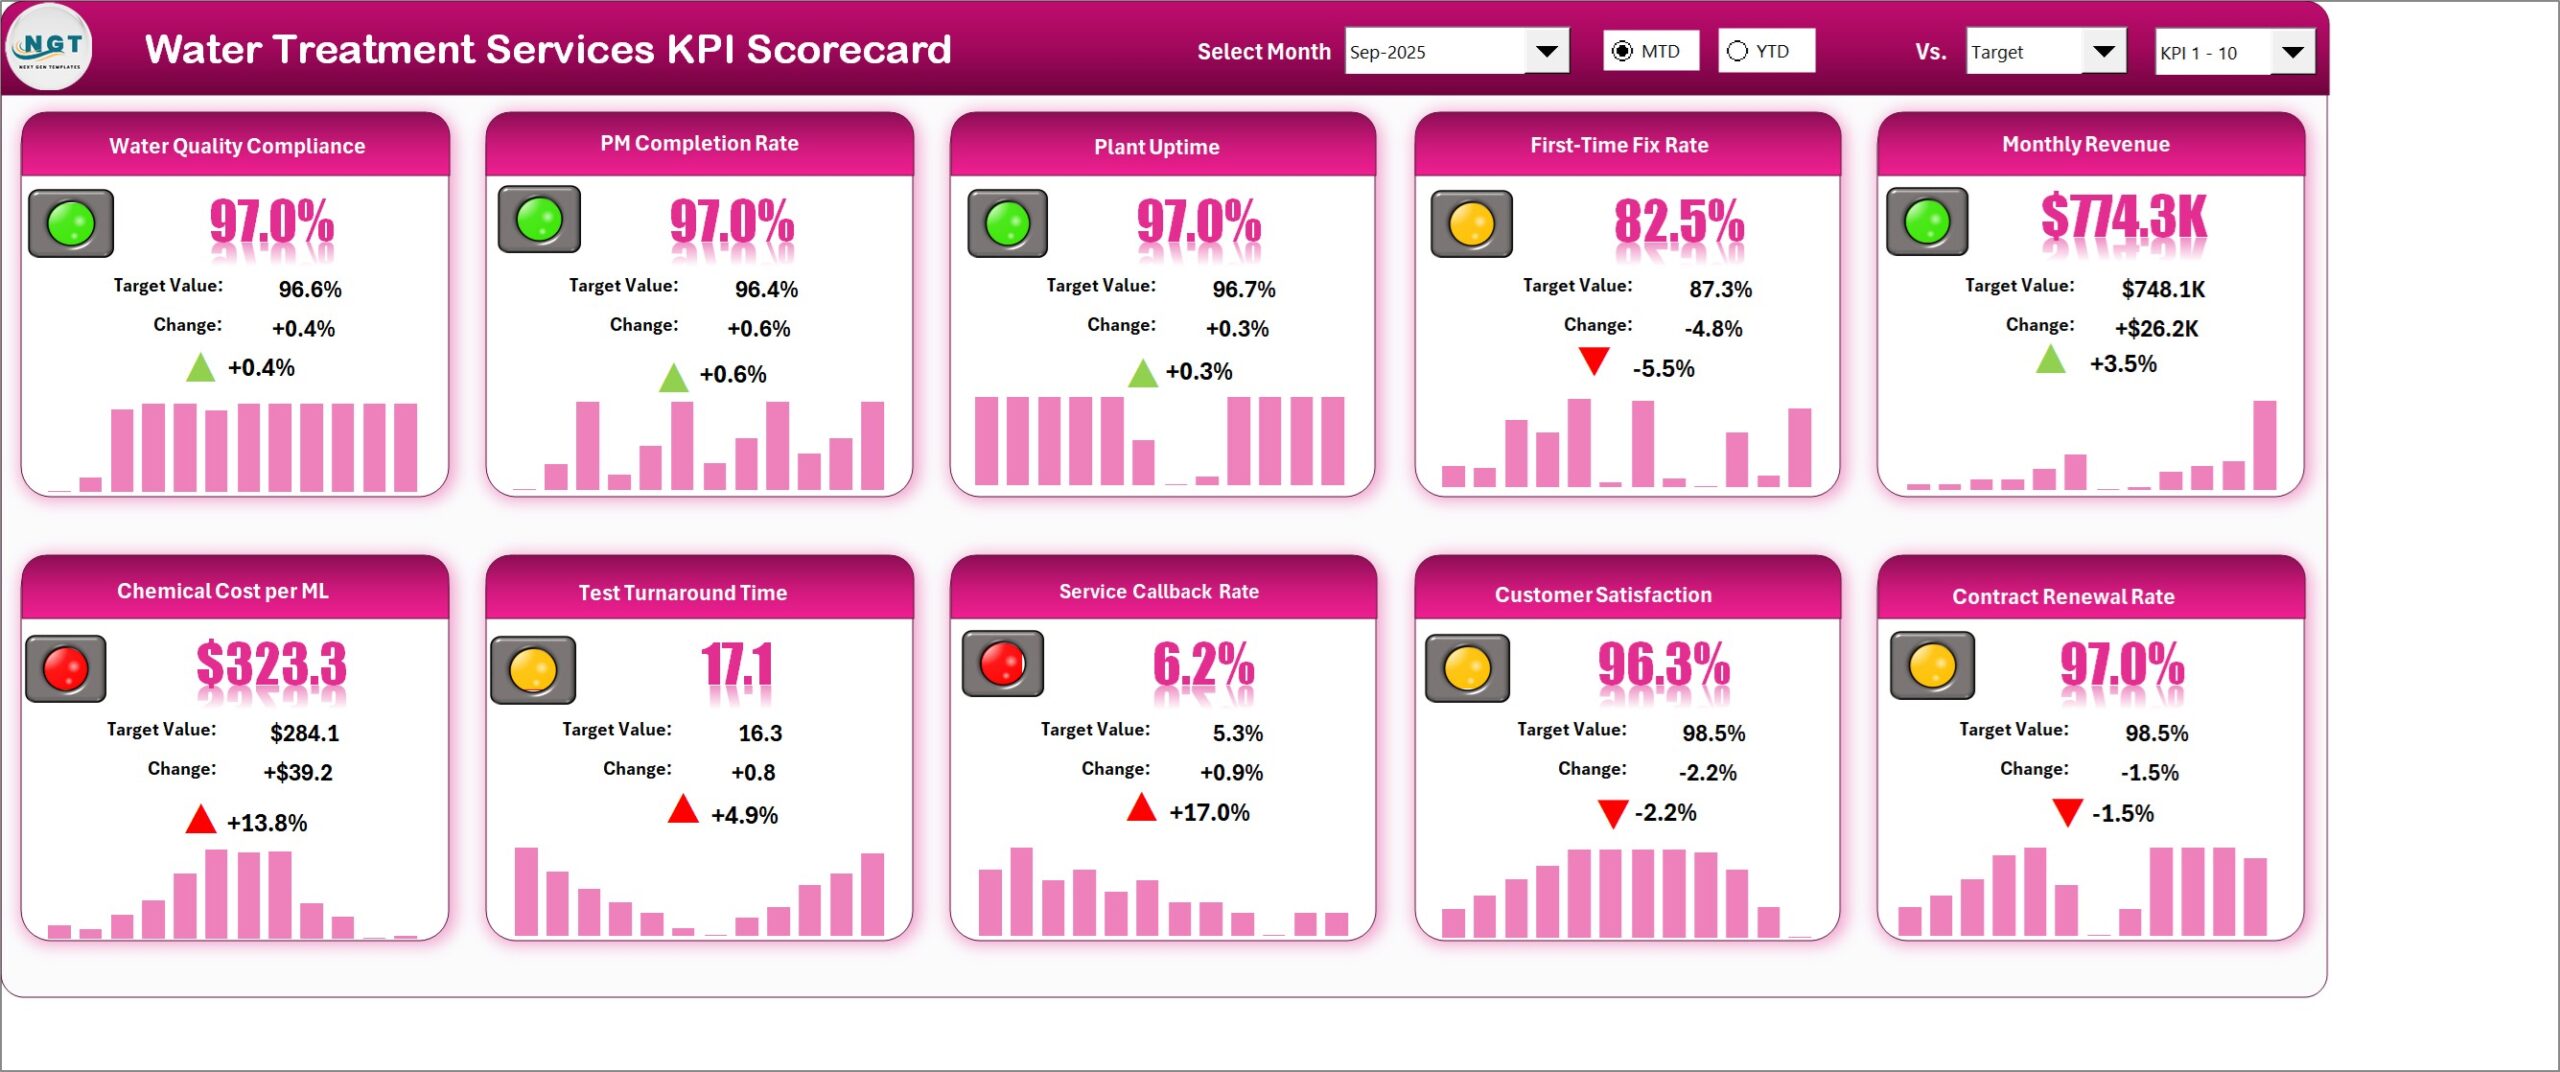
The scorecard arrives with Water Quality Compliance, PM Completion Rate, Plant Uptime, First-Time Fix Rate, Monthly Revenue, Chemical Cost per ML, Test Turnaround Time, Service Callback Rate, Customer Satisfaction, and Contract Renewal Rate. These sample definitions cover compliance, operations, finance, service, and customer groups, but buyers can replace them with their own approved KPIs.
Four header controls shape the view. Select Month chooses the reporting period. MTD/YTD switches the time basis. The comparison selector changes between Target, Previous Year, and Prior Month. The KPI selector moves between KPI 1-10 and KPI 11-20. UTB and LTB logic ensures higher-is-better and lower-is-better measures are judged in the correct direction.
Searchers may call this a water treatment KPI scorecard, Excel KPI scorecard template, water treatment performance tracker, or water services KPI reporting workbook. In every case, the core job is the same: organize finished monthly figures, compare them consistently, and make the next review easier to run.
Workbook Pages Explanation
Home
The opening page describes what each worksheet does and routes users to Scorecard, KPI Analysis, KPI Trend, Input Data, KPI Definition, Color Settings, Read Me, and Get More Templates.
Scorecard
Ten cards display the selected period’s value, comparison value, variance, RAG status, direction arrow, and twelve-month sparkline. The screenshot is not a mock-up: it is the real worksheet included in the .xlsx file.
KPI Analysis
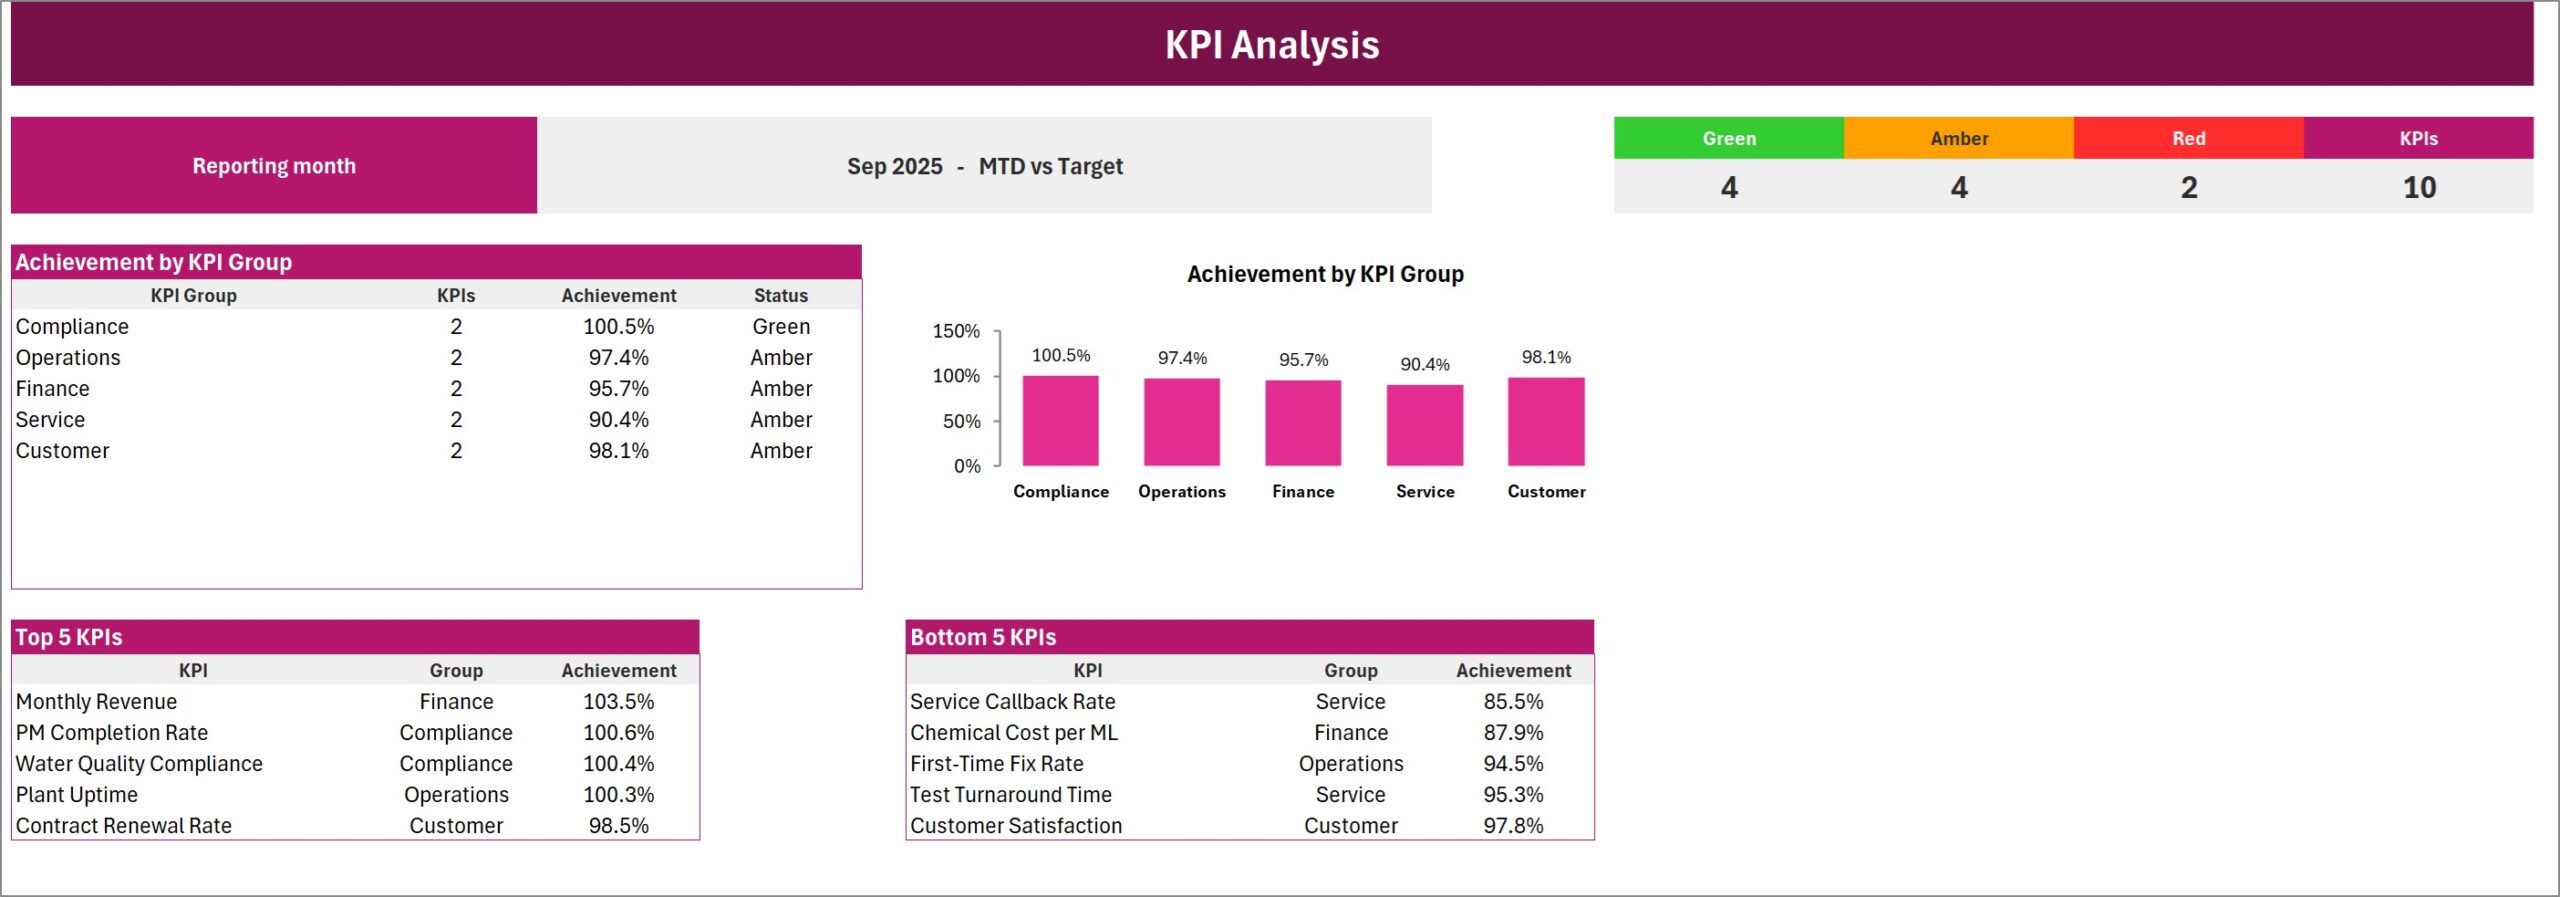
This page counts green, amber, and red results, calculates achievement by KPI group, and identifies the five strongest and five weakest KPIs for the selected month and comparison basis.
KPI Trend
Select one KPI to see its group, unit, UTB/LTB type, formula, and definition. Four charts compare MTD and YTD Actual with Target and PY across all twelve months.
Input Data
The input page holds MTD and YTD Actual, Target, and PY values month by month. YTD is deliberately typed rather than recalculated because volumes may need a sum, rates may need an average, and another KPI may use an organization-specific roll-up.
KPI Definition and Color Settings
KPI Definition stores each KPI’s name, group, unit, formula, definition, direction, and YTD basis. Color Settings controls the report title, reporting year, and UTB/LTB RAG thresholds.
Read Me and Get More Templates
Read Me documents input rules, unique-name checks, selectors, thresholds, and the no-macro design. Get More Templates lists other product families; it does not change scorecard calculations.
Water Treatment Services KPI Scorecard in Excel vs. Google Sheets vs. Paid CRM/SaaS – Feature Comparison
| Factor | Excel scorecard | Google Sheets | Paid operations SaaS |
|---|---|---|---|
| Cost | One-time template | Template or build effort | Usually recurring |
| Platform | Excel desktop file | Browser spreadsheet | Vendor web app |
| Setup time | Rename KPIs and enter monthly figures | Copy and validate formulas | Configure users and workflows |
| Collaboration | File sharing | Live link sharing | Account and role based |
| Custom fields | Definitions, groups, units, thresholds | Editable with formula care | Plan dependent |
| Data integration | Manual finished inputs | Manual or scripted | May offer integrations |
| Best use | Controlled monthly review | Light shared reporting | Live workflow and system records |
Who Should Use This Template
Plant and operations managers can review uptime, preventive maintenance, and water quality measures. Service managers can study first-time fix, test turnaround, callback, and customer satisfaction. Commercial managers can place revenue, chemical cost, and renewal metrics beside service measures without pretending the workbook replaces accounting or contract systems.
It is also useful for smaller contractors whose monthly review is currently assembled manually. It is not suited to teams needing live sensor ingestion, ticketing, laboratory chain of custody, regulated records, multi-user permissions, or automatic ERP integration.
Real-World Use Cases
Monthly plant review
Choose the reporting month and Target comparison, then use the Scorecard and KPI Analysis pages to identify off-target measures before assigning follow-up work.
Service quality meeting
Review First-Time Fix Rate, Test Turnaround Time, Service Callback Rate, and Customer Satisfaction together. The Trend page helps distinguish one difficult month from a persistent pattern.
Management pack preparation
Use the formula-driven cards, traffic lights, group chart, and trend charts as a repeatable internal view. Validate all numbers before copying them into formal management or regulatory material.
Advantages of Water Treatment Services KPI Scorecard in Excel
- One consistent layout for operational, financial, service, and customer measures.
- Transparent definitions and formulas rather than hidden business logic.
- Separate MTD and YTD fields for organization-approved roll-ups.
- Configurable RAG bands for both UTB and LTB measures.
- Twenty-KPI capacity while keeping each scorecard view readable.
- No macros, Power Query, add-ins, or external connections to enable.
Opportunities for Improvement
The workbook intentionally favors transparency over integration. A future version could add a controlled import layer, protected input validation, or role-specific print views. Those functions are not included today. If your team needs a live multi-user workflow, audit trail, automated laboratory feed, or mobile field entry, pair this reporting workbook with the appropriate operational system instead of forcing Excel to behave like one.
Best Practices
- Agree KPI owners, definitions, units, and sources before entering results.
- Keep every KPI name unique; the built-in Check column flags duplicates.
- Record the approved YTD basis for each KPI.
- Set UTB/LTB direction carefully so traffic lights and arrows are meaningful.
- Validate Actual, Target, and PY values before the monthly meeting.
- Change RAG bands only with documented management approval.
- Save a dated monthly copy if your governance process requires a snapshot.
For guidance on spreadsheet calculation behavior, see Microsoft Excel help and learning.
Explore Relevant Templates
On this site, the published Water Supply KPI Scorecard in Excel is the closest scorecard comparison. For broader seven-sheet reporting, read Water Utilities KPI Dashboard in Excel. For a more analytical Excel layout, see Water Utilities Dashboard in Excel. These are separate published products, not pages inside this workbook.
Frequently Asked Questions
Is this the Water Treatment Services KPI Dashboard?
No. This is the scorecard product from the Excel KPI Scorecard line. The similarly named dashboard is a different workbook.
How many KPIs are included?
Ten water-treatment-service KPIs are prefilled as examples, and the workbook has room for twenty.
Does the workbook calculate YTD from MTD?
No. Users enter finished YTD values because the correct roll-up can be a sum, average, or another approved method.
Can the thresholds be changed?
Yes. Color Settings contains separate UTB and LTB green, amber, and red bands.
Are macros required?
No. The .xlsx file uses formulas, conditional formatting, camera pictures, and sparklines.
Does it prove regulatory compliance?
No. It displays the figures and definitions supplied by the user; it does not validate samples, regulations, or submissions.
About the Author
Built by PK – Microsoft Certified Professional with 15+ years of Excel, Google Sheets, and Power BI experience. Founder of NextGenTemplates, reaching 300K+ subscribers across YouTube channels. Every template is hand-built and tested before release.
Conclusion
The Water Treatment Services KPI Scorecard in Excel is a focused reporting workbook for teams that already have monthly numbers but need a clearer review process. Its value is not hidden automation: it is the combination of transparent inputs, direction-aware RAG logic, twenty-KPI capacity, group analysis, and four trend comparisons in one editable file.
In practice, the Water Treatment Services KPI Scorecard in Excel works best when one owner validates the monthly input and every reviewer uses the same definitions. That simple discipline keeps the Water Treatment Services KPI Scorecard in Excel useful without overstating what a spreadsheet can automate.
Download the Water Treatment Services KPI Scorecard in Excel from NextGenTemplates and adapt the KPI definitions, thresholds, and reporting year to your operation. Visit PK: An Excel Expert on YouTube for practical Excel tutorials.