New: NextGenTemplates Academy - video courses on Excel formulas with AI and Pivot Tables & dashboards. Early-bird: 20% off with code EARLYBIRD20 - first 20 orders only.See the courses →
PKComments Off on Water Treatment Services KPI Scorecard in Excel
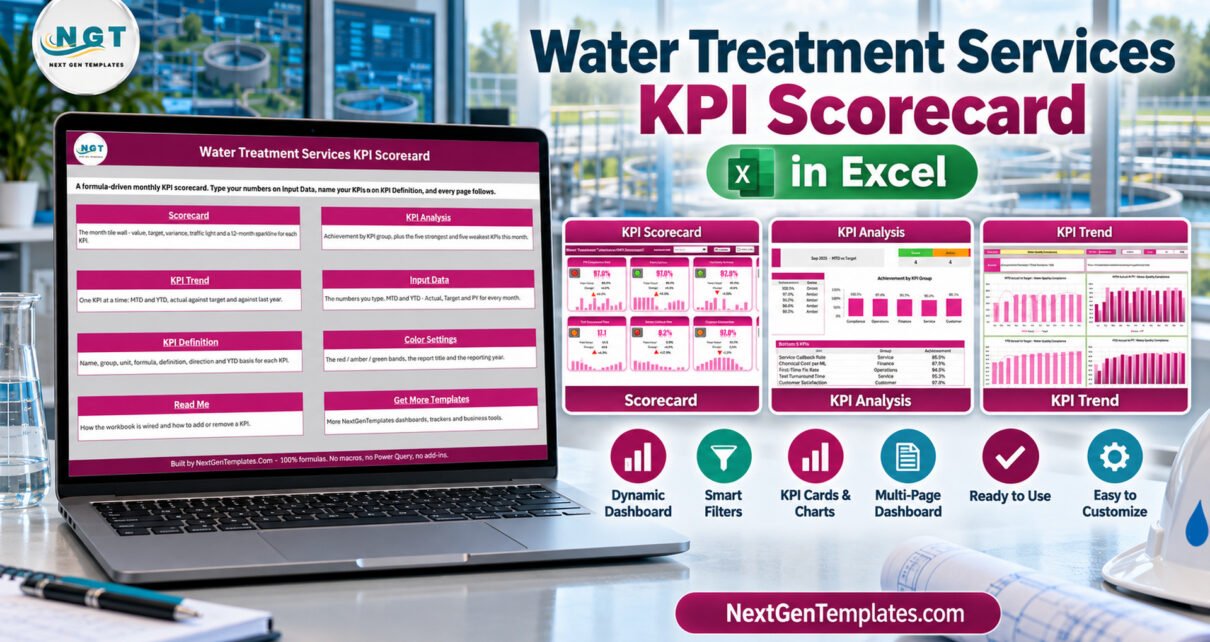
Water Treatment Services KPI Scorecard in Excel turns monthly operating figures into a consistent management review. Instead of rebuilding a slide or chasing separate sheets, a team can review ten
PKComments Off on Home Inspection Services KPI Scorecard in Excel
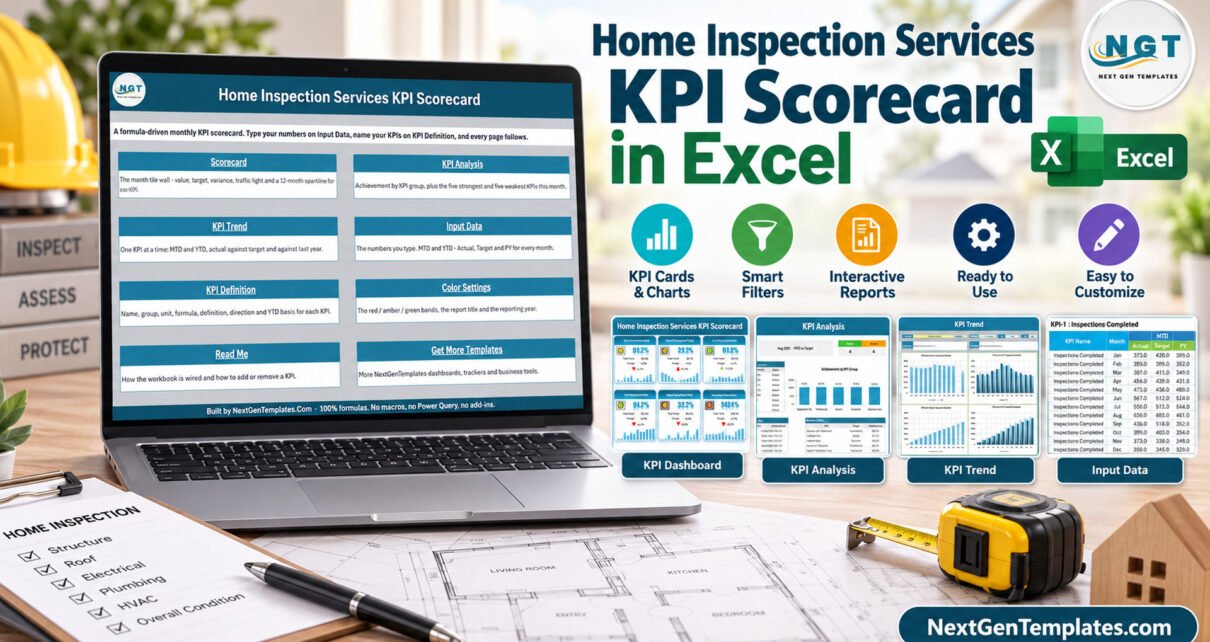
Ask the owner of a home inspection company how last month went and you usually get a story. The spring rush finally eased, two reports went out late because an
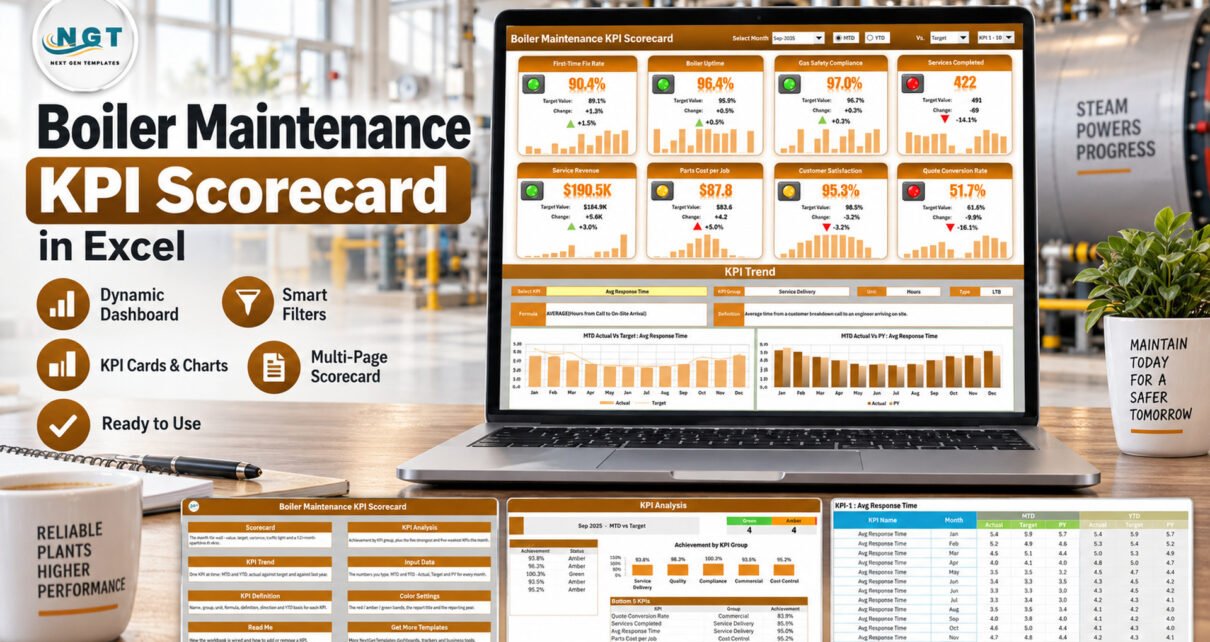
PKComments Off on Boiler Maintenance KPI Scorecard in Excel
The Boiler Maintenance KPI Scorecard in Excel turns final monthly maintenance figures into a consistent scorecard for management review. Instead of rebuilding cards and charts every month, you type MTD
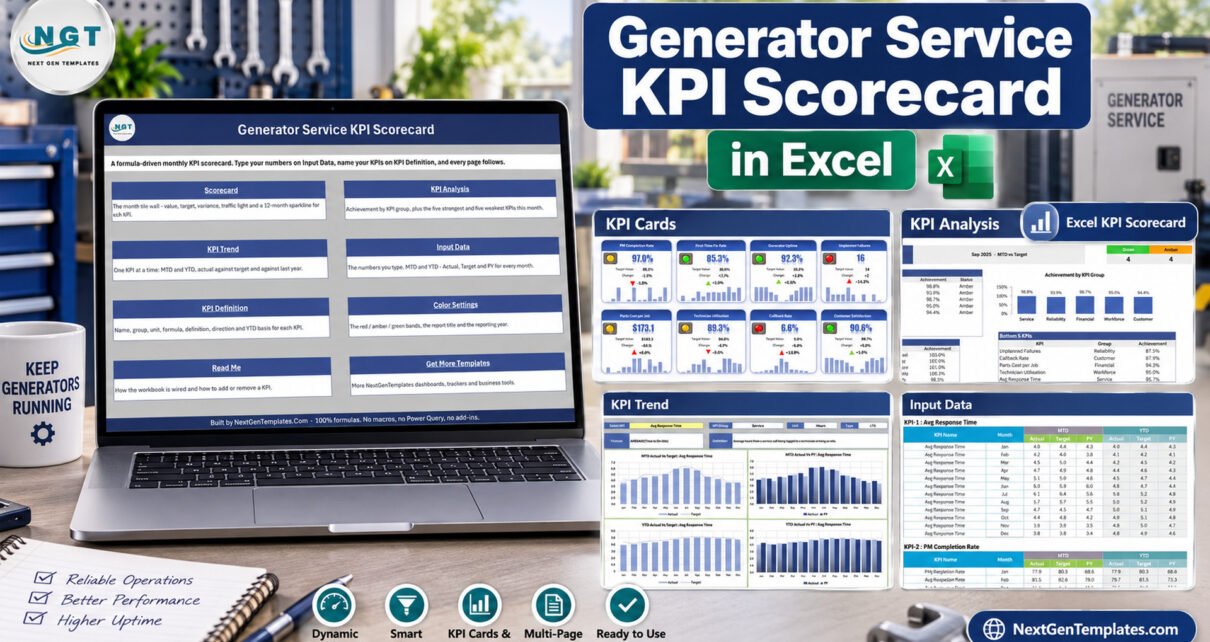
PKComments Off on Generator Service KPI Scorecard in Excel
Generator Service KPI Scorecard in Excel is a ready-to-use monthly scorecard for generator servicing teams that want disciplined KPI review without a subscription platform. The supplied workbook starts with 10
PKComments Off on Junk Removal Services KPI Scorecard in Excel
A junk removal business runs on a handful of numbers: how many jobs the crews completed, how much volume the trucks hauled, whether the team arrived on time, how much
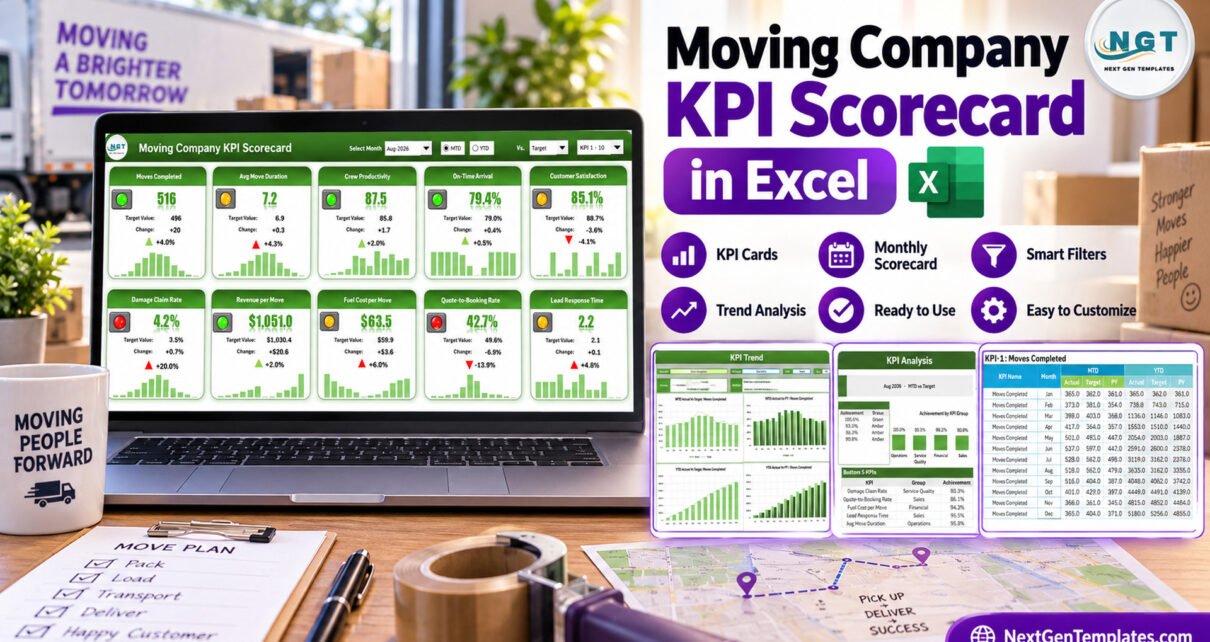
PKComments Off on Moving Company KPI Scorecard in Excel
A moving company lives on a handful of numbers: how many moves the crews completed, how long each job took on site, whether the truck arrived inside the booked window,
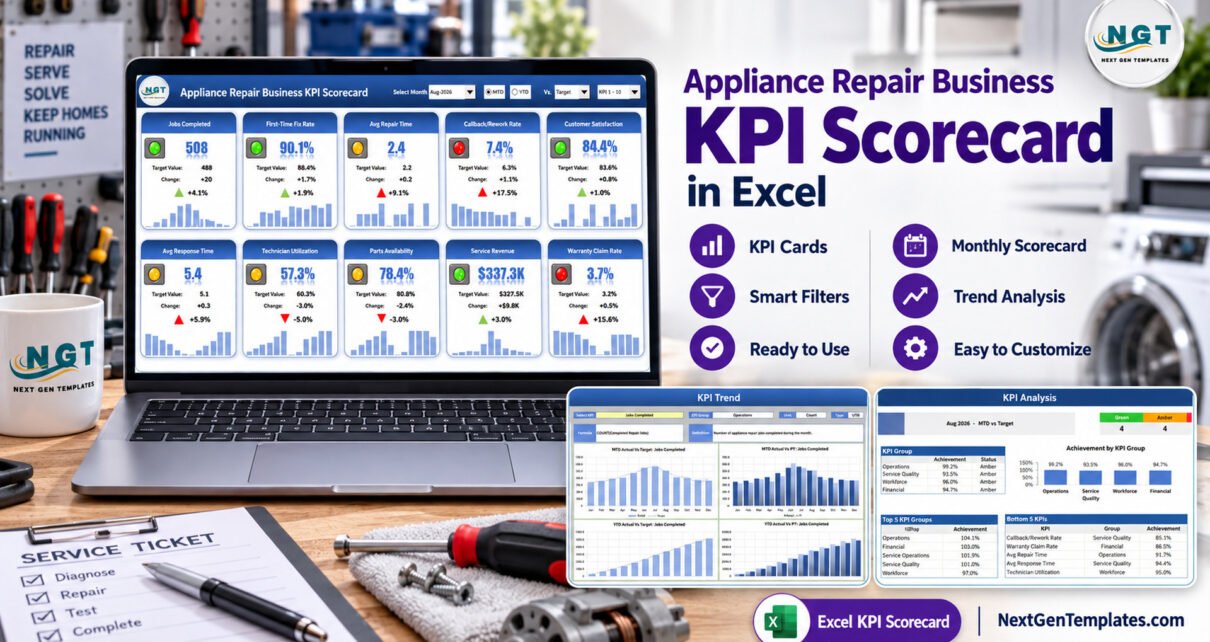
PKComments Off on Appliance Repair Business KPI Scorecard in Excel
An appliance repair business lives on a handful of numbers: how many jobs were completed, how many were fixed on the first visit, how quickly technicians arrived, and how many
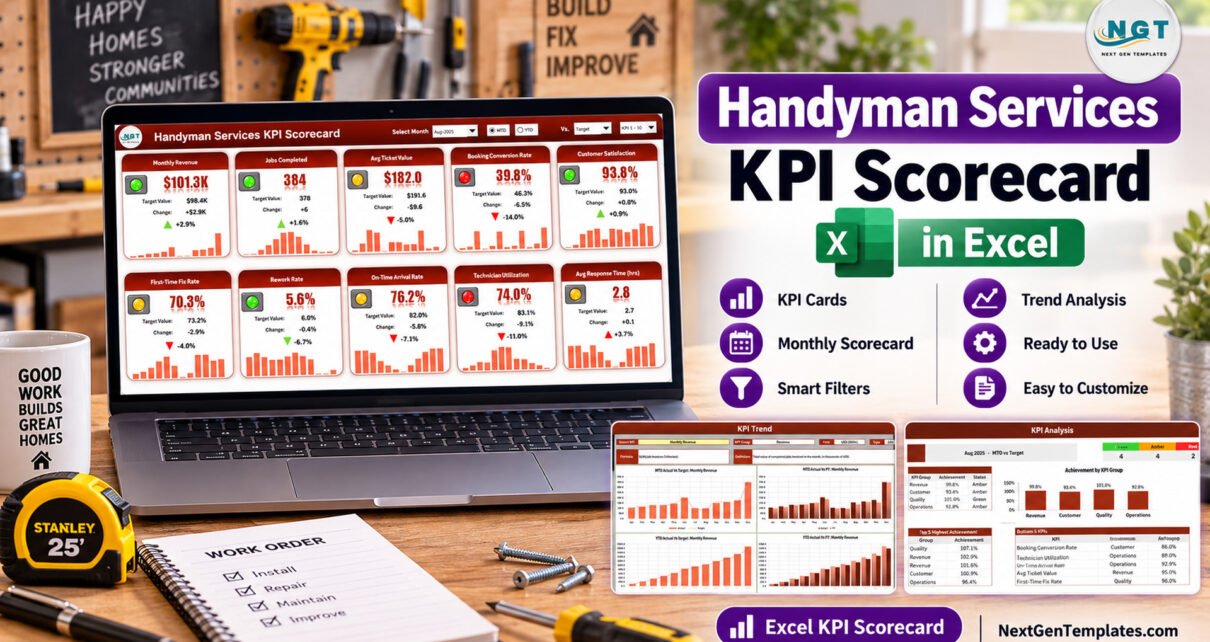
PKComments Off on Handyman Services KPI Scorecard in Excel
The Handyman Services KPI Scorecard in Excel is a ready-made monthly scorecard with 10 KPIs in 4 groups, 10 traffic-light tiles, a KPI Analysis page, a four-chart KPI Trend page