A junk removal business runs on a handful of numbers: how many jobs the crews completed, how much volume the trucks hauled, whether the team arrived on time, how much of the load stayed out of landfill and what each ton cost to dispose of. The Junk Removal Services KPI Scorecard in Excel puts those numbers on one monthly tile wall, with traffic lights, targets, change arrows and a 12-month sparkline for each KPI. It is a formula-driven workbook with no macros, built for owners and operations managers who want a clear monthly review without a subscription. Junk Removal Services KPI Scorecard in Excel
You can get the template on NextGenTemplates: download the junk removal scorecard. This is the KPI scorecard edition from the 26. KPI Scorecard family, a different template from the Junk Removal Services KPI Dashboard in Excel and from the analytical dashboard line. If you like this format, see how the same scorecard works for the Septic Tank Service KPI Scorecard in Excel and the Plumbing Business KPI Scorecard in Excel.
Key Features of the Junk Removal Services KPI Scorecard in Excel
- 10 KPIs in 4 groups – Operations, Service Quality, Financial and Sales.
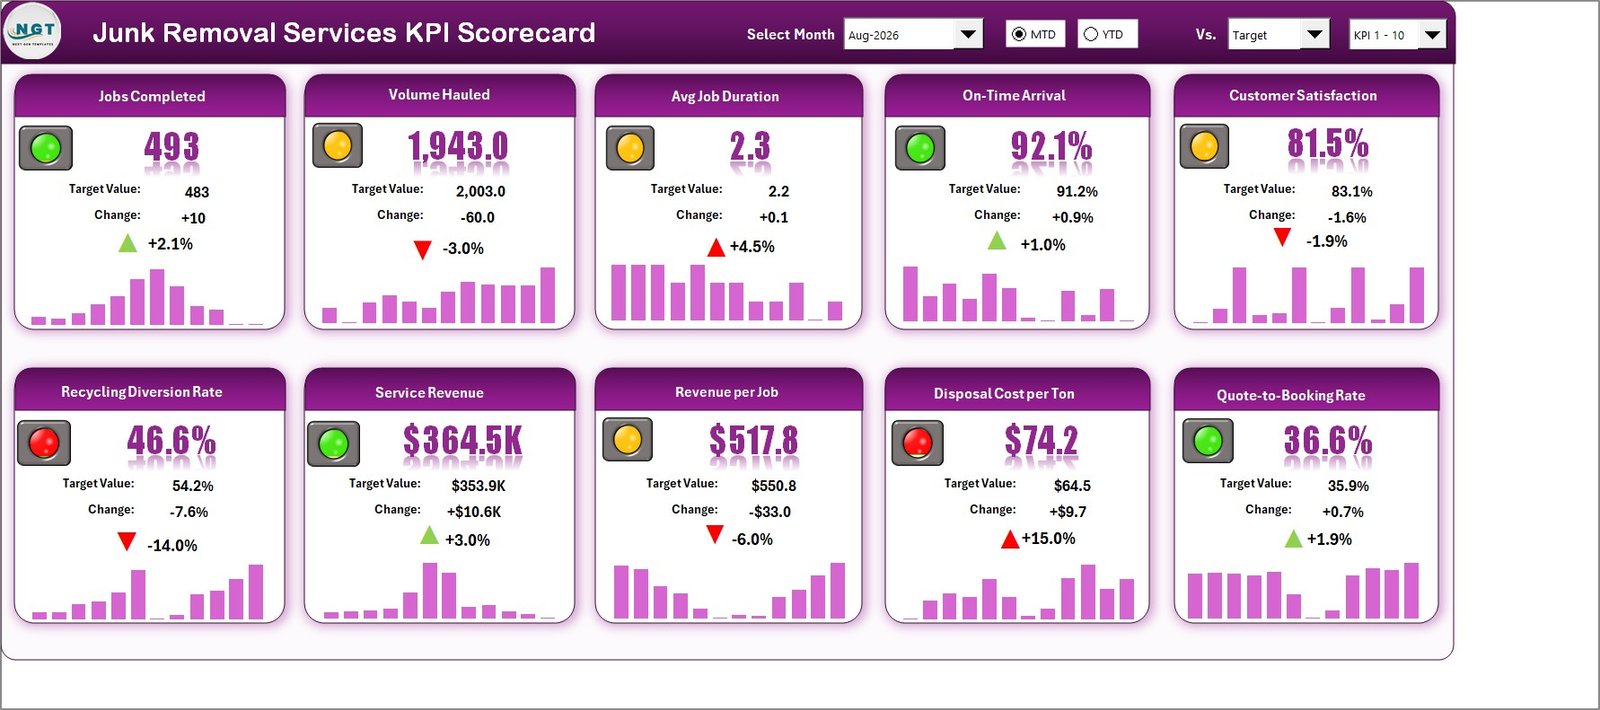
- Traffic-light tiles showing value, target, change, direction arrow and a 12-month sparkline.
- Header controls for the month, MTD or YTD, the comparison (Target, PY or Prior Month) and the KPI set (1-10 or 11-20).
- Direction-aware status – 8 upper-the-better KPIs and 2 lower-the-better KPIs.
- KPI Analysis page with RAG counts, achievement by group, and Top 5 and Bottom 5 KPIs.
- KPI Trend page with four 12-month charts for any one KPI.
- Editable RAG bands, room for 20 KPIs, and 100% formulas with no macros.
The 10 Junk Removal KPIs
Every KPI is defined on the KPI Definition sheet with its group, unit, formula, definition, direction and YTD basis. The defaults are:
| Group | KPI | Unit | Direction | What it measures |
|---|---|---|---|---|
| Operations | Jobs Completed | Count | UTB | Junk removal and hauling jobs completed during the month |
| Operations | Volume Hauled | Cubic Yards | UTB | Total volume of junk and debris hauled away across all jobs |
| Operations | Avg Job Duration | Hours | LTB | Average on-site hours to load, haul and clear a single job |
| Service Quality | On-Time Arrival | % | UTB | Jobs where the crew arrived inside the booked time window |
| Service Quality | Customer Satisfaction | % | UTB | Average score from post-job surveys |
| Service Quality | Recycling Diversion Rate | % | UTB | Hauled volume diverted from landfill through recycling or donation |
| Financial | Service Revenue | USD (000s) | UTB | Invoiced revenue from junk removal and hauling services |
| Financial | Revenue per Job | USD | UTB | Average invoiced revenue per completed job |
| Financial | Disposal Cost per Ton | USD | LTB | Average landfill tipping and disposal cost per ton |
| Sales | Quote-to-Booking Rate | % | UTB | Issued quotes that converted into a booked job |
Scorecard Pages Explained
Home
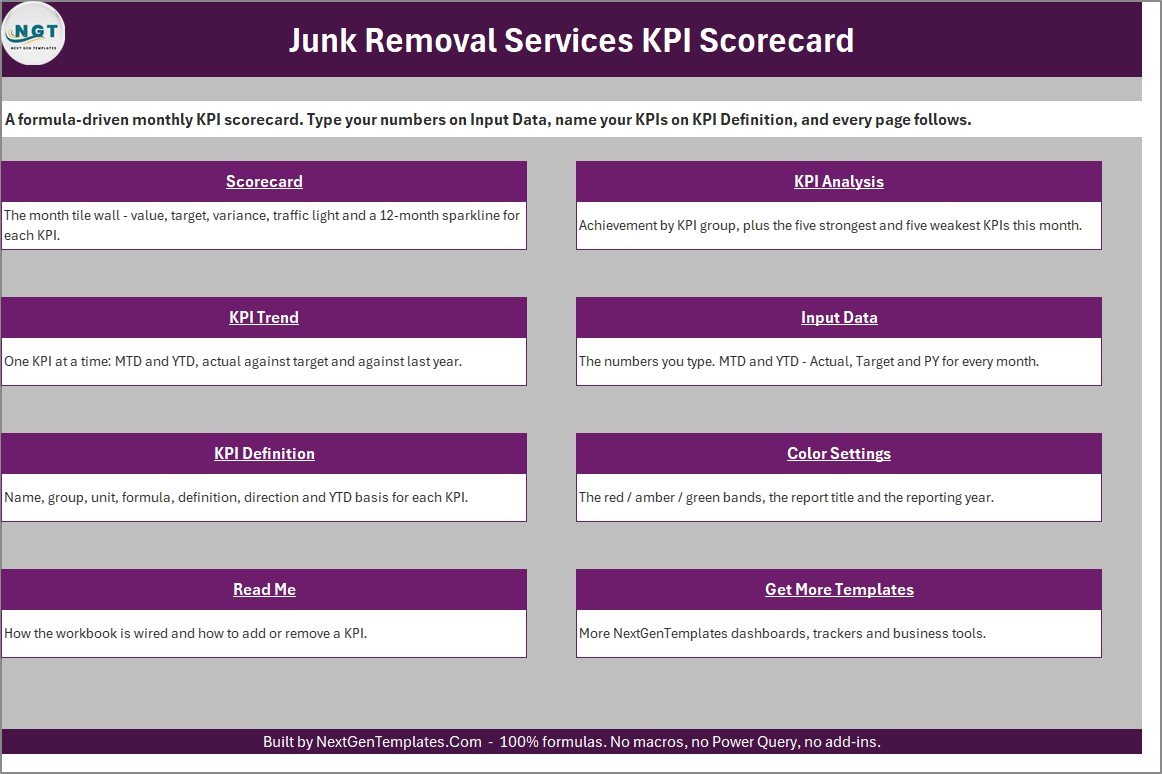
The Home page gives a one-line description and a link card for each sheet, so a new user knows where to type and where to read.
Scorecard
The tile wall is the page you review first. In the August 2026 sample, Jobs Completed is 493 against a 483 target (green), On-Time Arrival is 92.1% against 91.2% (green), Service Revenue is $364.5K against $353.9K (green) and Quote-to-Booking Rate is 36.6% against 35.9% (green). Volume Hauled reads 1,943 cubic yards against 2,003, Avg Job Duration 2.3 hours against 2.2, Customer Satisfaction 81.5% against 83.1% and Revenue per Job $517.8 against $550.8, all amber. Recycling Diversion Rate is 46.6% against 54.2%, and Disposal Cost per Ton is $74.2 against $64.5; because disposal cost is lower-the-better, that 15% rise turns it red rather than green. The sample month ends with four green, four amber and two red KPIs.
KPI Analysis
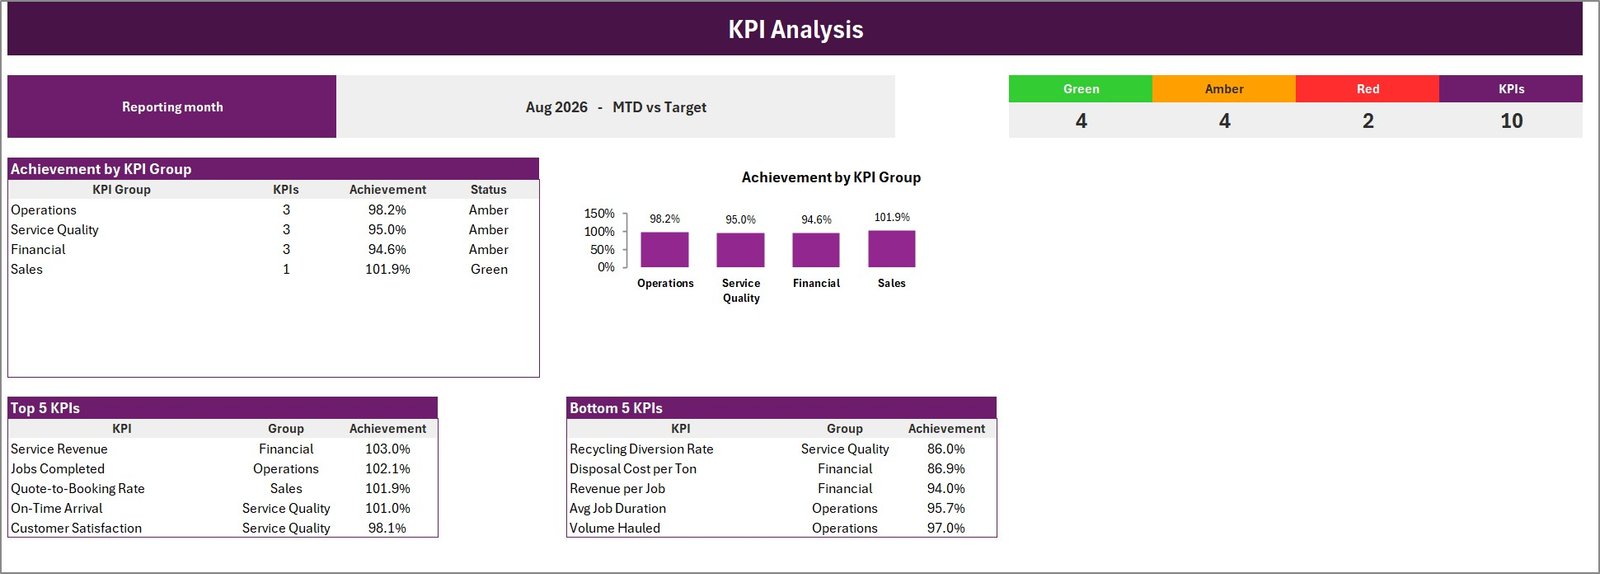
KPI Analysis counts the lights (Green 4, Amber 4, Red 2, KPIs 10) and shows Achievement by KPI Group as both a table and a column chart: Operations 98.2%, Service Quality 95.0%, Financial 94.6% and Sales 101.9%. Below that, Top 5 KPIs (led by Service Revenue at 103.0% and Jobs Completed at 102.1%) and Bottom 5 KPIs (led by Recycling Diversion Rate at 86.0% and Disposal Cost per Ton at 86.9%) tell you where to look first.
KPI Trend
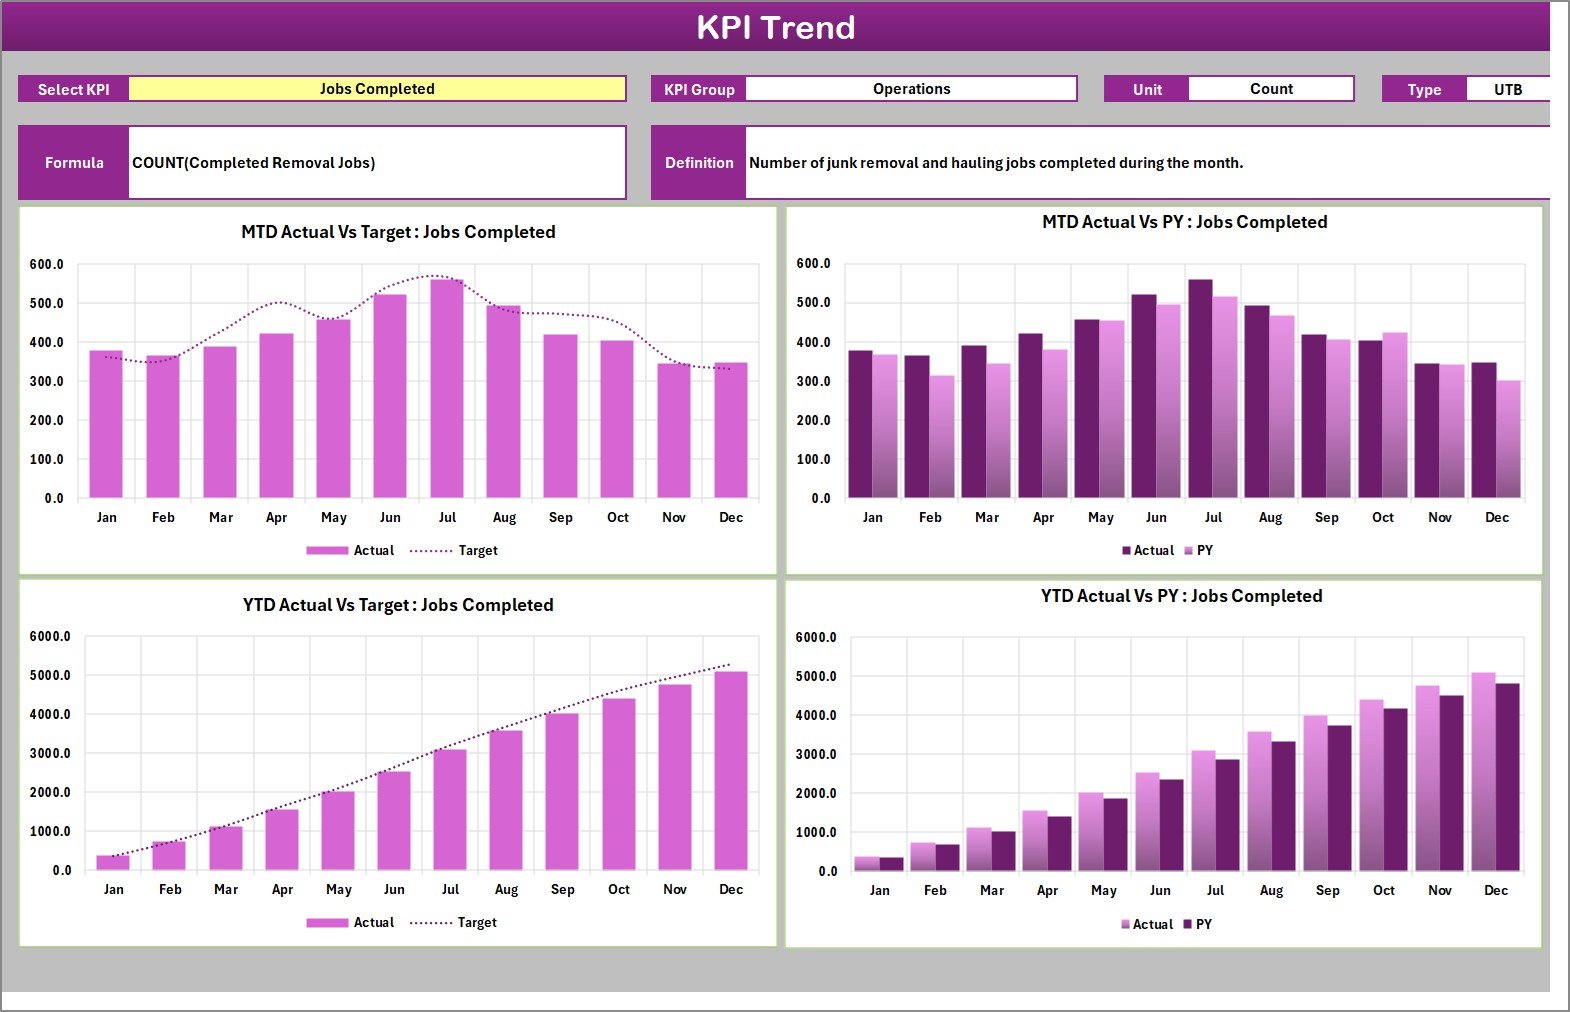
Select any KPI and the Trend page shows its group, unit, type, formula and definition, followed by MTD Actual vs Target, MTD Actual vs PY, YTD Actual vs Target and YTD Actual vs PY for all twelve months. For Jobs Completed, the summer peak (521 jobs in June and 560 in July) is visible at a glance, and the year closes at 5,107 jobs against a 5,299 target and 4,811 the year before.
Input Data and KPI Definition
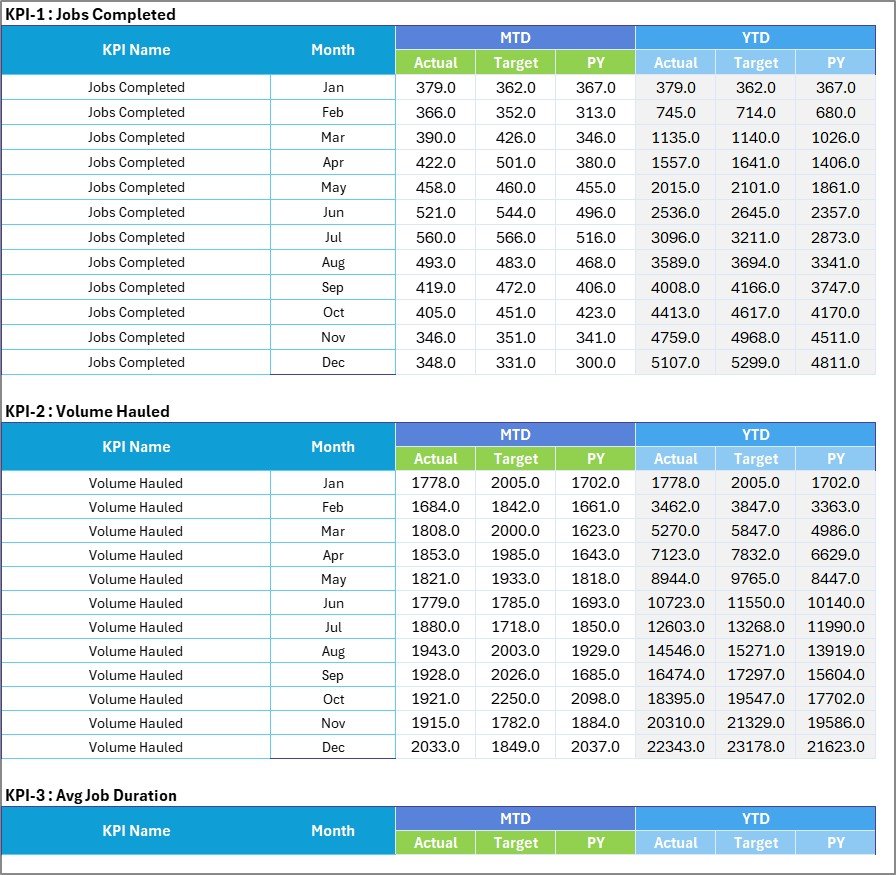
These are the only two sheets you edit. Input Data has a numbered block per KPI with twelve month rows and MTD Actual, Target and PY plus YTD Actual, Target and PY. KPI Definition holds the names and rules, and its Check column turns red if two KPIs share a name. Jobs Completed, Volume Hauled and Service Revenue roll up as a sum; the other seven roll up as an average.

Color Settings and Read Me
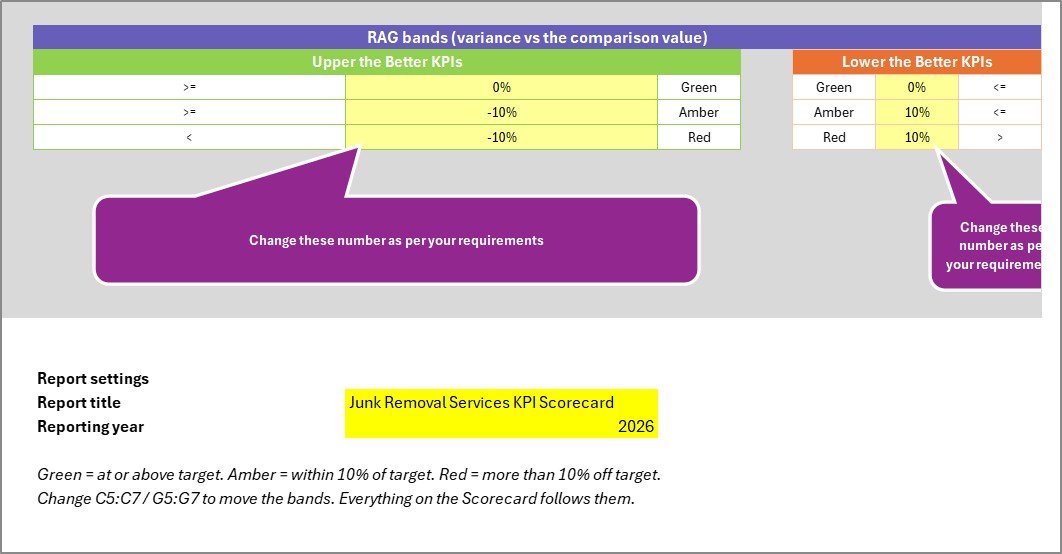
Color Settings holds separate RAG bands for upper-the-better and lower-the-better KPIs (by default green at or better than target, amber within 10%, red beyond 10%), plus the report title and reporting year. Read Me documents how the workbook is wired, how to add a KPI and what each header control does. Microsoft’s own guide to conditional formatting in Excel is a useful companion if you want to restyle the lights, and the Excel help and learning hub covers the basics.
Excel Scorecard vs. Junk Removal Software
| Decision point | This Excel scorecard | Junk removal software |
|---|---|---|
| Cost | One-time purchase | Monthly subscription |
| Platform | Desktop Excel 2016 or later | Cloud and mobile |
| Data control | Local file | Vendor-hosted |
| Macros | None | Not applicable |
| Best fit | Monthly KPI review | Booking, dispatch, routing, invoicing |
Hauling and service-call businesses tend to share the same review rhythm, so the Home Renovation Contractor KPI Scorecard in Excel is worth a look if your crews also handle clean-outs after renovation work.
Advantages of a Junk Removal KPI Scorecard
- One page per month: the owner, the operations manager and the crew leads read the same ten numbers.
- Cost sits beside revenue: Disposal Cost per Ton and Revenue per Job are reviewed next to Service Revenue, so a busy month that earns less per job is easy to spot.
- Diversion is tracked, not assumed: Recycling Diversion Rate shows how much hauled volume was recycled or donated instead of dumped.
- Seasonality is visible: sparklines and the Trend page show the summer rush rather than judging one month alone.
- No subscription and no macros: the file stays on your computer and opens without security prompts.
Best Practices for Using the Scorecard
- Agree each KPI definition with the team before the first month, for example what counts as an on-time arrival, then leave it stable.
- Record your YTD rule (sum or average) in the YTD Basis column, because the workbook takes YTD as typed.
- Read Volume Hauled together with Avg Job Duration: bigger loads usually mean longer jobs, so judge the two side by side.
- Take Disposal Cost per Ton from your own tipping receipts each month so the figure matches what you actually paid.
- Save one copy per reporting year.
Things to Know Before You Buy
Every number is typed: the scorecard does not connect to booking, dispatch, routing or accounting software, and YTD is not calculated for you. The header dropdowns and MTD / YTD buttons are Excel form controls, so use desktop Excel rather than Excel for the web. One file covers one reporting year, and a blank or zero comparison value reads n/a. The Read Me mentions a “Sep-25” picker style while the shipped picker shows “Aug-2026”; that is cosmetic only. The sample data is fictional, and the template makes no environmental, recycling-certification or regulatory compliance claim.
Frequently Asked Questions
Does the scorecard need macros?
No. It is a standard .xlsx built on formulas, conditional formatting, camera pictures and sparklines.
Can I add more KPIs?
Yes, up to 20. Add the KPI on KPI Definition, fill its block on Input Data and switch the Scorecard to KPI 11-20.
Can I use it for a dumpster rental or demolition clean-up business?
Yes, if you rename the KPIs to suit. The defaults are written for junk removal and hauling work.
What is in the download?
A ZIP with the .xlsx workbook and the Excel KPI Scorecard user manual in PDF.
Related Scorecards on PK: An Excel Expert
- Fencing Contractor KPI Scorecard in Excel
- Carpentry Workshop KPI Scorecard in Excel
- Electrical Contractor KPI Scorecard in Excel
Conclusion
The Junk Removal Services KPI Scorecard in Excel gives a hauling business one honest monthly view of volume, service, cost and sales, with lights that respect whether higher or lower is better. Replace the sample numbers with your own, set your bands, and review the month in minutes. Get the Junk Removal Services KPI Scorecard in Excel on NextGenTemplates, and find more walkthroughs on PK: An Excel Expert on YouTube.