The Boiler Maintenance KPI Dashboard in Excel is a ready-to-use monthly reporting workbook for boiler servicing and heating-maintenance teams. It tracks twelve editable KPIs across service quality, safety, delivery, workforce, commercial performance, customer experience, cost and sustainability. Select a month and the workbook displays MTD and YTD actuals, targets, achievement, traffic-light status, prior-year values and movement. It is a reporting tool, not a work-order system or a safety certification platform, and it uses ordinary Excel formulas with no macros or add-ins.
Download the Boiler Maintenance KPI Dashboard in Excel from NextGenTemplates.
Key Features of the Boiler Maintenance KPI Dashboard in Excel
The workbook is designed around a monthly management rhythm. Its month selector controls the dashboard and analysis view, while each KPI carries a UTB or LTB type so lower-is-better measures such as response time, callback rate and parts cost are scored in the right direction.
- Twelve prefilled boiler-maintenance KPIs, all editable.
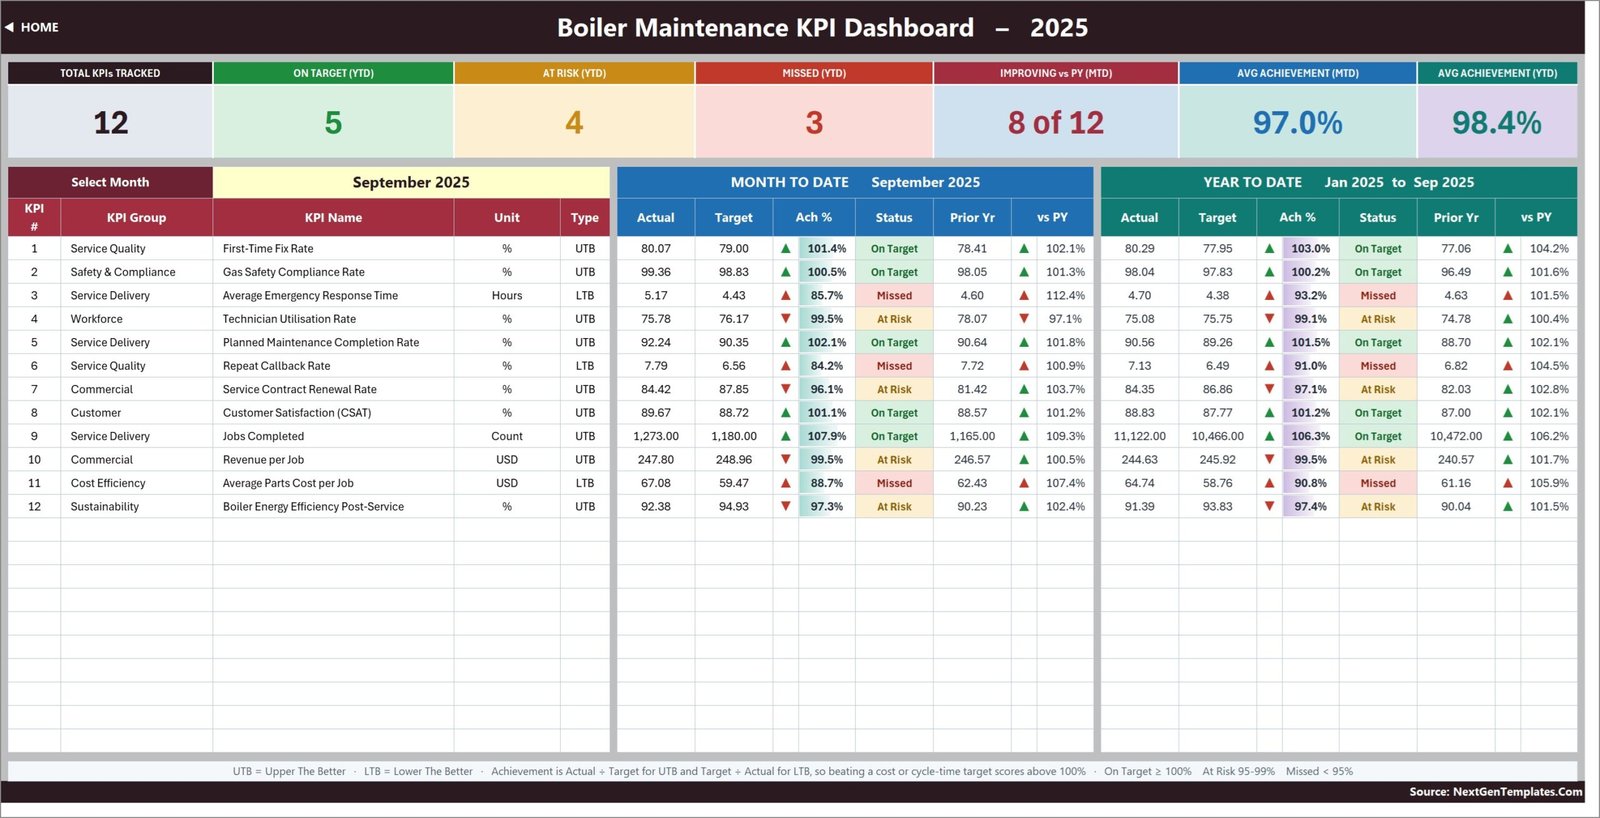
- Seven summary cards for tracked, on-target, at-risk, missed and improving KPIs plus average MTD/YTD achievement.
- MTD and YTD actual, target, achievement, status, prior year and movement on the same row.
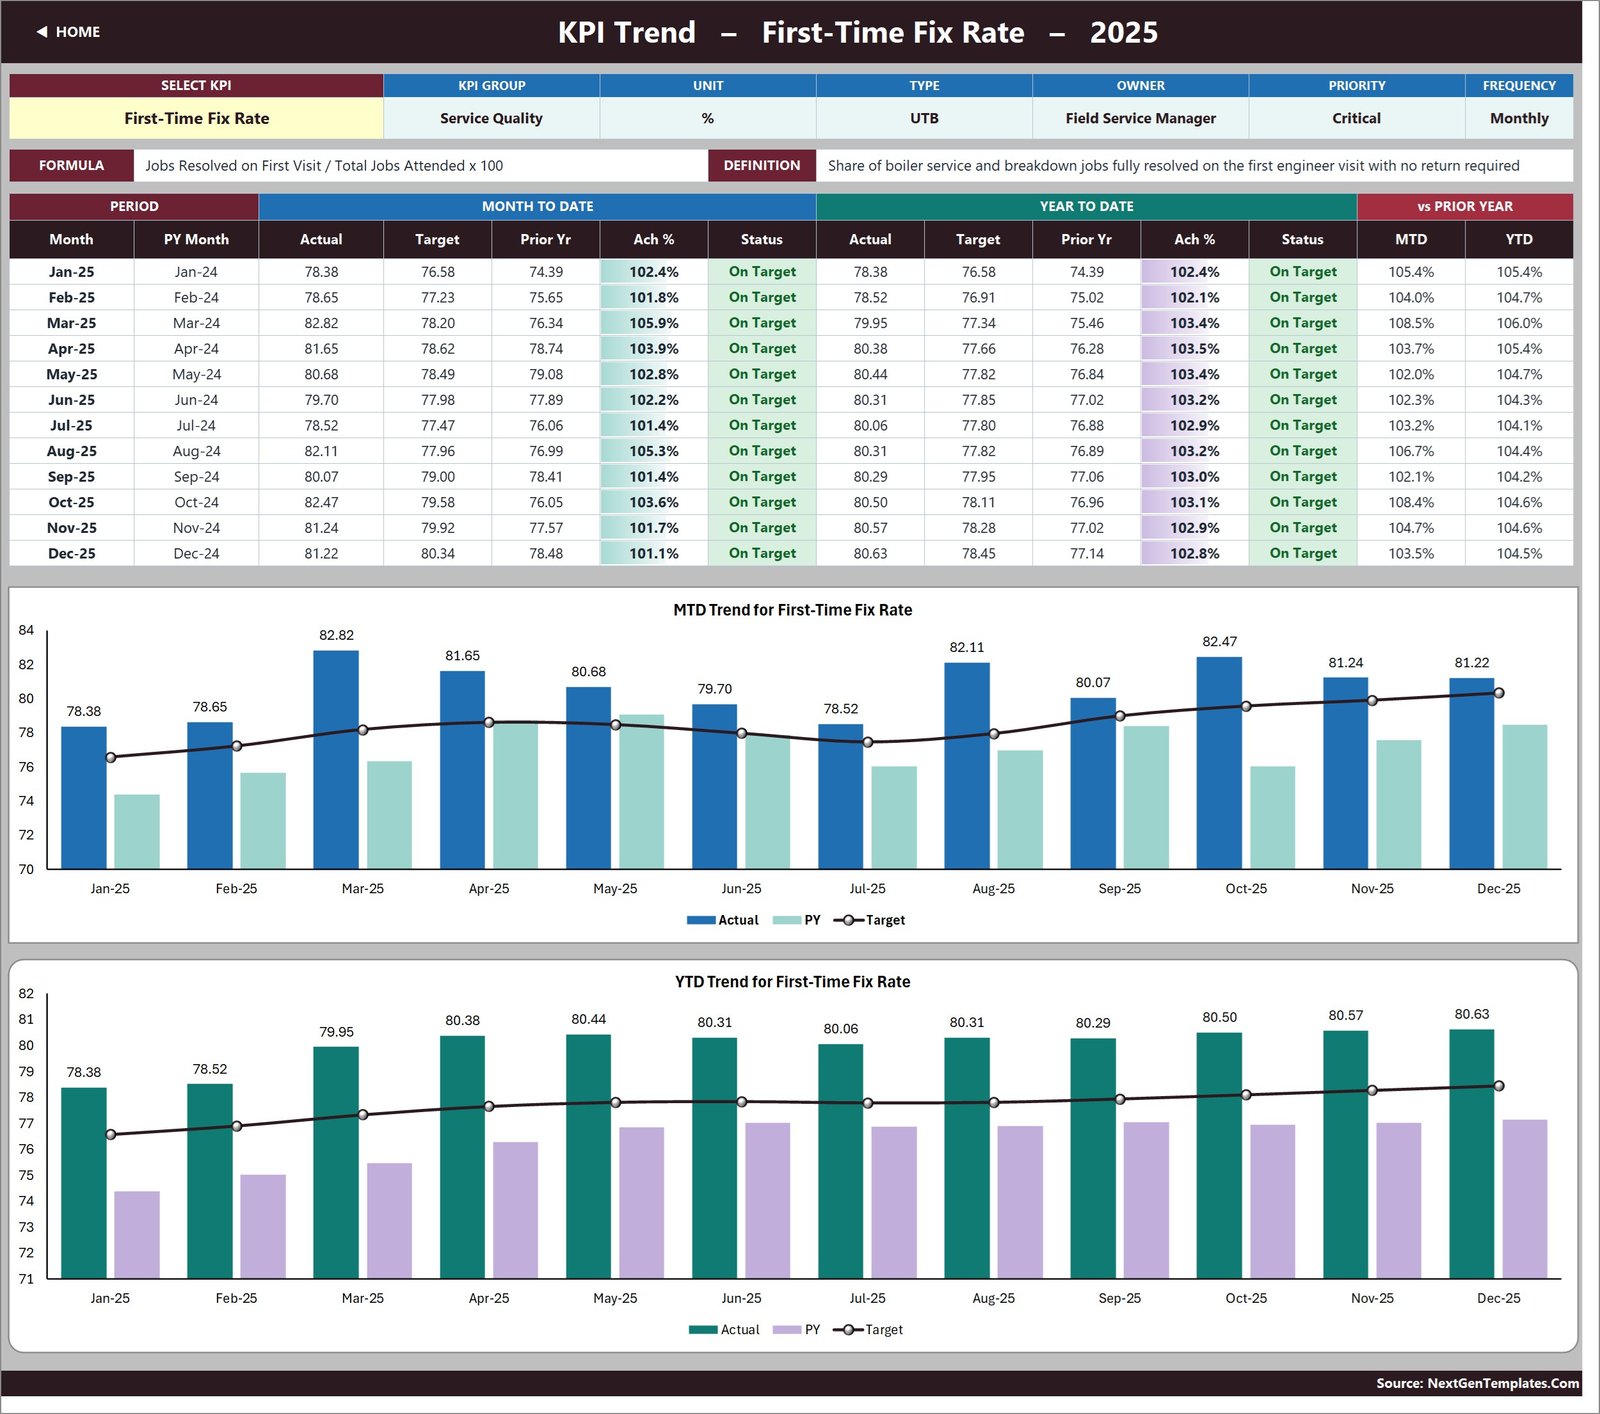
- A KPI Trend page with a selector, attributes, formula, definition, monthly table and two charts.
- A KPI Analysis page with group roll-up, average achievement, top five and bottom five performers.
- Three clearly separated input sheets for actual, target and previous-year values.
- A master KPI Definition sheet that drives the connected pages and supports up to 22 KPI rows.
The phrases boiler maintenance dashboard Excel, Excel KPI dashboard for boiler services, boiler service KPI template and maintenance KPI dashboard describe the workbook accurately: it is a reusable Excel reporting layer for monthly, already-calculated business measures.
Dashboard Pages Explanation
Home
The Home sheet is a navigation page. It separates dashboard pages, editable input sheets and reference/help pages, and explains the formula-driven design.
KPI Dashboard
The main page shows twelve KPI rows for the selected month. The sample set includes First-Time Fix Rate, Gas Safety Compliance Rate, Average Emergency Response Time, Technician Utilisation Rate, Planned Maintenance Completion Rate, Repeat Callback Rate, Service Contract Renewal Rate, Customer Satisfaction, Jobs Completed, Revenue per Job, Average Parts Cost per Job and Boiler Energy Efficiency Post-Service.
KPI Trend
Choose one KPI to see its group, unit, type, owner, priority, frequency, formula and definition. The table runs through twelve months, and the MTD/YTD charts compare actual, target and prior-year values.
KPI Analysis
This page groups achievement by KPI category, counts on-target, at-risk and missed measures, and surfaces the top five and bottom five YTD results. It is useful for moving a review from the overall score to the metrics that need investigation.
Input and Definition Sheets
KPI Input – Actual, KPI Input – Target and KPI Input – PY are the normal data-entry pages. KPI Definition stores each metric’s name, group, unit, formula, definition, UTB/LTB type, owner, priority and frequency. Changing the definition list flows through the connected sheets without rewriting formulas.
Boiler Maintenance KPI Dashboard in Excel vs. Google Sheets vs. Paid Field-Service SaaS – Feature Comparison
| Feature | This Excel dashboard | Google Sheets alternative | Field-service SaaS |
|---|---|---|---|
| Pricing | One-off download | Often one-off | Recurring subscription |
| Primary purpose | Monthly KPI review | Shared monthly KPI review | Operations, dispatch and customer workflows |
| Custom KPI definitions | Fully editable | Usually editable | Vendor-dependent |
| Work-order automation | No | No | Often yes |
| Collaboration | OneDrive/SharePoint | Native browser sharing | Native vendor access |
| Best buyer | Team that already calculates monthly values | Browser-first team | Team replacing its operational stack |
Who Should Use This Template
Service managers can use it to review first-time fix rate, emergency response, jobs completed and callbacks. Compliance leads can monitor an entered gas-safety compliance measure beside an owner and priority. Commercial managers can compare contract renewals, revenue per job and average parts cost against target and prior year. Owners can use the same layout each month without building charts again.
It is not the right fit if you need engineer dispatch, customer records, invoice creation, raw work-order calculations or automatic system integrations. The published Maintenance Work Order Data Entry System in Excel covers data entry, while the HVAC Service Dashboard in Excel is a transaction-style analytical dashboard. The HVAC Service Dashboard in Power BI is useful when Power BI is the preferred reporting platform.
Real-World Use Cases
Monthly service review
A service manager selects the closed month, scans the summary cards and opens KPI Trend for any missed metric. The same format makes month-to-month meetings easier to compare.
Contract-performance meeting
An account manager can present planned-maintenance completion, service-contract renewals and customer satisfaction together, while keeping the business’s own source calculations under its control.
Branch comparison
A multi-branch operator can keep one workbook per branch and use consistent KPI names and thresholds. The template does not merge branches automatically, but the shared structure supports a comparable review process.
Advantages of This Excel KPI Dashboard
The biggest advantage is transparency. The workbook states that it uses ordinary worksheet formulas and no Power Query, Power Pivot or macros. Excel users can trace the logic, change labels and work without installing anything. Direction-aware scoring also avoids the common mistake of treating a lower response time or lower cost as poor performance.
Another advantage is separation: actual, target and prior-year values stay on different sheets, while the dashboard remains presentation-ready. The supplied sample data lets users understand the workflow before replacing any values.
Opportunities for Improvement
The dashboard intentionally does not import raw work orders or calculate the twelve KPIs from job-level data. Teams wanting automation could connect a future version to structured source data, but that would introduce refresh logic and maintenance. Users should also tailor units such as USD if another currency is needed and confirm that the example KPI definitions match their internal governance.
Safety and compliance values deserve particular care: the template visualises a result supplied by the user. It does not validate inspections, produce CP12 documentation or provide regulatory advice.
Best Practices
- Agree the owner, formula and direction for each KPI before entering targets.
- Set the reporting year, then replace all sample actual, target and prior-year values.
- Use consistent MTD and YTD definitions across months.
- Review at-risk and missed measures with source evidence, not colours alone.
- Keep a clean copy before changing formulas or extending beyond the built-in 22-row capacity.
- Use Microsoft’s guidance on Excel help and learning when adapting formulas or collaboration settings.
Explore Relevant Templates
The separate Boiler Maintenance KPI Scorecard in Excel is a compact scorecard sibling, whereas this product includes the dedicated Trend and Analysis pages. For nearby published options on this site, compare the Maintenance Work Order system and the Excel and Power BI HVAC Service dashboards linked above. On the store, browse the broader Excel KPI Dashboard collection after reviewing which reporting style matches your process.
Frequently Asked Questions
Is this a macro-enabled workbook?
No. It is a standard .xlsx file and requires no macros or add-ins.
How many KPIs are included?
Twelve KPIs are populated. The connected sheets are designed with capacity for up to 22 KPI rows.
Can I replace the boiler KPIs?
Yes. Change the master KPI Definition sheet, then enter matching values on the three input sheets.
Does it calculate metrics from raw work orders?
No. You enter the final MTD and YTD values that your business has already calculated.
Is this the Boiler Maintenance KPI Scorecard?
No. This is the Dashboard product with KPI Dashboard, KPI Trend and KPI Analysis pages. The scorecard is a separate product.
Does it guarantee compliance?
No. It reports user-entered values and does not replace inspections, certificates or qualified compliance review.
About the Author
Built by PK – Microsoft Certified Professional with 15+ years of Excel, Google Sheets, and Power BI experience. Founder of NextGenTemplates, reaching 300K+ subscribers across YouTube channels. Every template is hand-built and tested before release.
Conclusion
This boiler-maintenance dashboard gives service teams a structured monthly view without forcing them into a new operational system. It is most useful when KPI calculations already exist and the missing piece is a repeatable, editable management dashboard.
Download the Boiler Maintenance KPI Dashboard in Excel. Follow PK-AnExcelExpert on YouTube for Excel dashboard tutorials.