Payroll, rent and a big supplier bill can land in the same Friday, and a monthly plan will not show it. In this tutorial you build a 13-week cash flow forecast in Excel step by step: weekly receipts and spending, an ending balance that rolls into next week, cash alerts against a minimum bank balance, a chart, a line of credit draw and a base, best and worst scenario switch. No macros. The example is Harbor Point Coffee Roasters in Portland, Oregon.
⬇️ Download the Free Practice Files
Practice + Solution workbooks · 13-week forecast · .zip · Excel 365 / 2021 / 2019
Watch the Video Tutorial
Video Overview
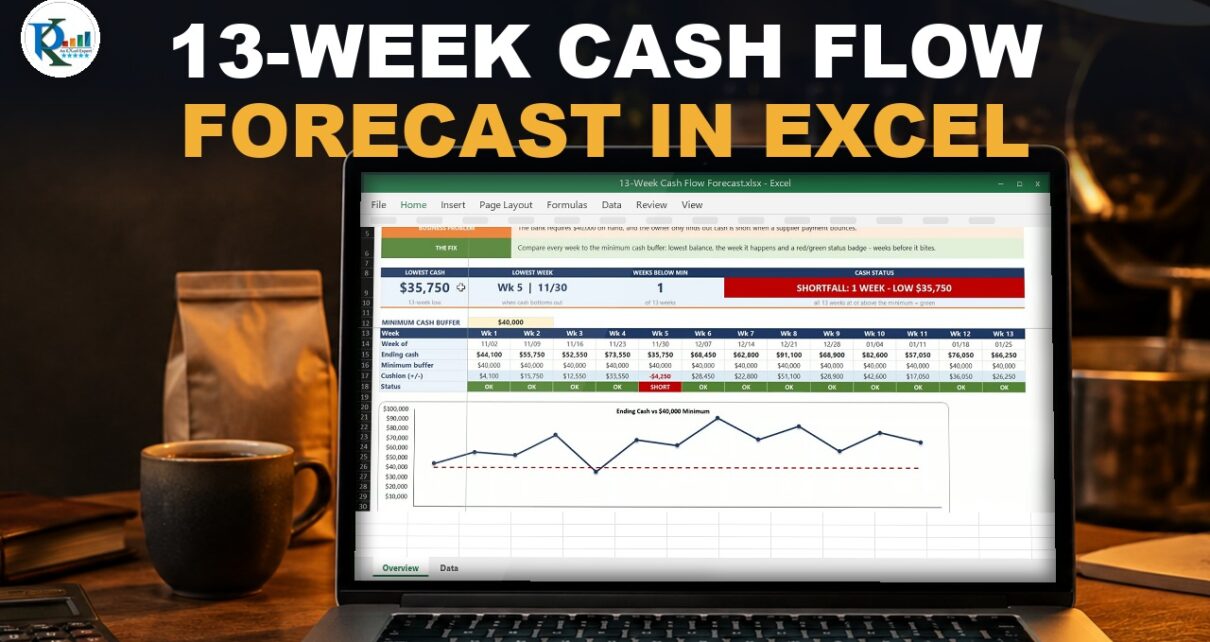
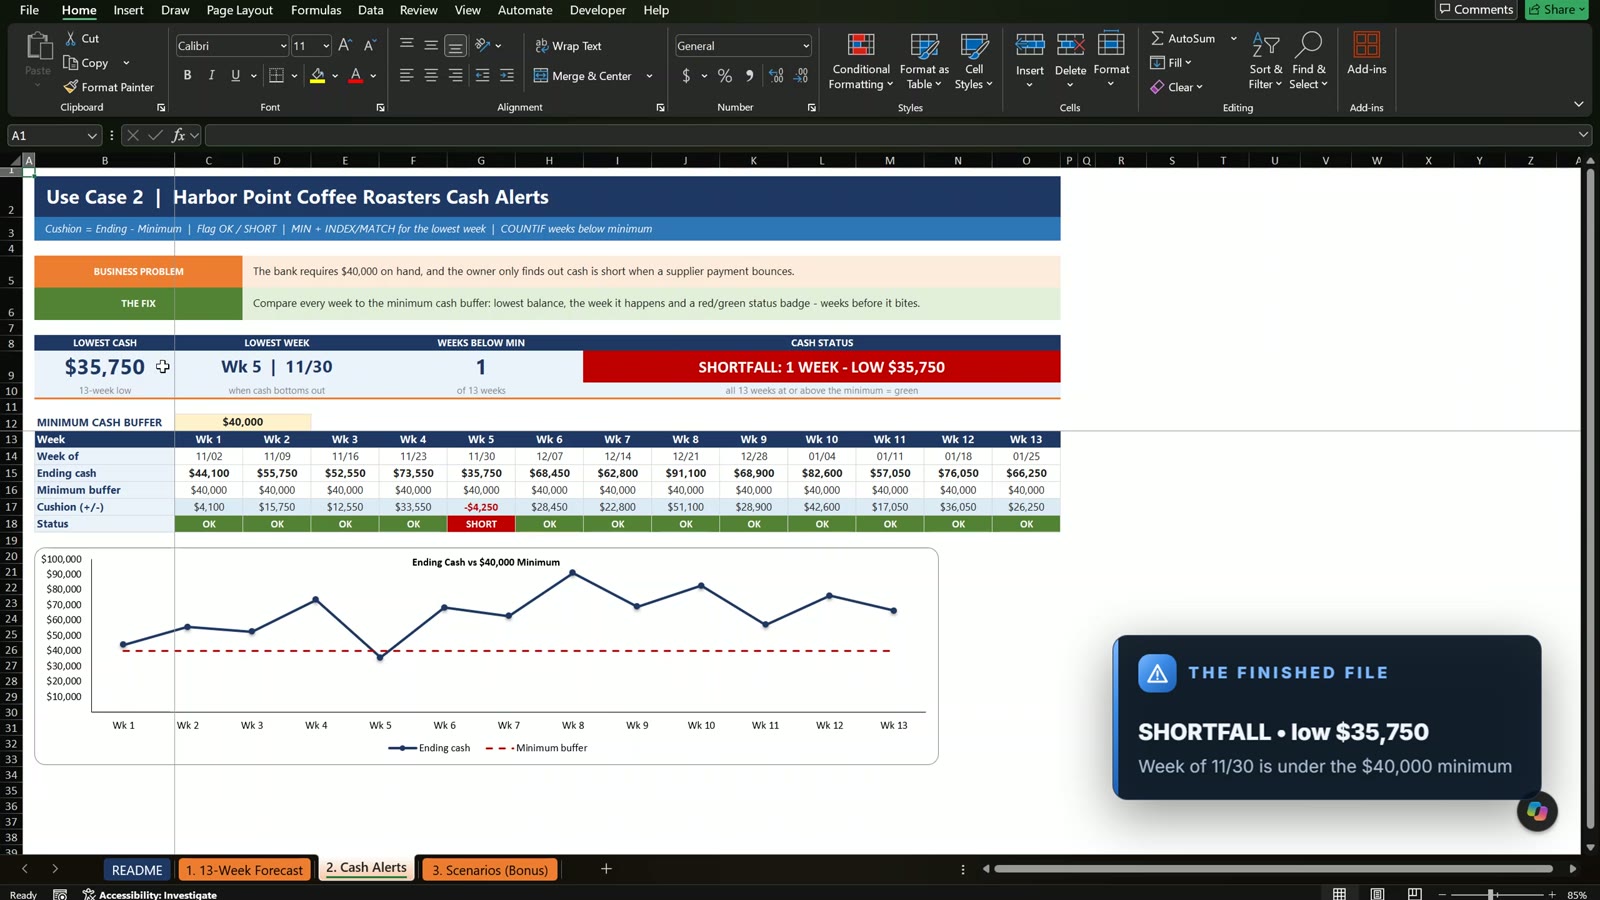
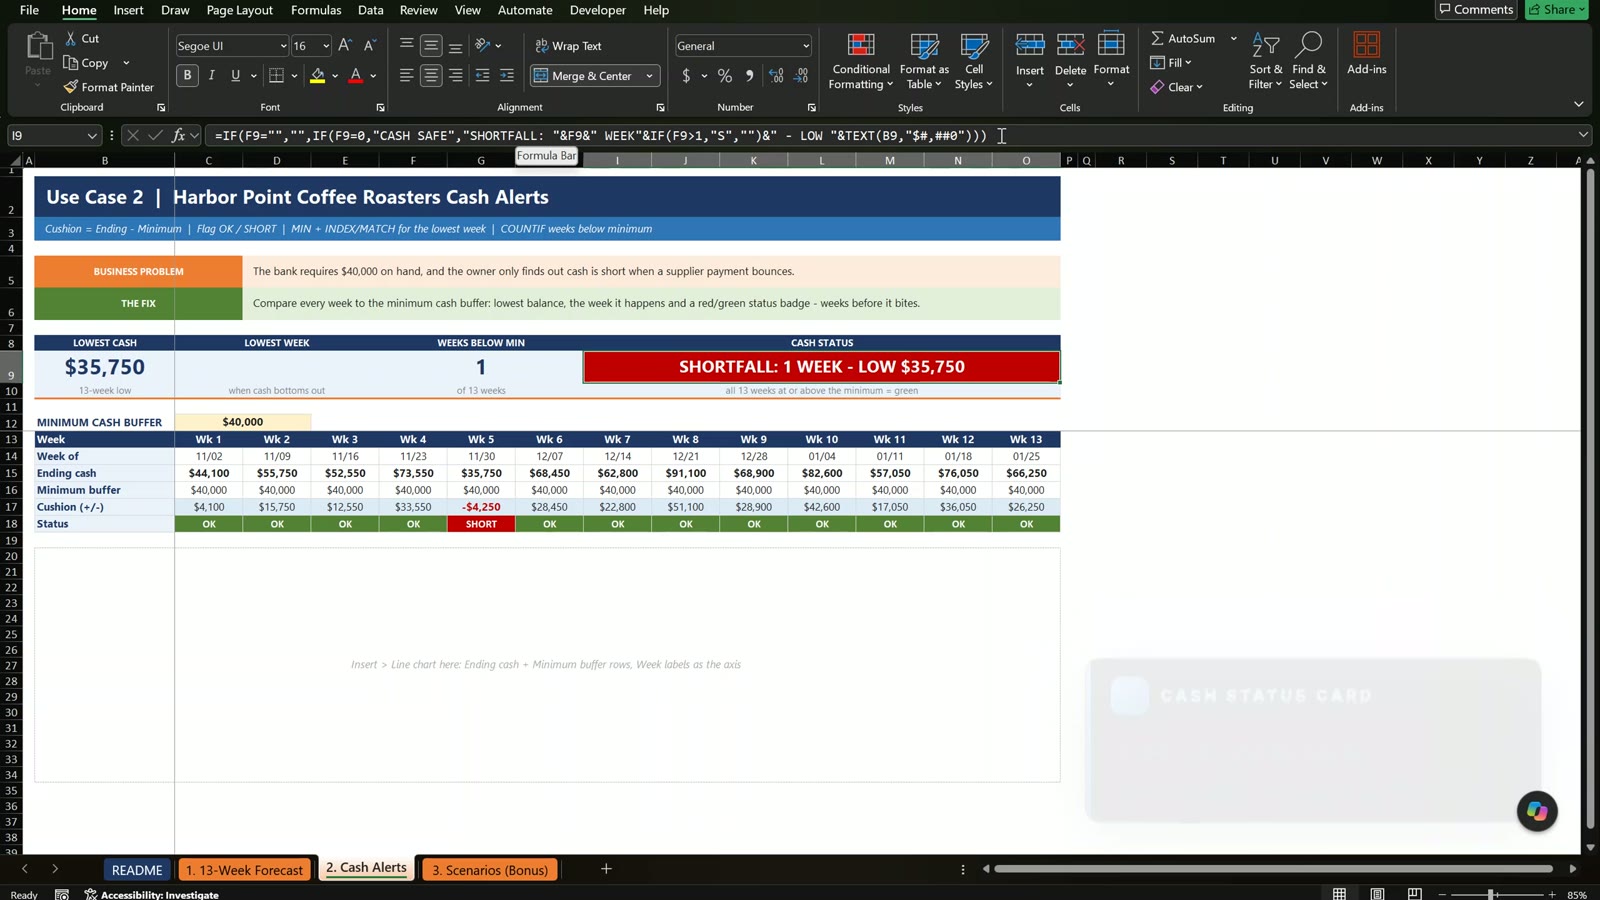
The fifteen-minute video opens with the finished file: cash status says SHORTFALL, low $35,750 in the week of 11/30. Enter a $15,000 line of credit draw in week 5 and it turns green. Then you build it from an empty grid in three use cases and a bonus: the weekly forecast, the cash alerts with a chart, the credit line fix, and a scenario switch.
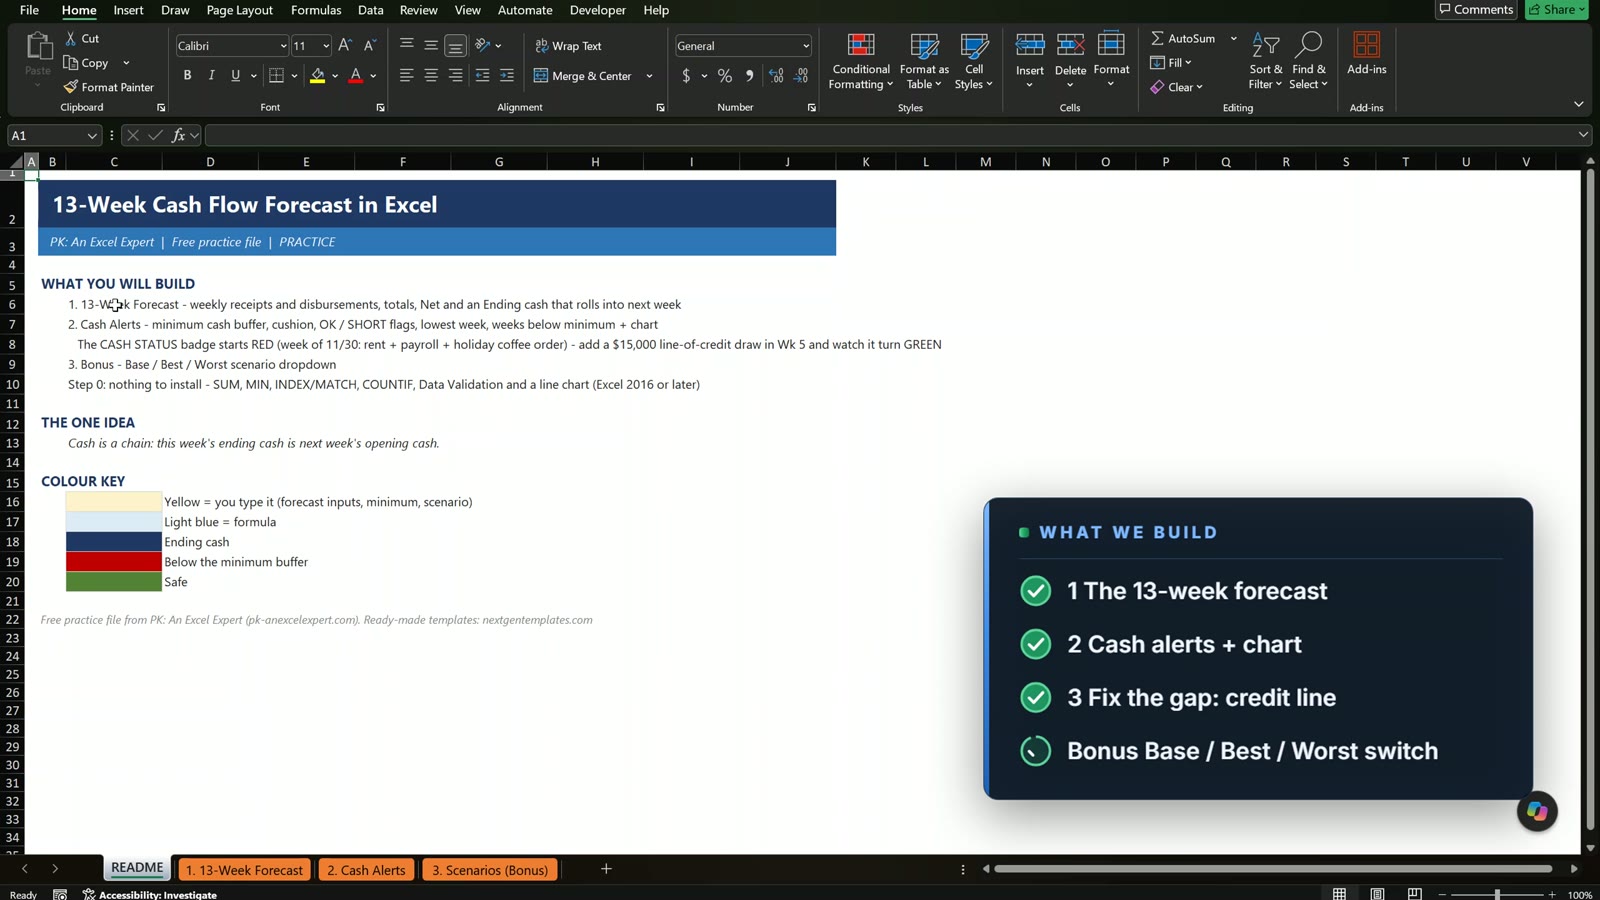
What You Will Build
- 13 weekly columns with dates, totals, net cash flow and ending cash.
- A rolling balance where each opening cash links to last week’s ending cash.
- Cash alerts with a cushion, Short/OK flags, lowest cash and a status card.
- A line chart of ending cash against the minimum.
- Scenarios for base, best and worst case.
The Practice Files and the Data
The business has three cafes, wholesale and online subscriptions. The forecast starts Monday 11/02/2026 with $62,500 in the bank and a $40,000 minimum buffer. The Practice file has the inputs filled in, the Solution file has every formula working. All names and numbers are fictional.
Use Case 1: The 13-Week Forecast
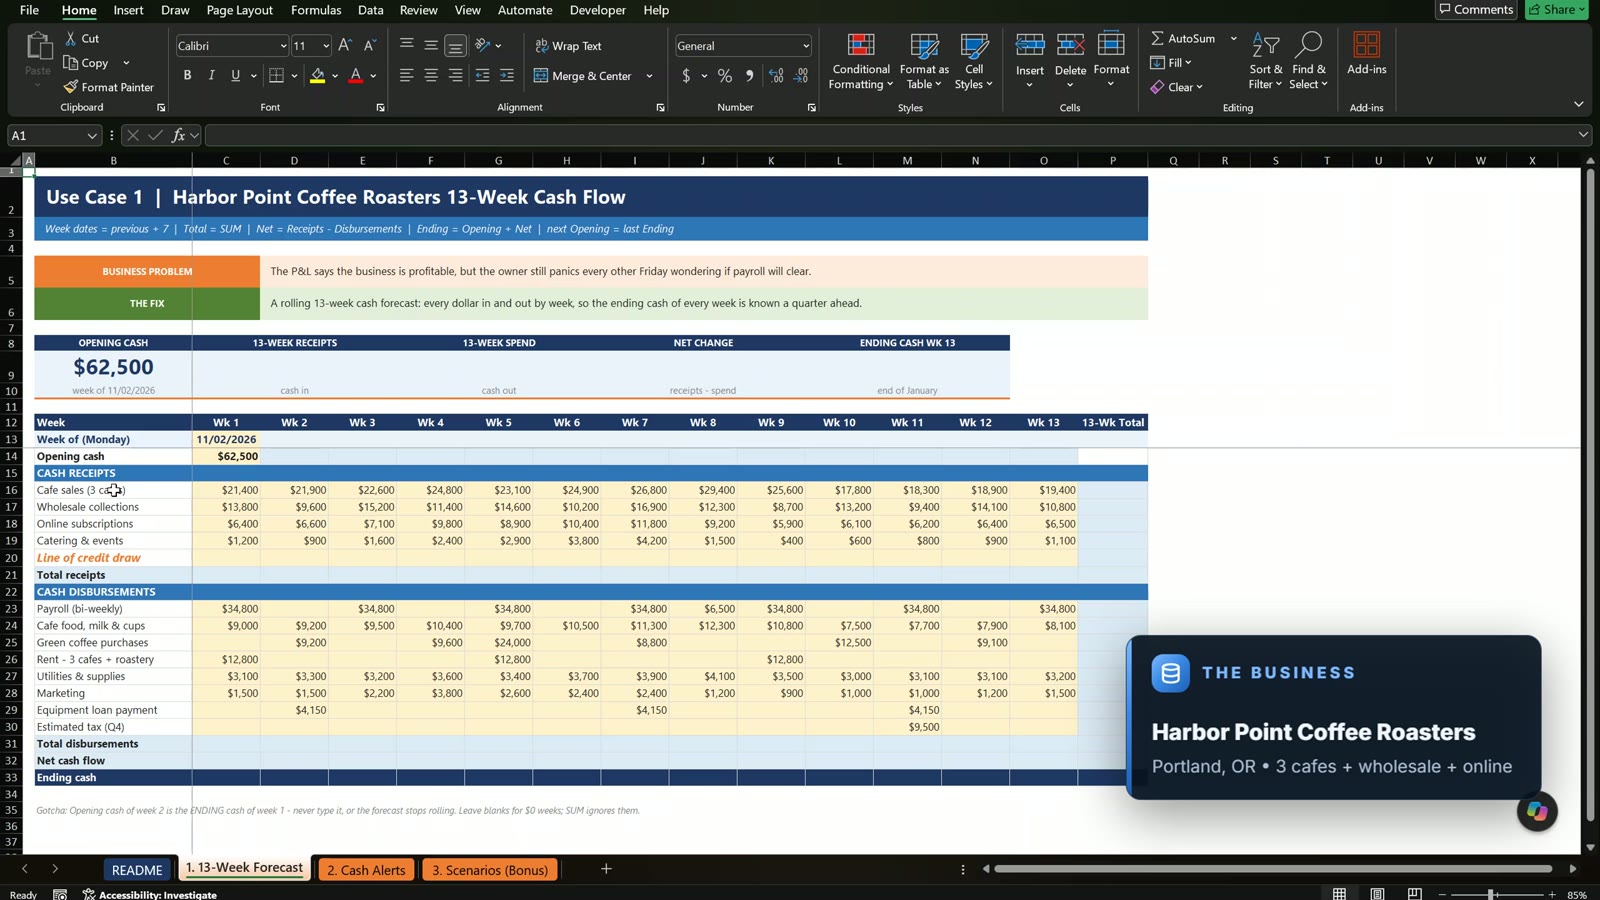
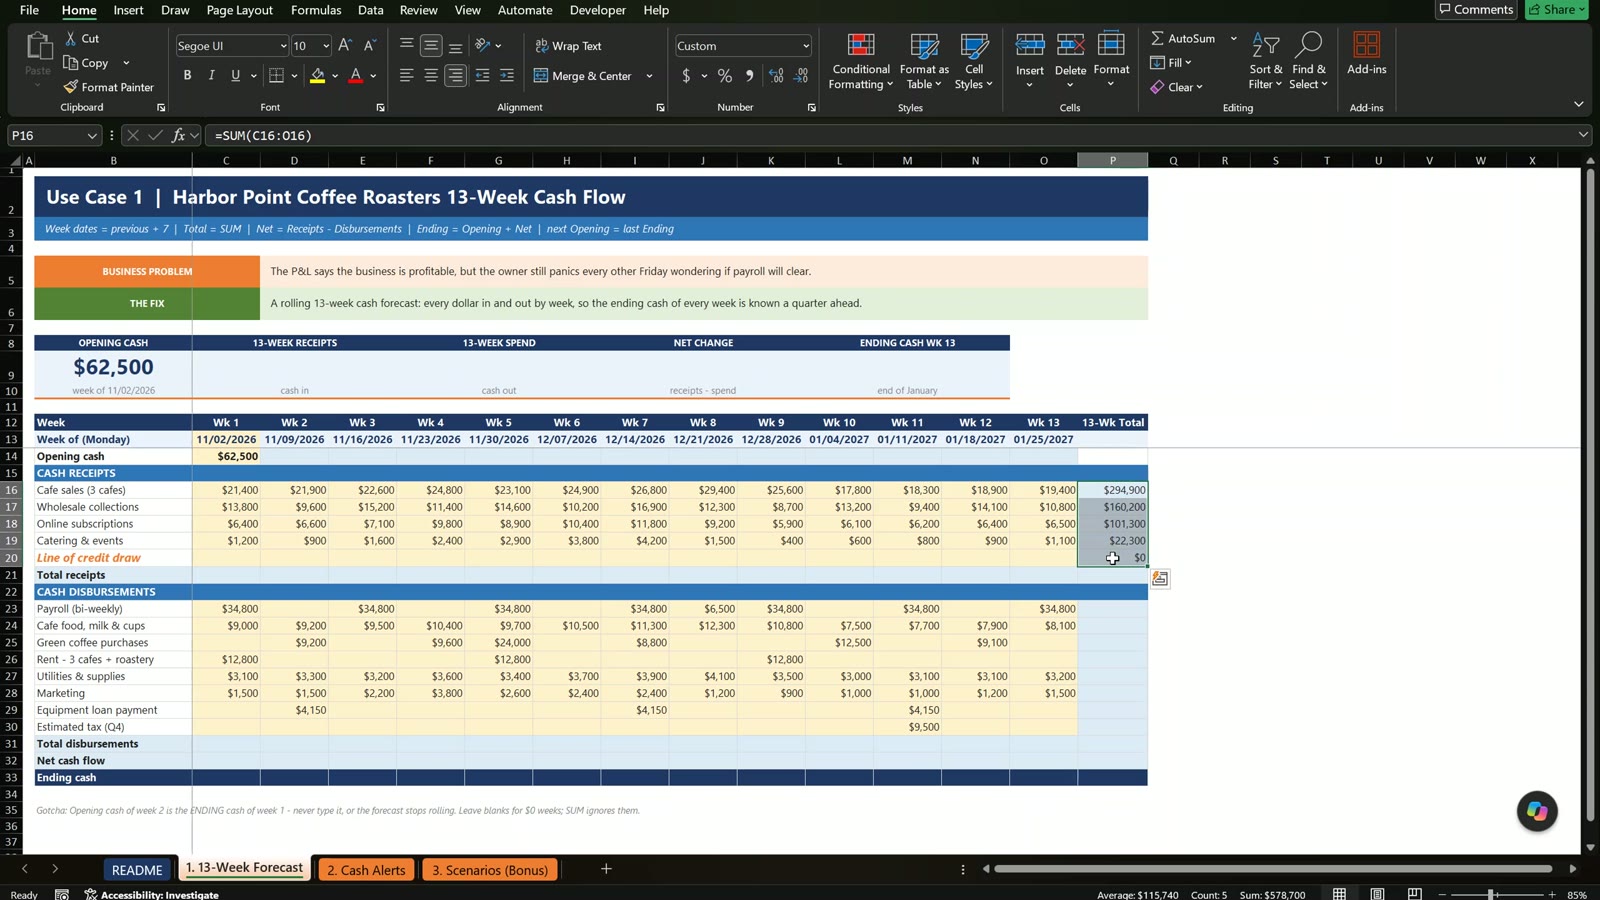
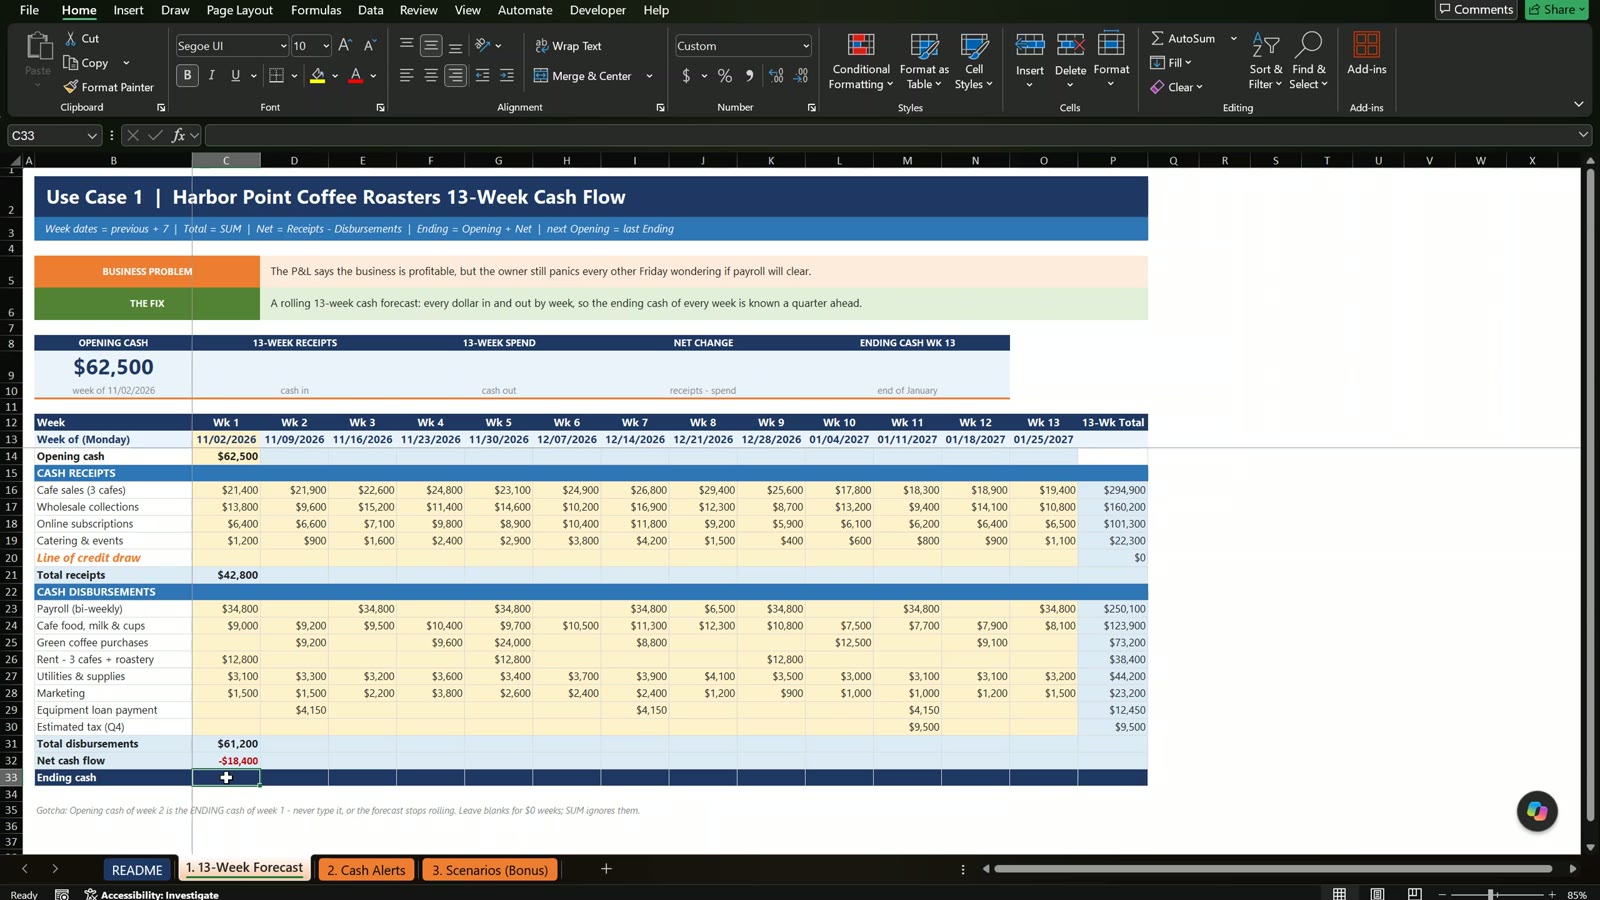
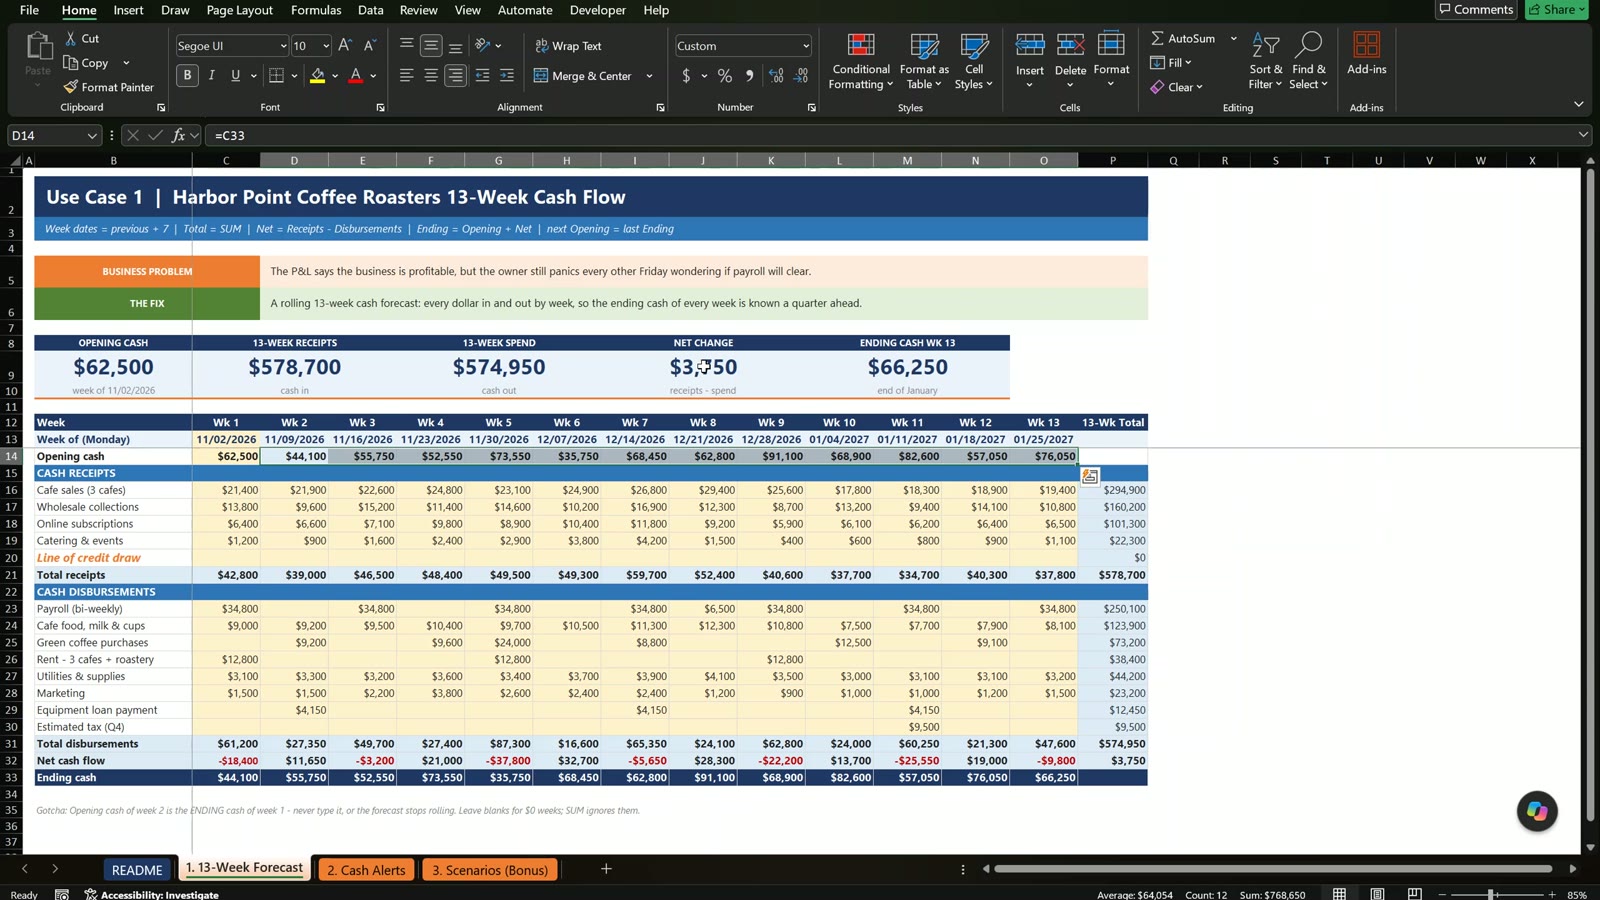
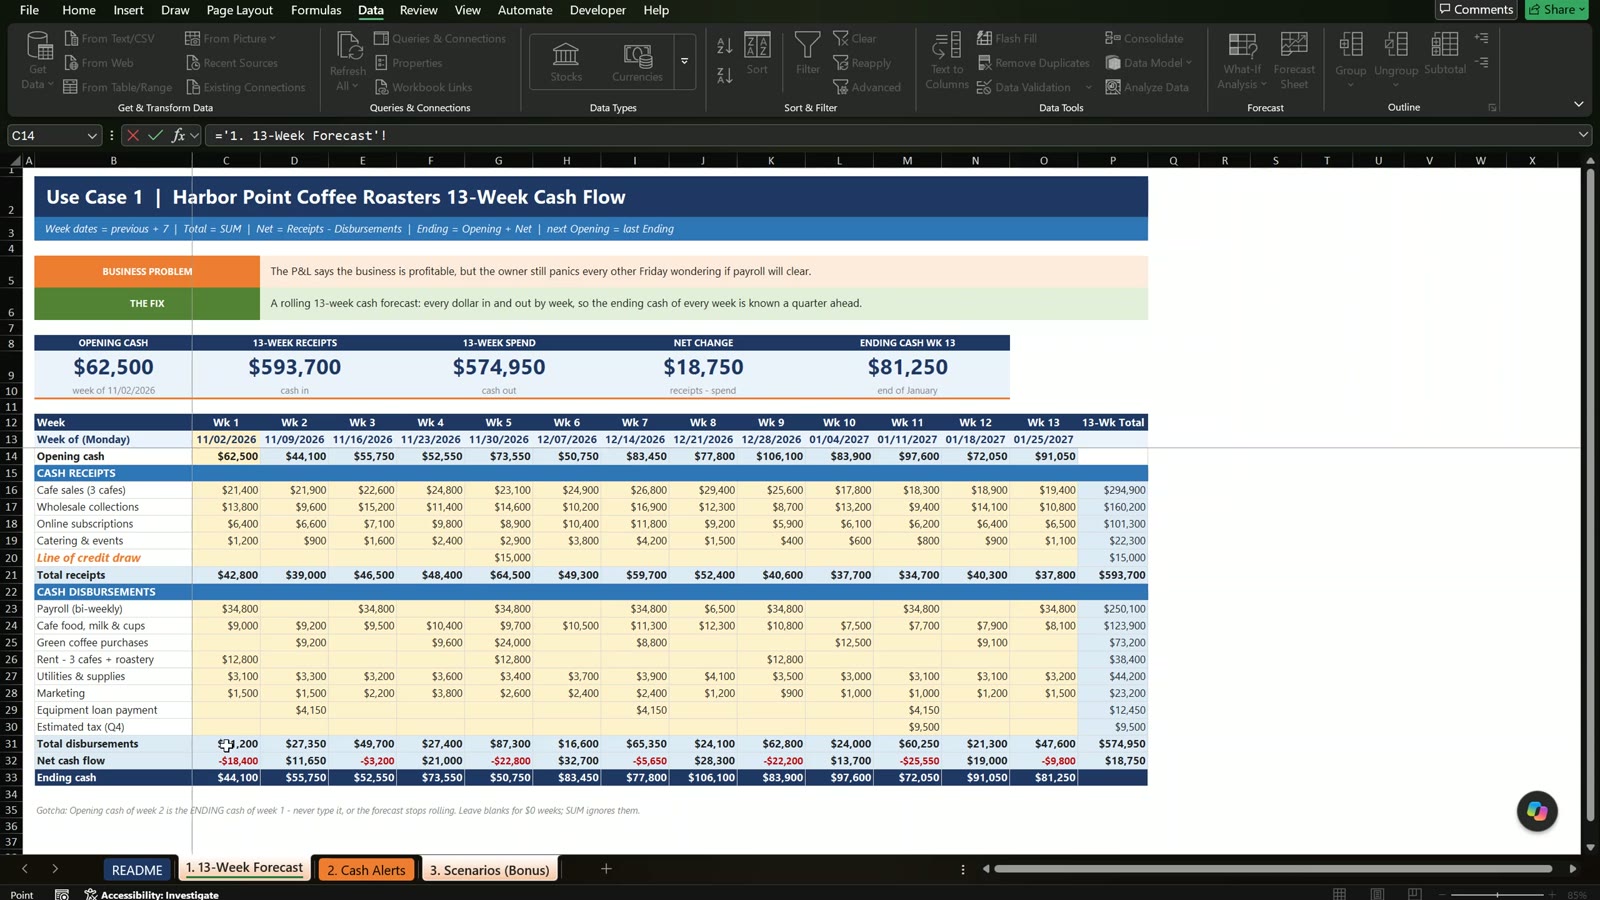
In D13 enter =C13+7 and fill right to O13. In P16 enter =SUM(C16:O16) and fill down for the 13-week totals. Then total receipts =SUM(C16:C20), total disbursements =SUM(C23:C30), net =C21-C31 and ending cash =C14+C32, filled across.
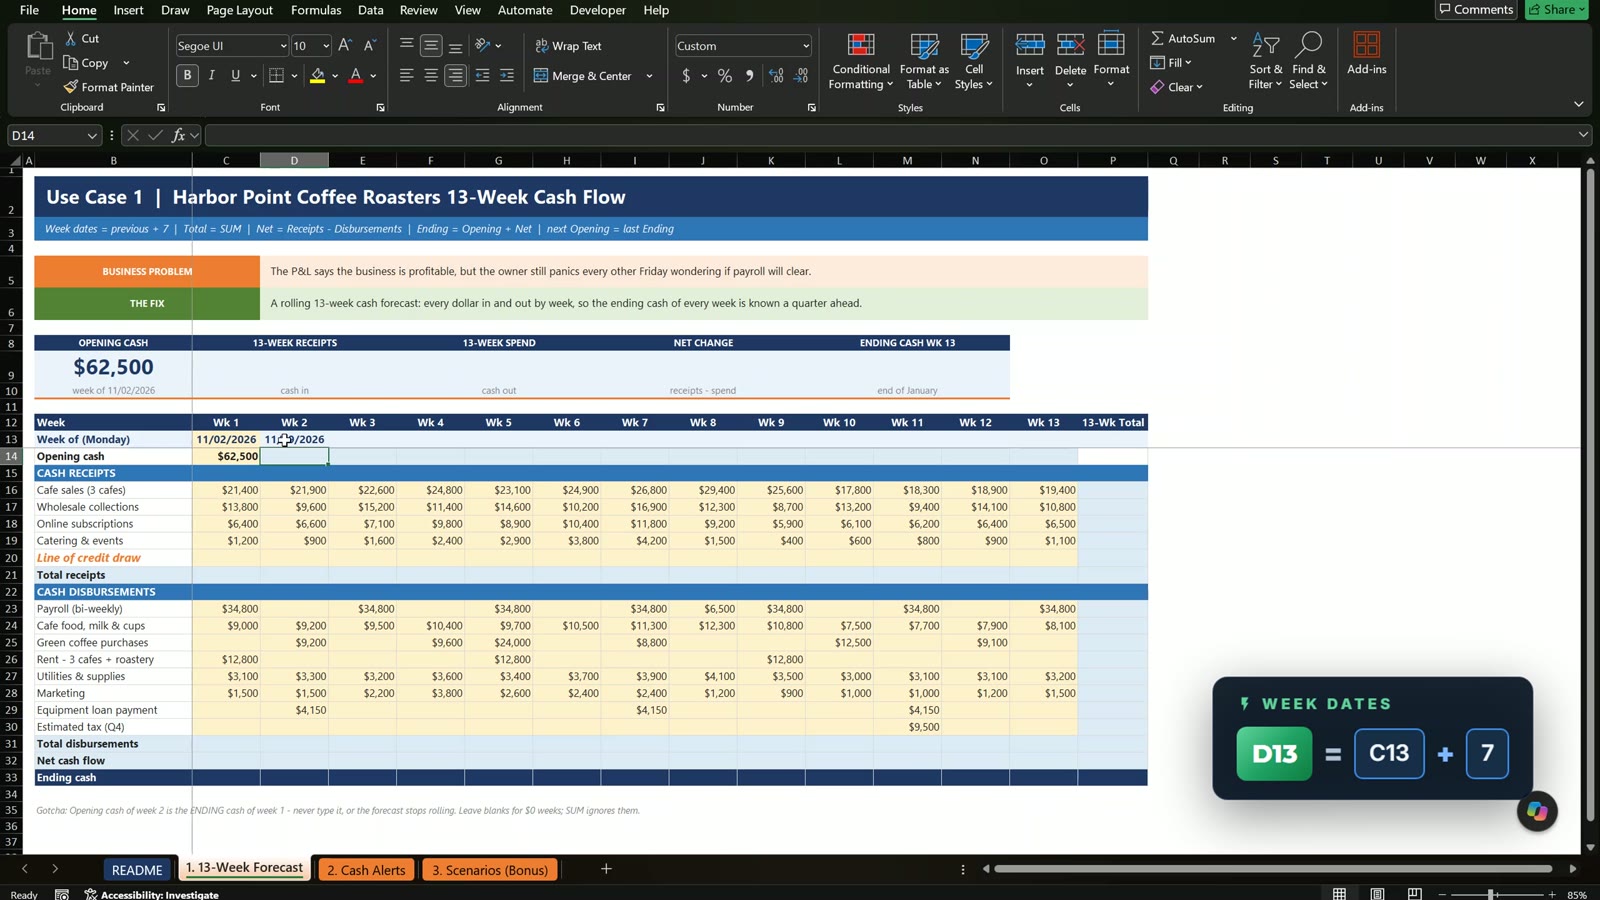
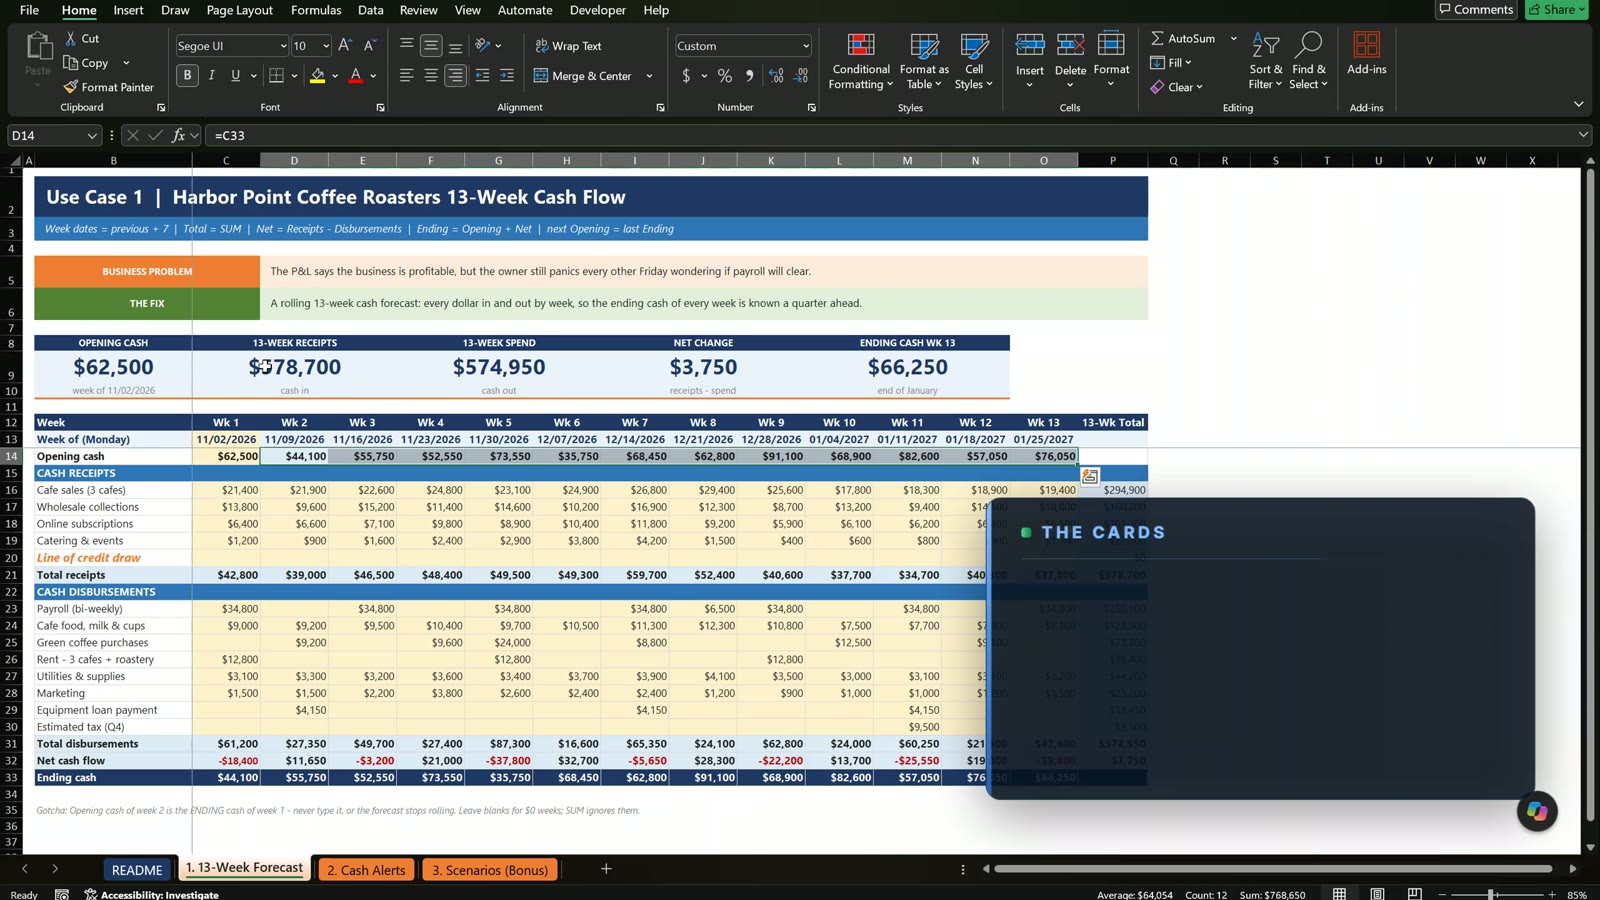
The rule that matters: never type the opening cash after week 1. In D14 enter =C33, the ending cash of week 1, and fill right so the balance rolls through all 13 weeks.
Use Case 2: Cash Alerts
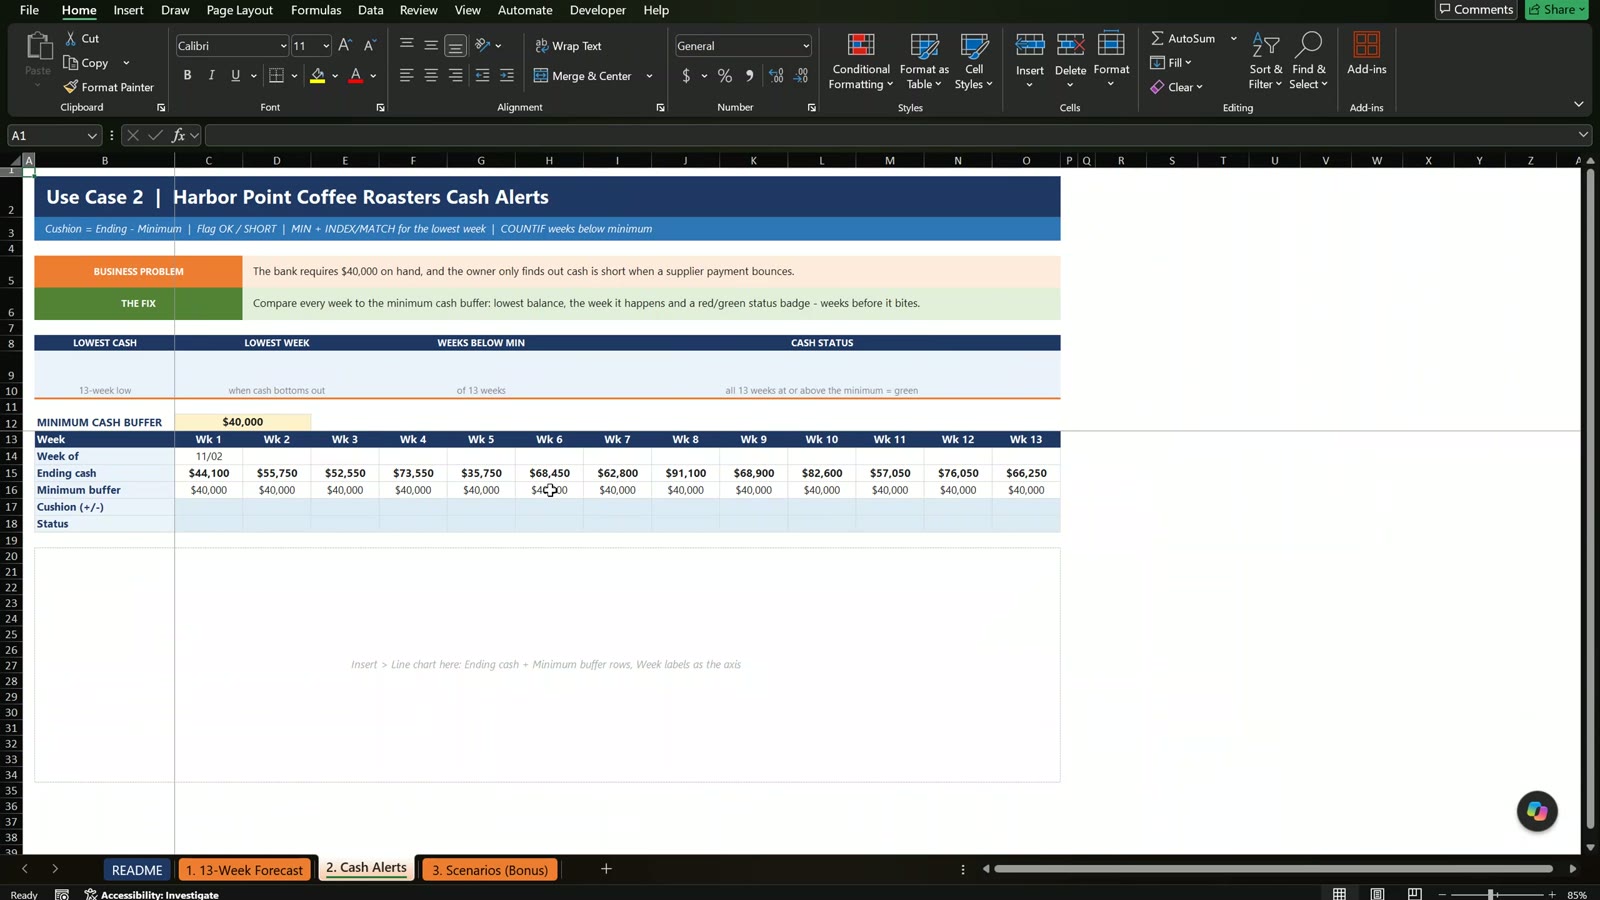
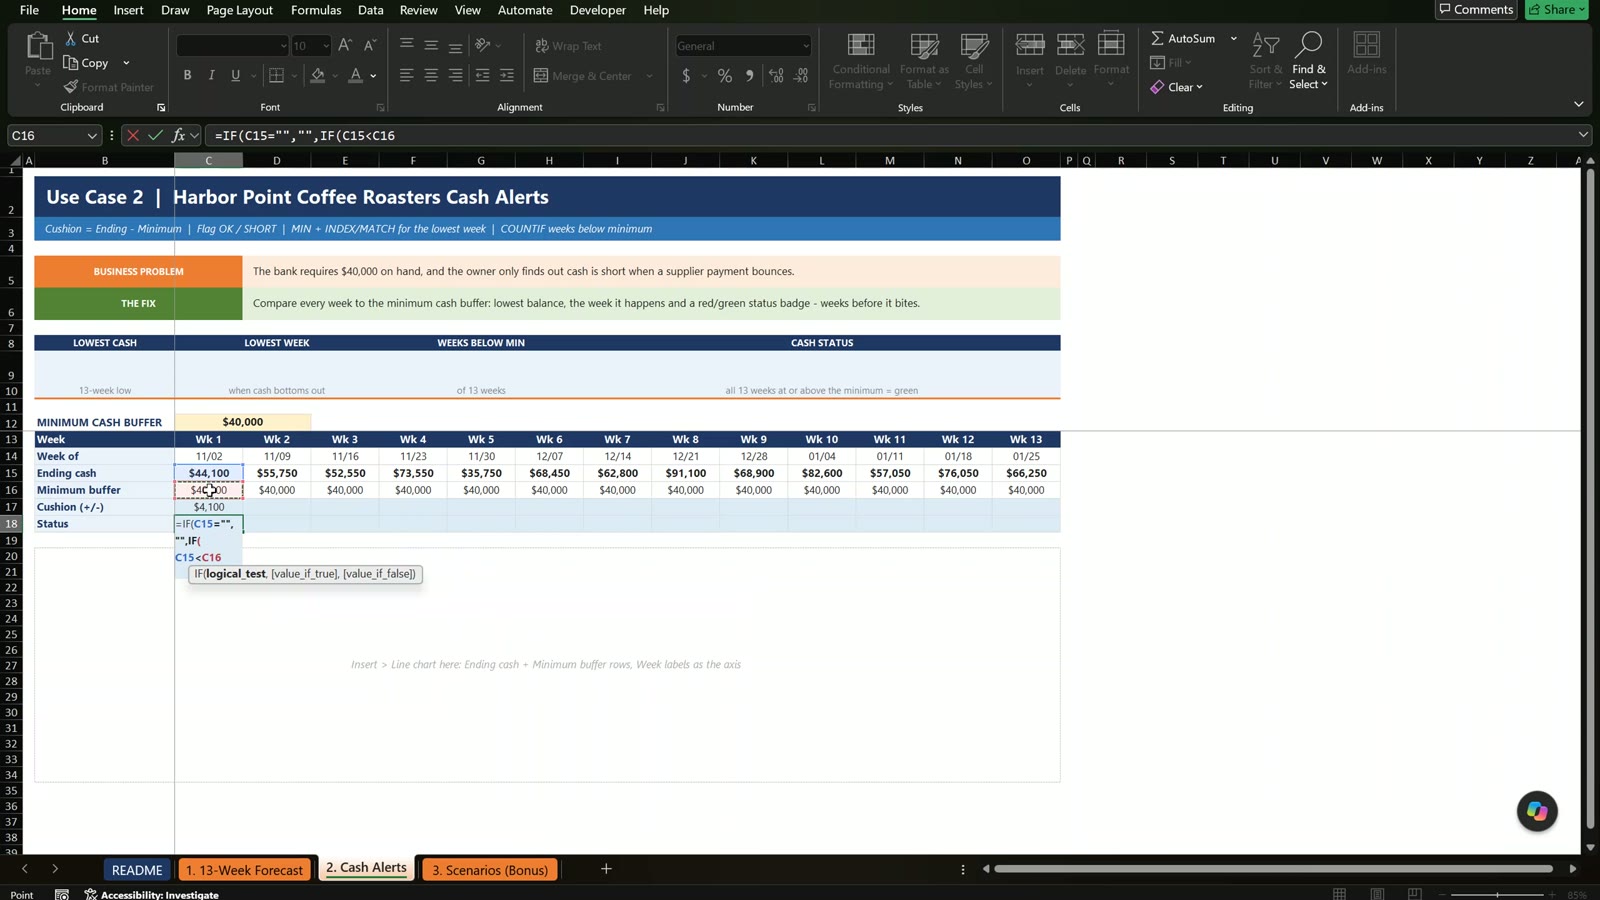
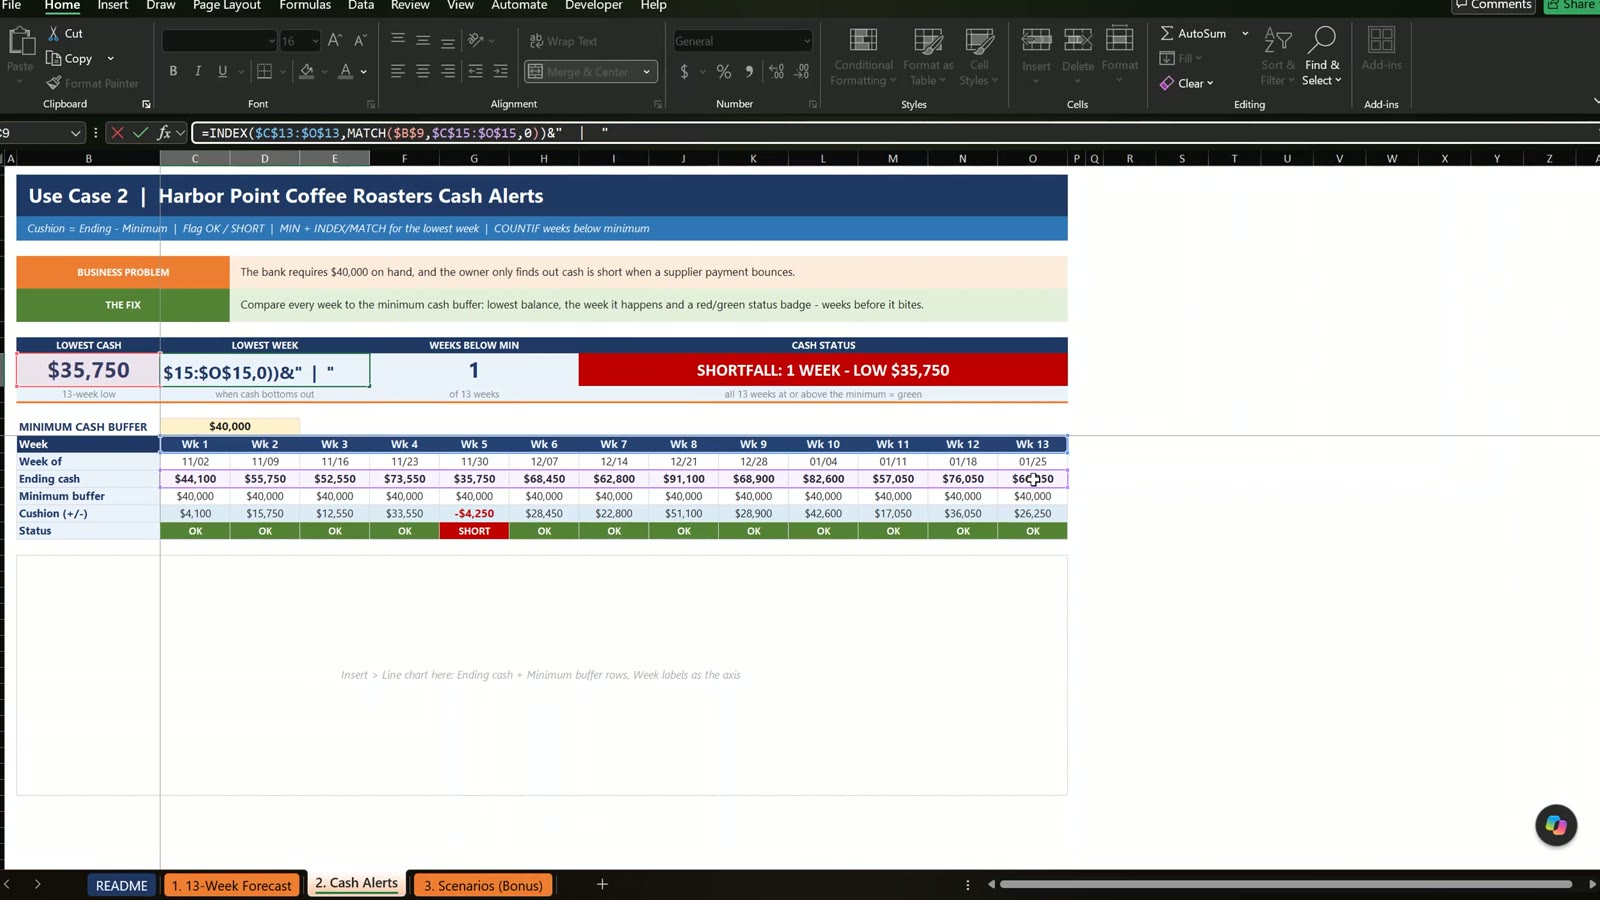
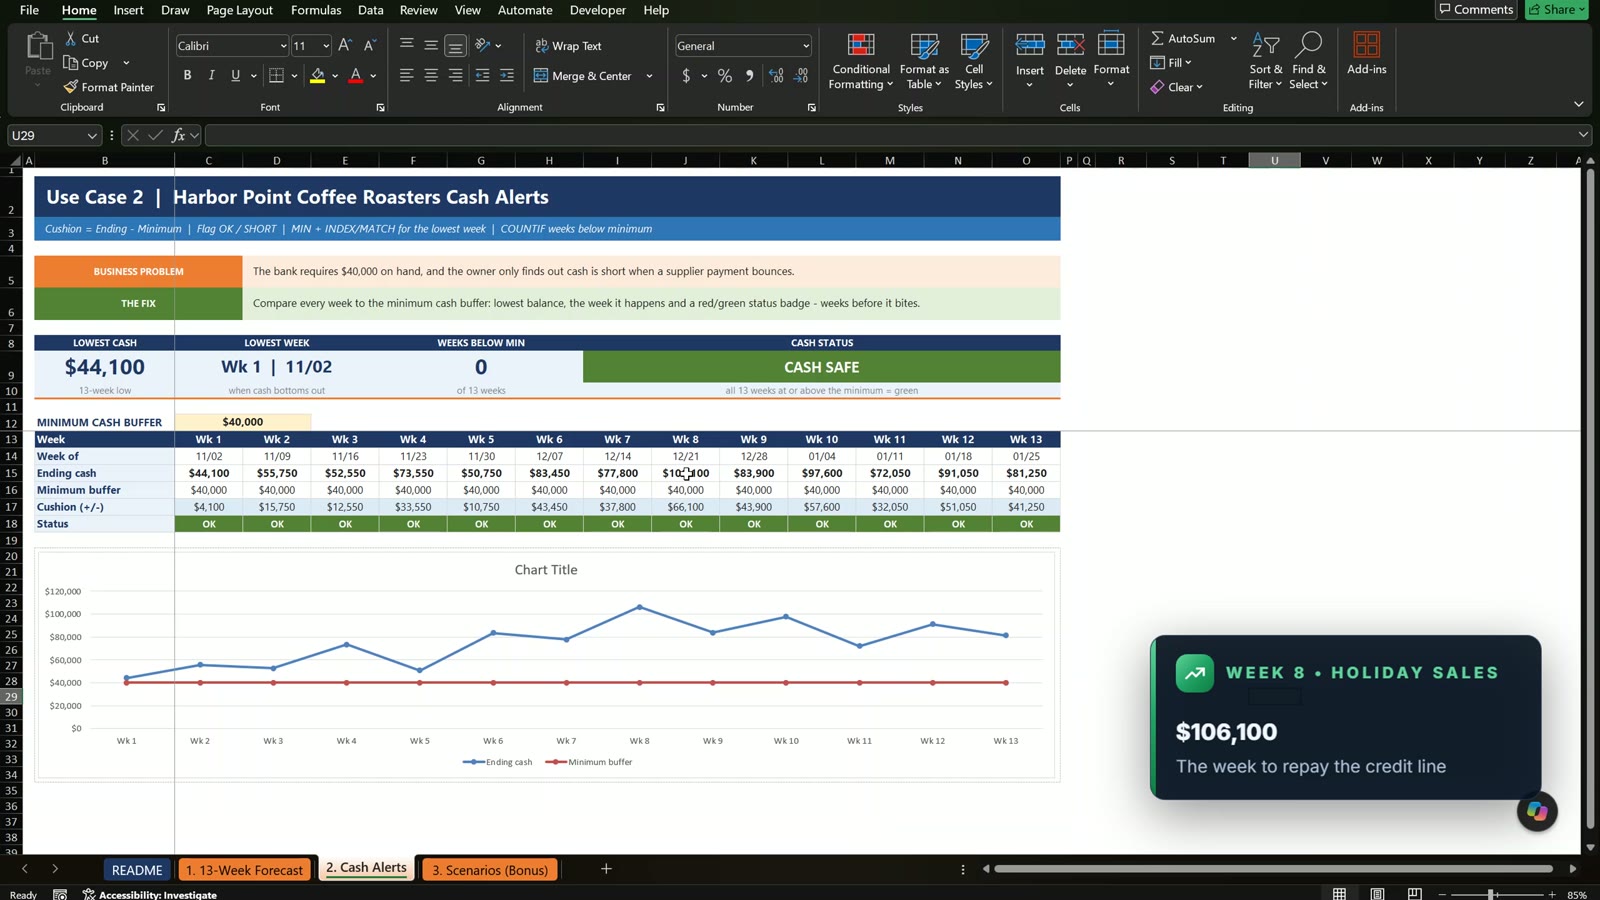
With the $40,000 minimum in C12, the cushion is =IF(C15="","",C15-C16) and the status is =IF(C15="","",IF(C15<C16,"SHORT","OK")). For the cards use =MIN($C$15:$O$15), =COUNTIF($C$18:$O$18,"SHORT") and INDEX with MATCH to return the week and date of the lowest cash.
Use Case 3: Fix the Gap With a Line of Credit
Type 15,000 in the line of credit draw for week 5 (G20). Week 5 ends at $50,750, the lowest cash becomes $44,100 and the card turns green: CASH SAFE. Week 8 climbs to $106,100, the week to repay the line.
Bonus: Base, Best and Worst Scenarios
Add a drop-down in H8 with Data Validation, pull the multipliers with =INDEX(C9:C11,MATCH($H$8,$B$9:$B$11,0)), and multiply the base totals. Worst case (receipts 95%, spend 102%) drops the lowest cash to $33,631 with two weeks short, even with the credit line. Best case stays safe.
Want a Ready-Made Version?
For a finished cash flow workbook with a 12-month forecast, scenarios and a dashboard, see the Cash Flow Analysis Pack on Next Gen Templates. To learn formulas in depth, join the Excel + AI Mastery: 100 Essential Formulas course.
Frequently Asked Questions
What is a 13-week cash flow forecast?
It is a week-by-week projection of cash coming in and going out for one quarter. Banks and lenders ask for it because it shows the exact week a balance could drop below the level you need.
Why must the opening cash of week 2 link to the ending cash of week 1?
Cash carries over. If you type an opening balance by hand after week 1, the chain breaks and every later week is wrong. Link it with =C33 and fill right.
How do I find the lowest cash week?
Use MIN on the ending cash row for the amount, then INDEX and MATCH to return the week and its date.
How do I flag weeks below the minimum balance?
Compare ending cash with the minimum with an IF that returns SHORT or OK, and count the short weeks with COUNTIF on the status row.
How do I model a line of credit draw?
Type the draw as a receipt in the line of credit row for the week you need it. Ending cash rises and the status card turns green. Plan the repayment for a week with strong cash, such as the holiday week.
How do base, best and worst scenarios work?
A Data Validation drop-down picks the scenario, INDEX and MATCH pull its receipts and spend multipliers, and the scenario rows multiply the base totals by them.
Is the practice file free?
Yes. The zip has the Practice and Solution workbooks for a fictional coffee roaster. The names and numbers are example data for learning.
Download the Free Practice Files
⬇️ Download the Free Practice Files
Practice + Solution workbooks · 13-week forecast · .zip · Excel 365 / 2021 / 2019
By PK, An Excel Expert. The business and numbers are fictional example data for learning.
Conclusion
A 13-week forecast needs only SUM, a linked opening balance and a few alert formulas. Download the free files, build along with the video and compare with the Solution file if you get stuck.