Fourteen tasks, one deadline, and a plan that has to show at a glance what is slipping. In this tutorial you build a Gantt chart in Excel 2026 with formulas and conditional formatting only: bars that draw themselves, a dark progress fill, a red status date line and a status card that turns red or green. No macros. The example is a website relaunch for Brightline Dental Group in Austin, Texas, from 10/05/2026 to 12/16/2026.

⬇️ Download the Free Practice Files
Practice + Solution workbooks · 14-task project plan · .zip · Excel 365 / 2021 / 2019
Watch the Video Tutorial
Video Overview
The fifteen-minute video opens with the finished file: type 60% for the Visual design mockups task and the red card turns green while the dark part of the bar grows. Then you build it in three use cases and a bonus. First the Task Plan with end dates, a planned percent and a status. Second the Gantt sheet with the date row and four conditional formatting rules. Third the status date, the status card and the moving timeline. The bonus is the classic stacked bar chart Gantt.
What You Will Build
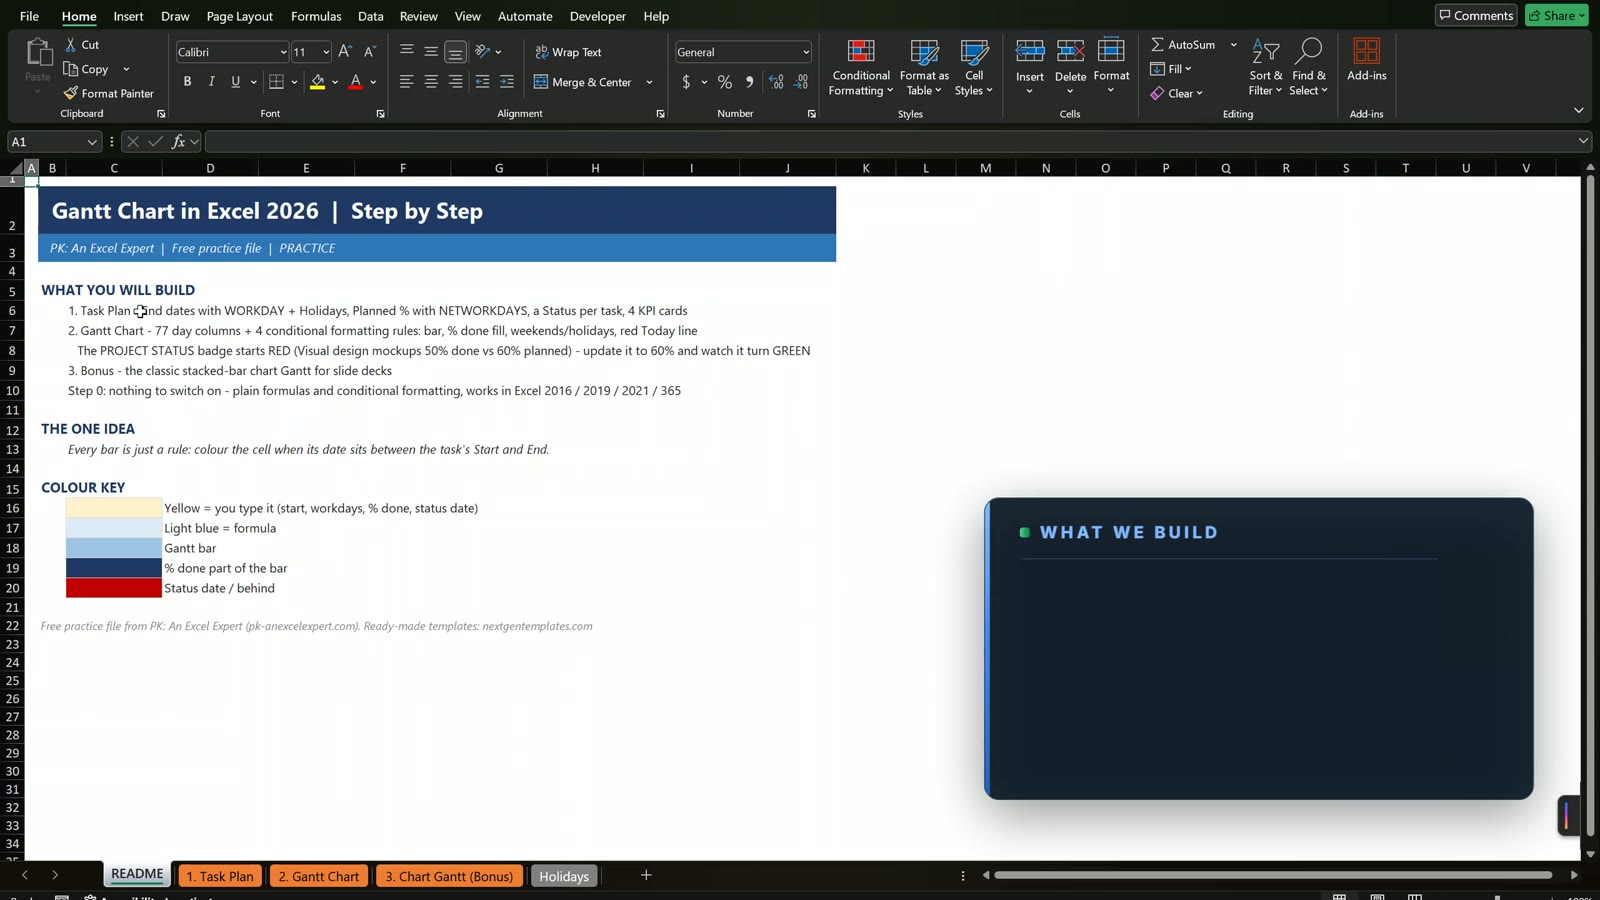
- End dates with WORKDAY and a holiday list.
- Planned percent with NETWORKDAYS and a status of Done, On Track, Behind or Not Started.
- The Gantt grid with a 77-day timeline and four conditional formatting rules.
- Status card and red today line driven by one StatusDate cell.
- A bonus stacked bar chart Gantt.
The Practice Files and the Data
The Practice file has the layout, task inputs and the Holidays sheet ready. The End, Planned % and Status formulas, the Gantt date header and all four rules are empty, so you build them. The Solution file has everything working. Holidays: 11/26/2026, 11/27/2026, 12/24/2026, 12/25/2026 and 01/01/2027. All names and dates are fictional example data.
Use Case 1: The Task Plan

End date with WORKDAY
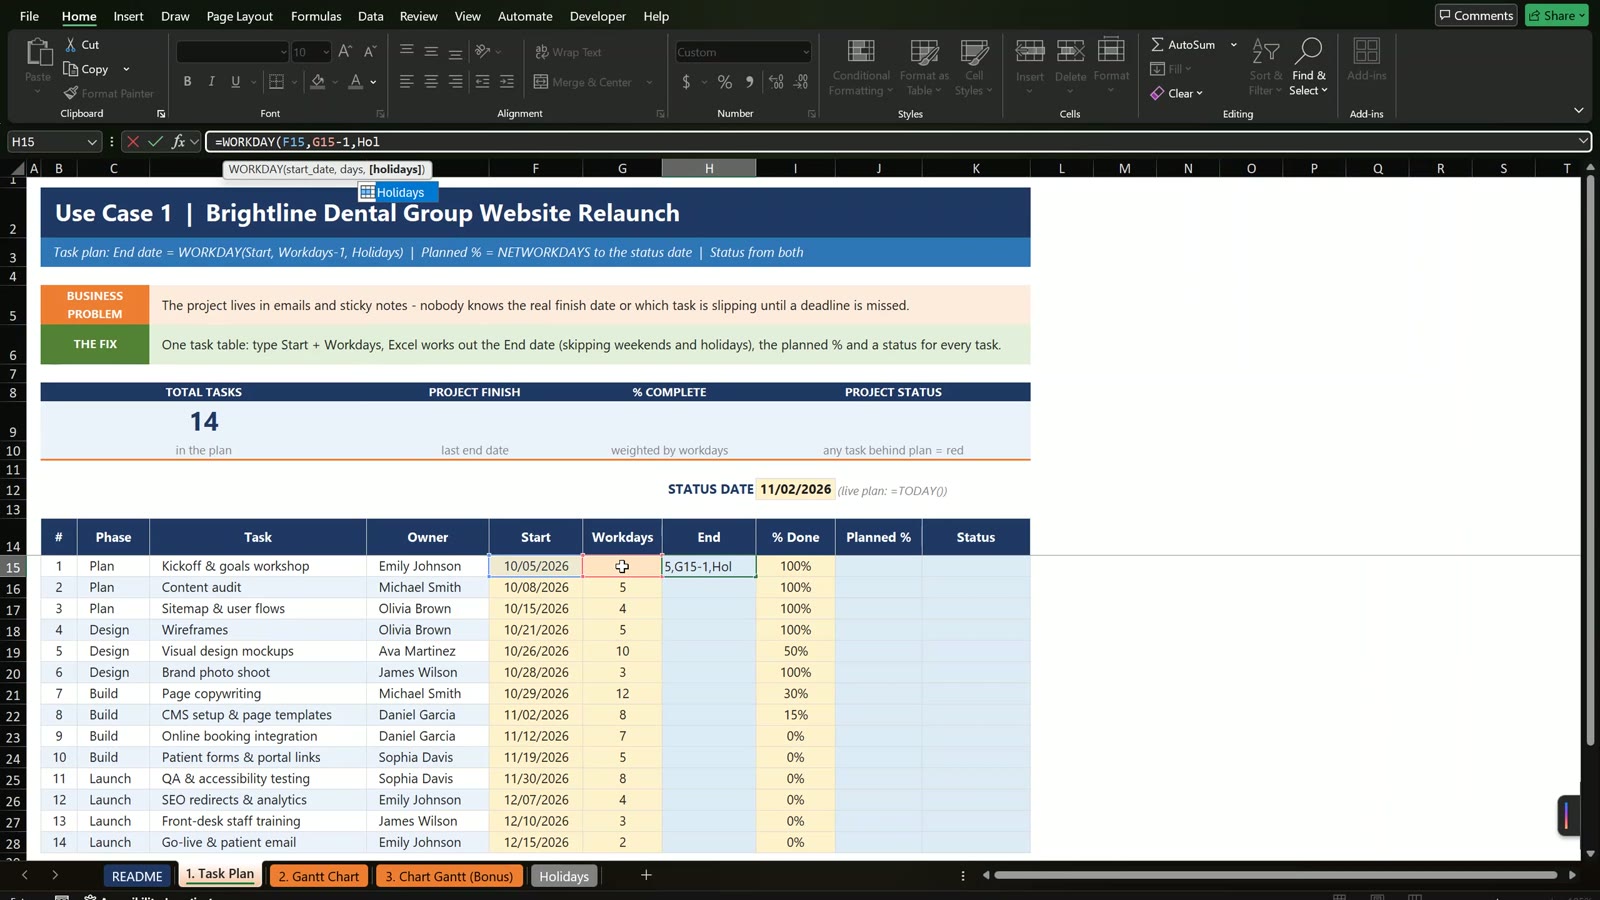
In H15 enter =WORKDAY(F15,G15-1,Holidays) and fill down. The first task kicks off on 10/05/2026 and takes 3 workdays, so it ends on 10/07/2026. WORKDAY counts the days after the start, which is why you subtract one.

Planned percent and status
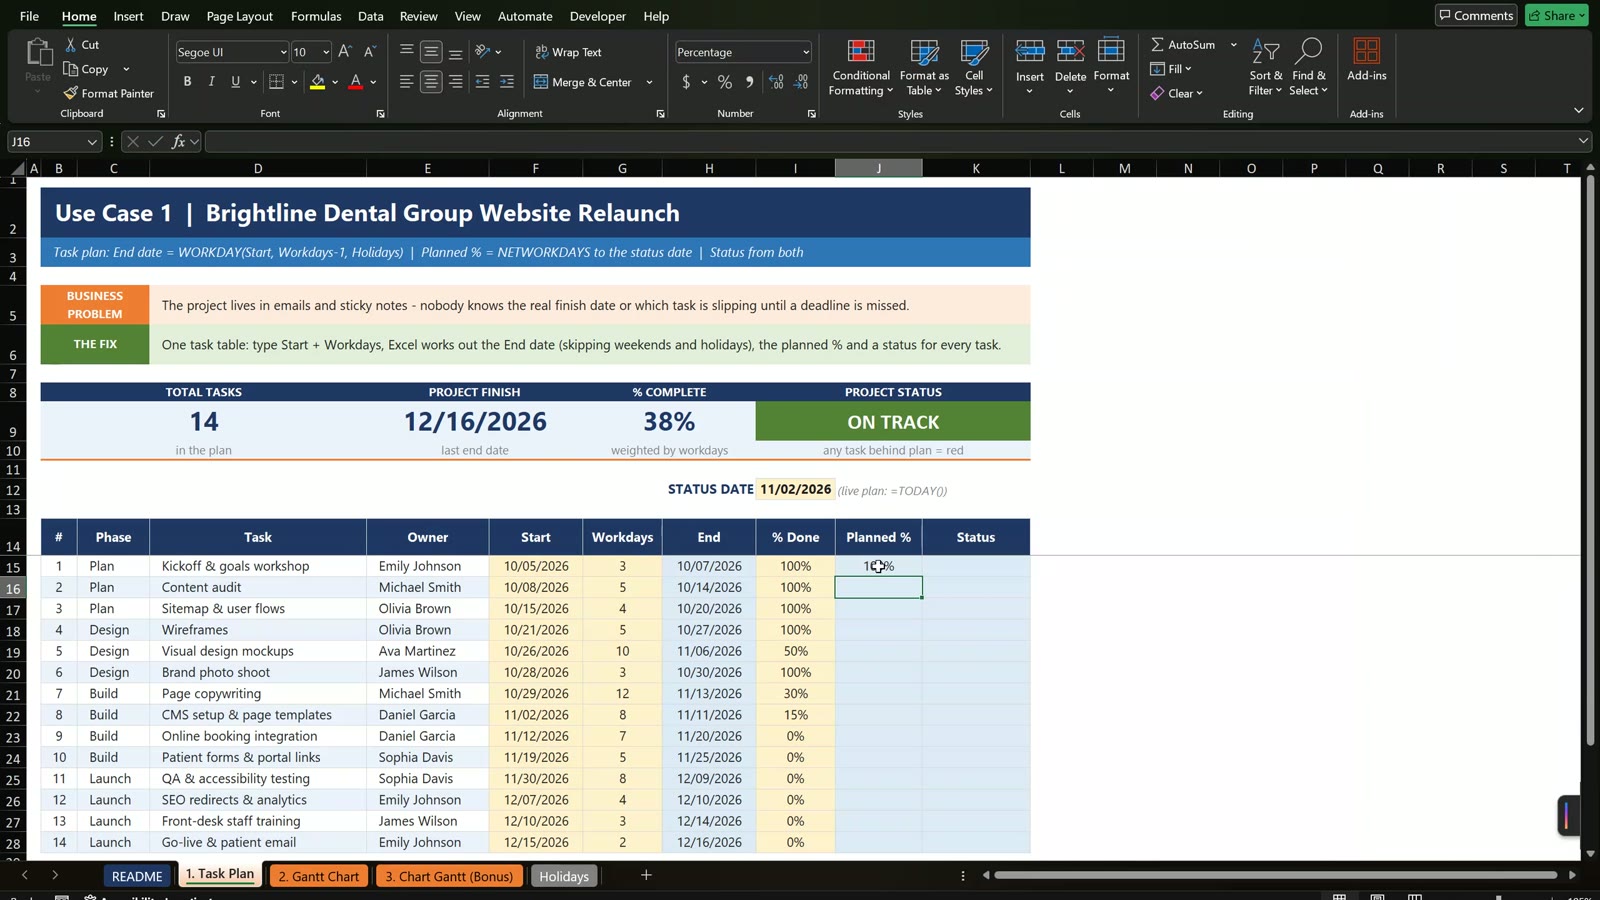
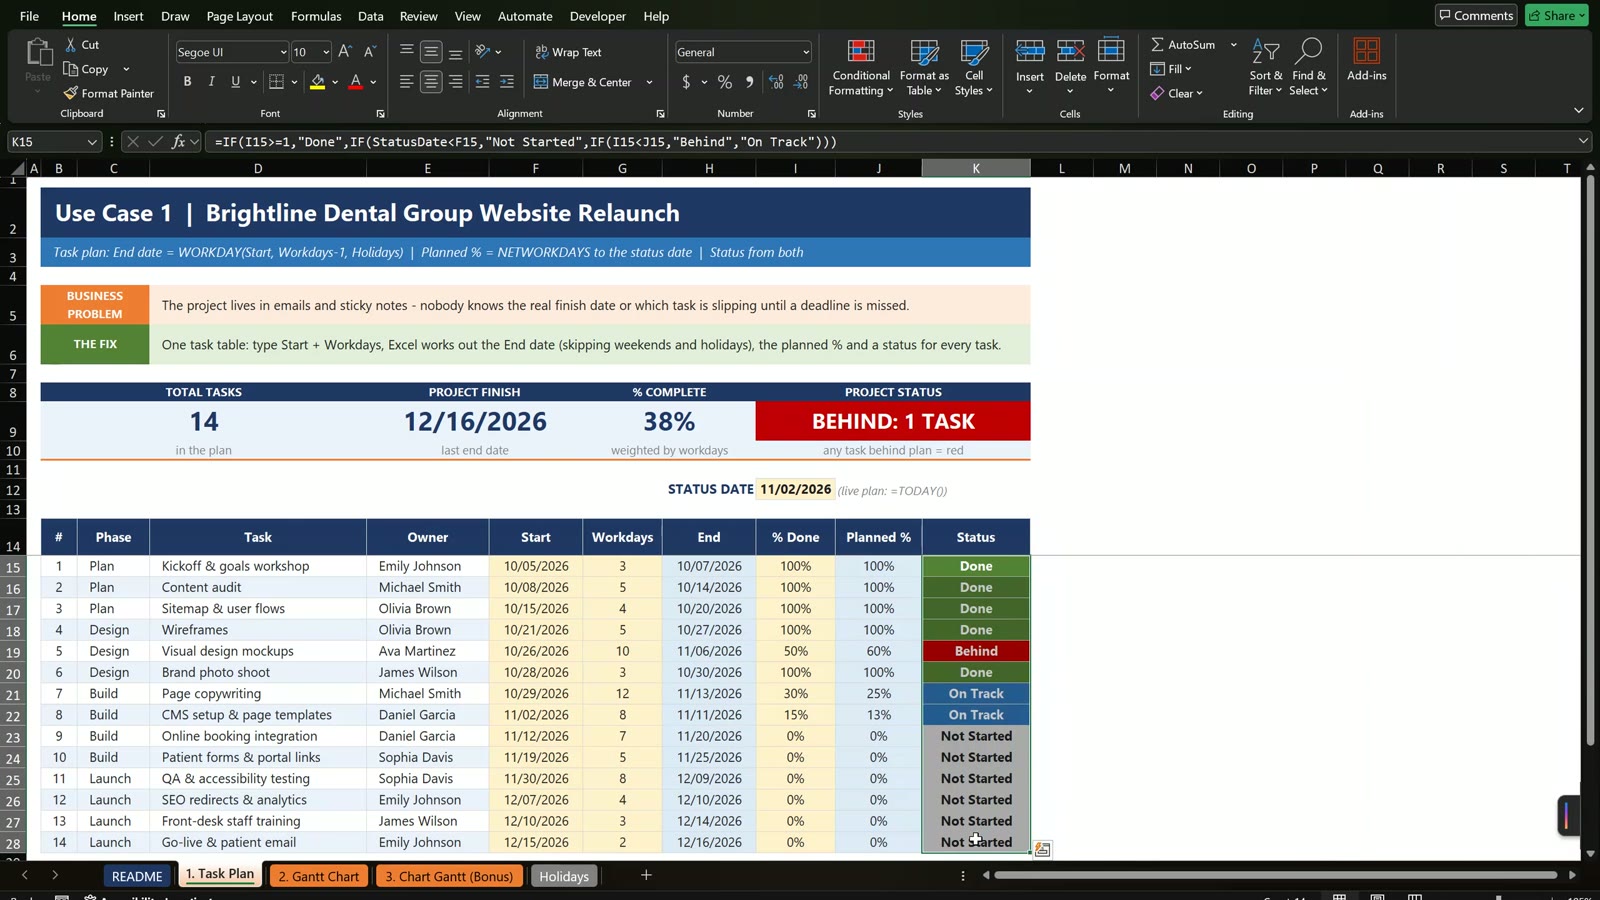
In J15 enter =IF(StatusDate<F15,0,MIN(1,NETWORKDAYS(F15,StatusDate,Holidays)/G15)). Then in K15 enter =IF(I15>=1,"Done",IF(StatusDate<F15,"Not Started",IF(I15<J15,"Behind","On Track"))). With the status date at 11/02/2026 you get 5 Done, 2 On Track, 1 Behind and 6 Not Started.
Use Case 2: The Gantt Chart
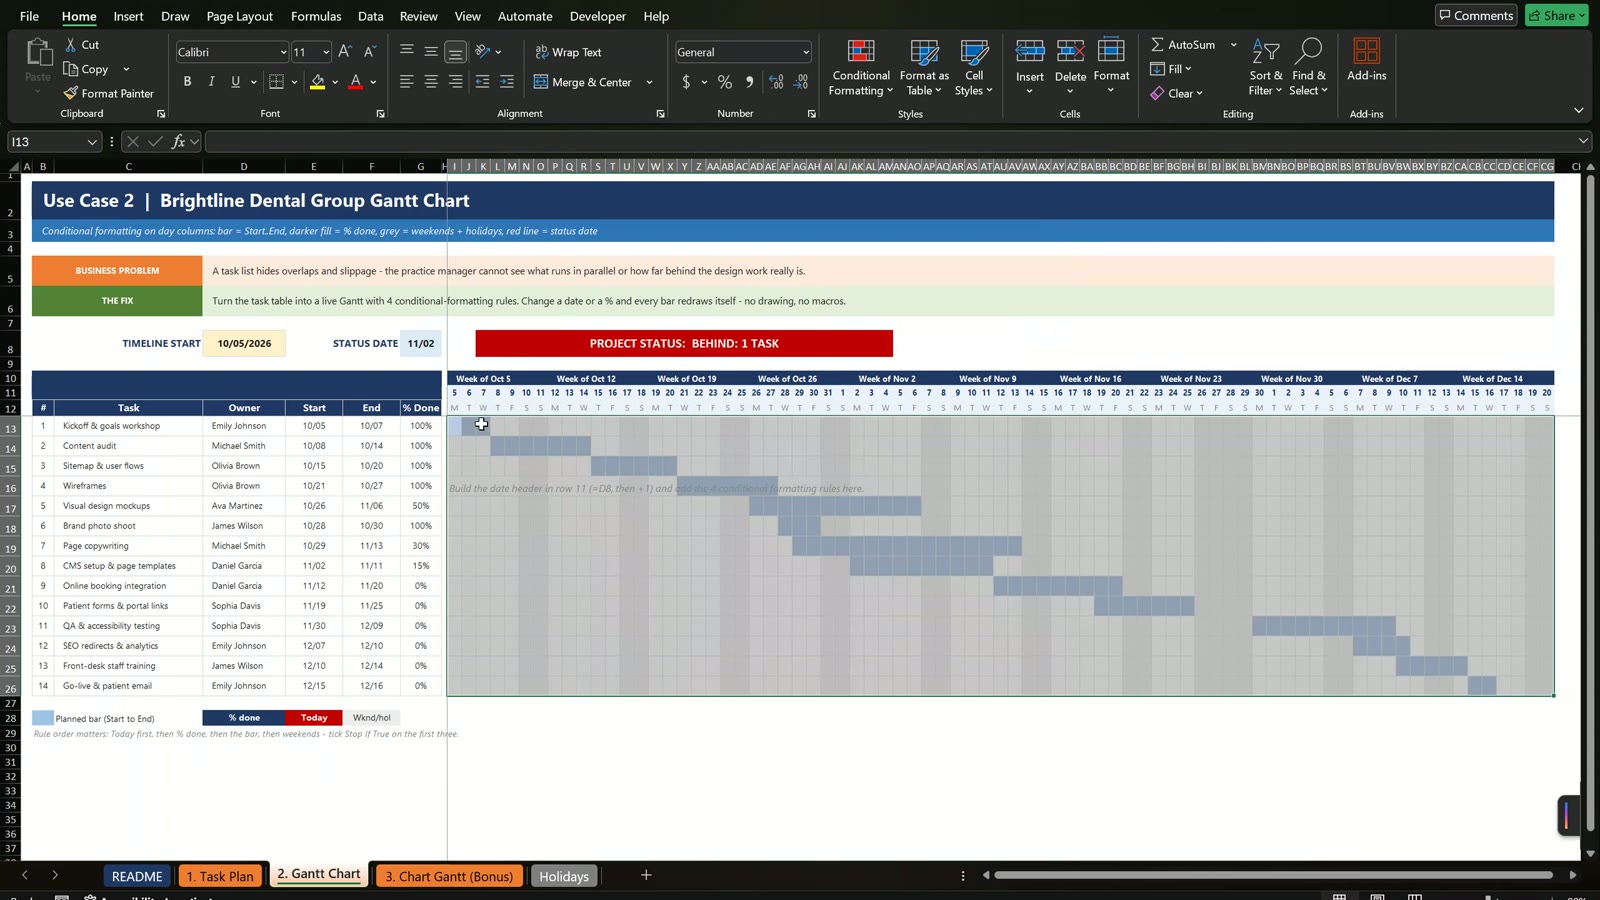
On the Gantt sheet set I11 to =$D$8 (Timeline Start 10/05/2026), J11 to =I11+1 and fill right to CG11, 77 days. Add the week labels in row 10 and the day letters in row 12 with =LEFT(TEXT(I11,"ddd"),1).

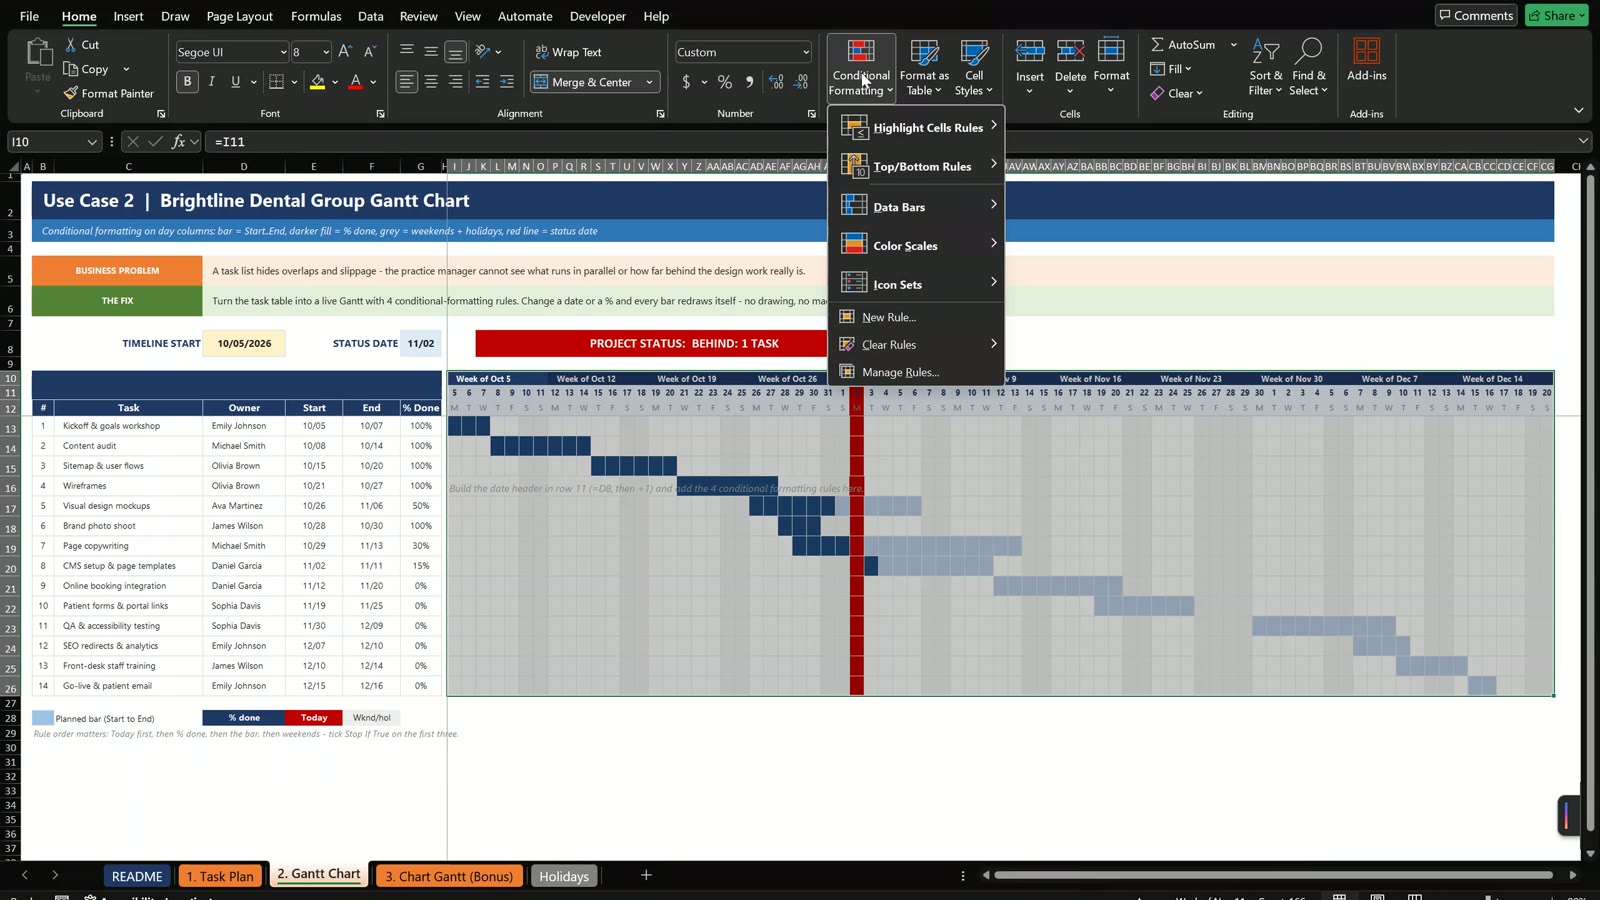
Select I13:CG26, choose Conditional Formatting > New Rule > Use a formula, and add four rules in this order:
| # | Rule | Formula | Fill |
|---|---|---|---|
| 1 | Status date line | =I$11=StatusDate | Red |
| 2 | Percent done | =AND($E13<>"",$F13<>"",I$11>=$E13,I$11<=$F13,I$11<$E13+($F13-$E13+1)*$G13) | Navy |
| 3 | Planned bar | =AND($E13<>"",$F13<>"",I$11>=$E13,I$11<=$F13) | Sky blue |
| 4 | Weekends and holidays | =OR(WEEKDAY(I$11,2)>5,COUNTIF(Holidays,I$11)>0) | Light grey |
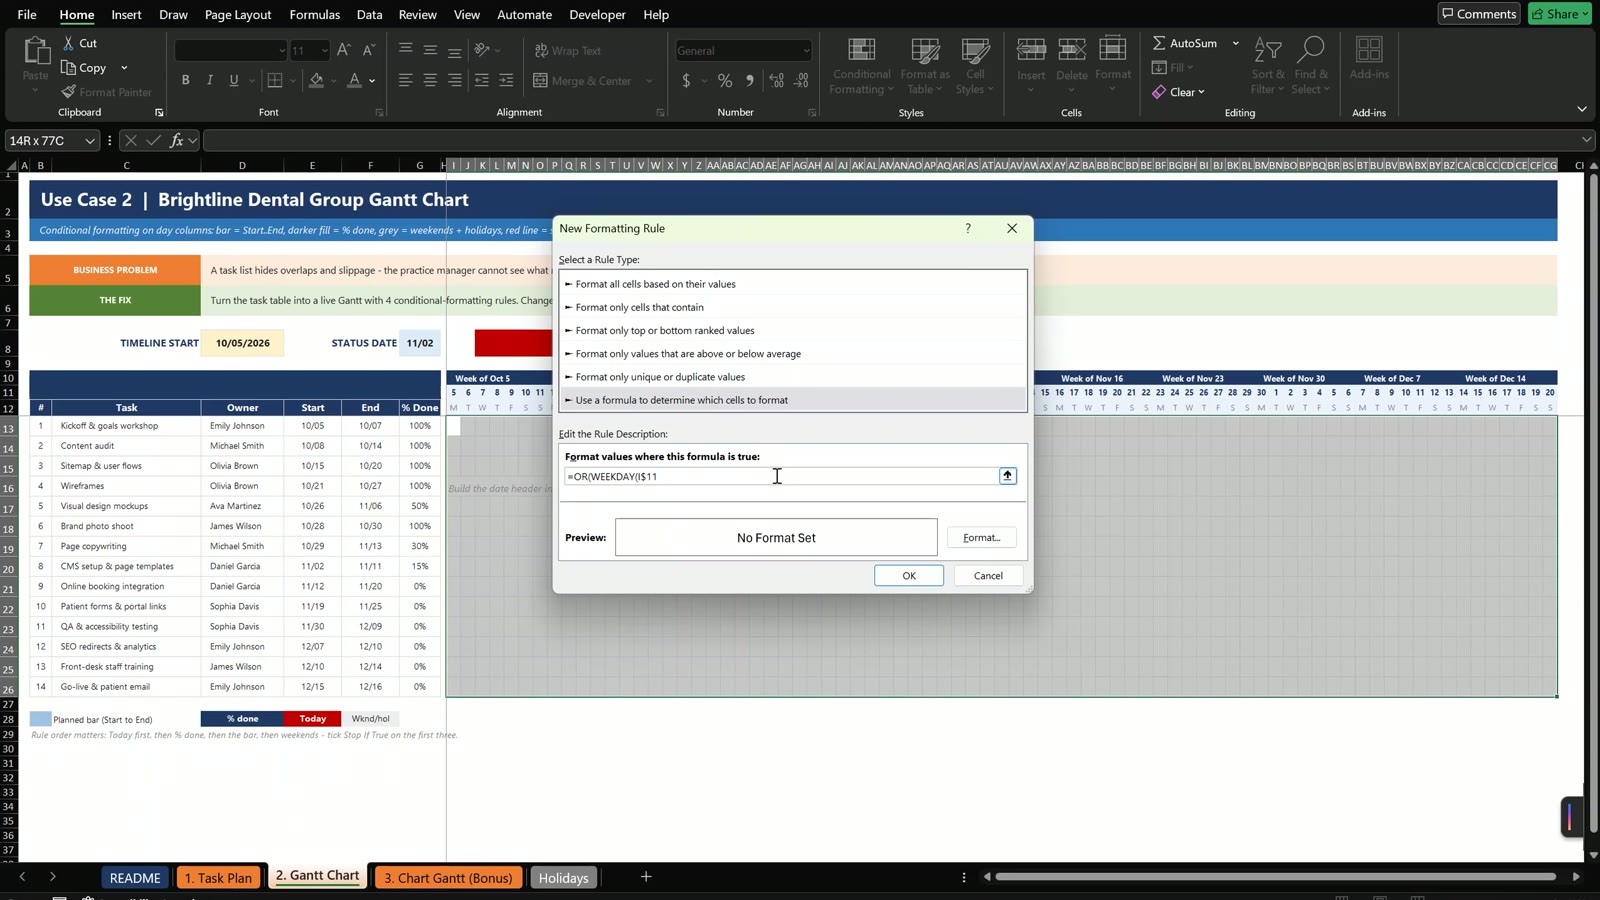
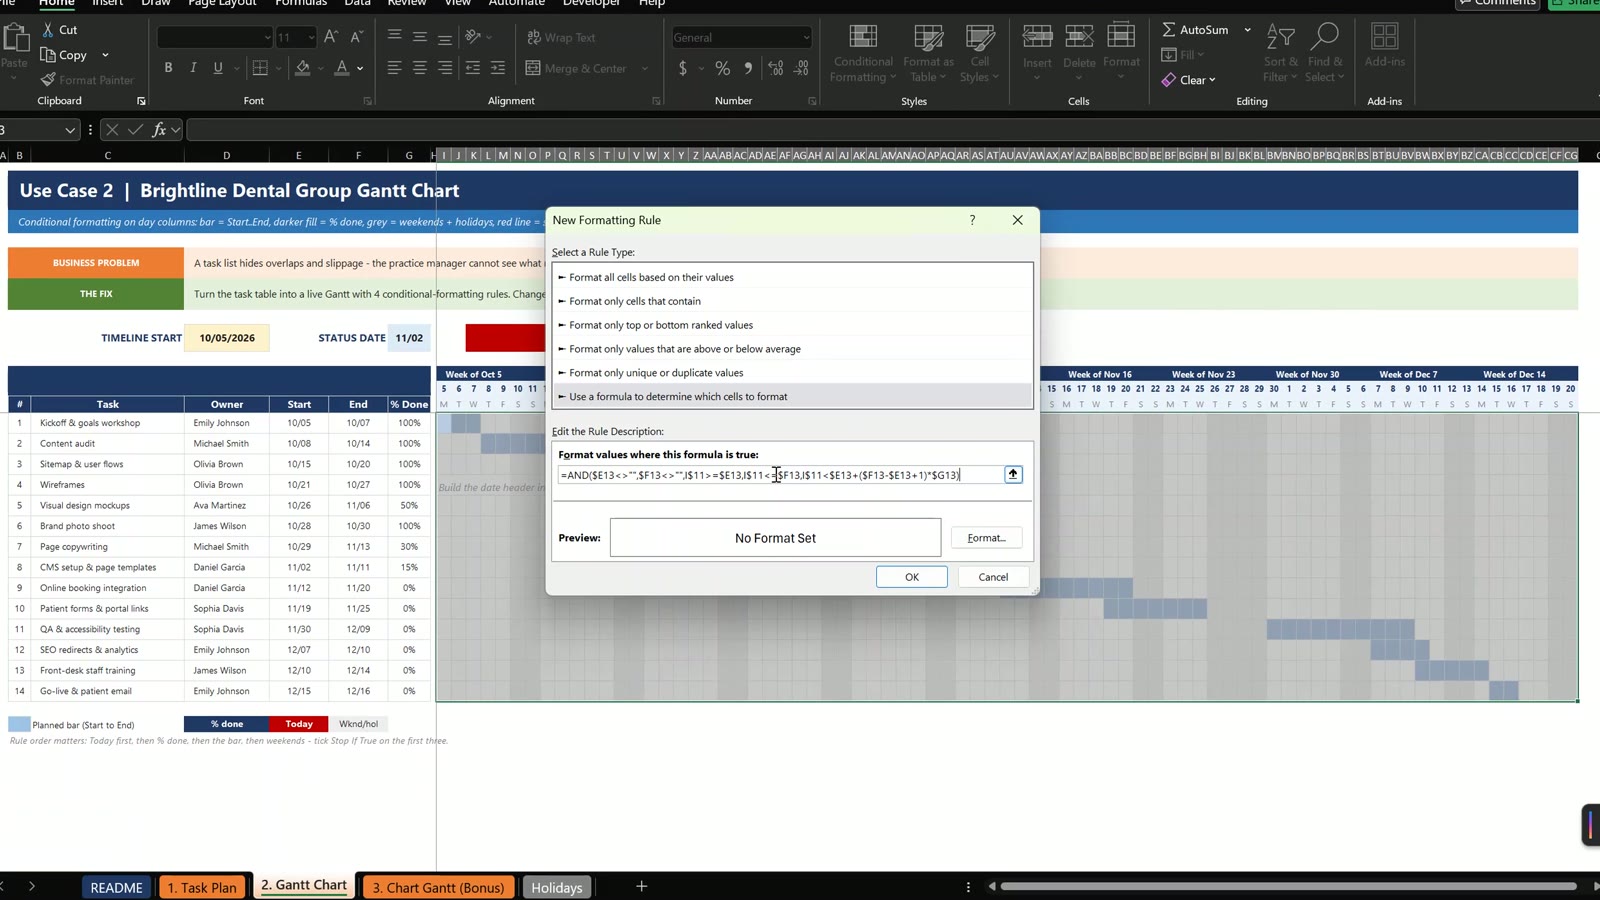
Trap: mixed references. $E13 locks the column, I$11 locks the row. And the order matters: the first rule that colours a cell wins.
Use Case 3: Status Date and Status Card
The red line sits on the status date, Monday 11/02/2026, and the card reads BEHIND: 1 TASK because Visual design mockups is 50% done against 60% planned. Type 60% and the card turns green. Change Timeline Start to 10/26/2026 to scroll the window, or set StatusDate to =TODAY() for a live plan.

Bonus: Stacked Bar Chart Gantt
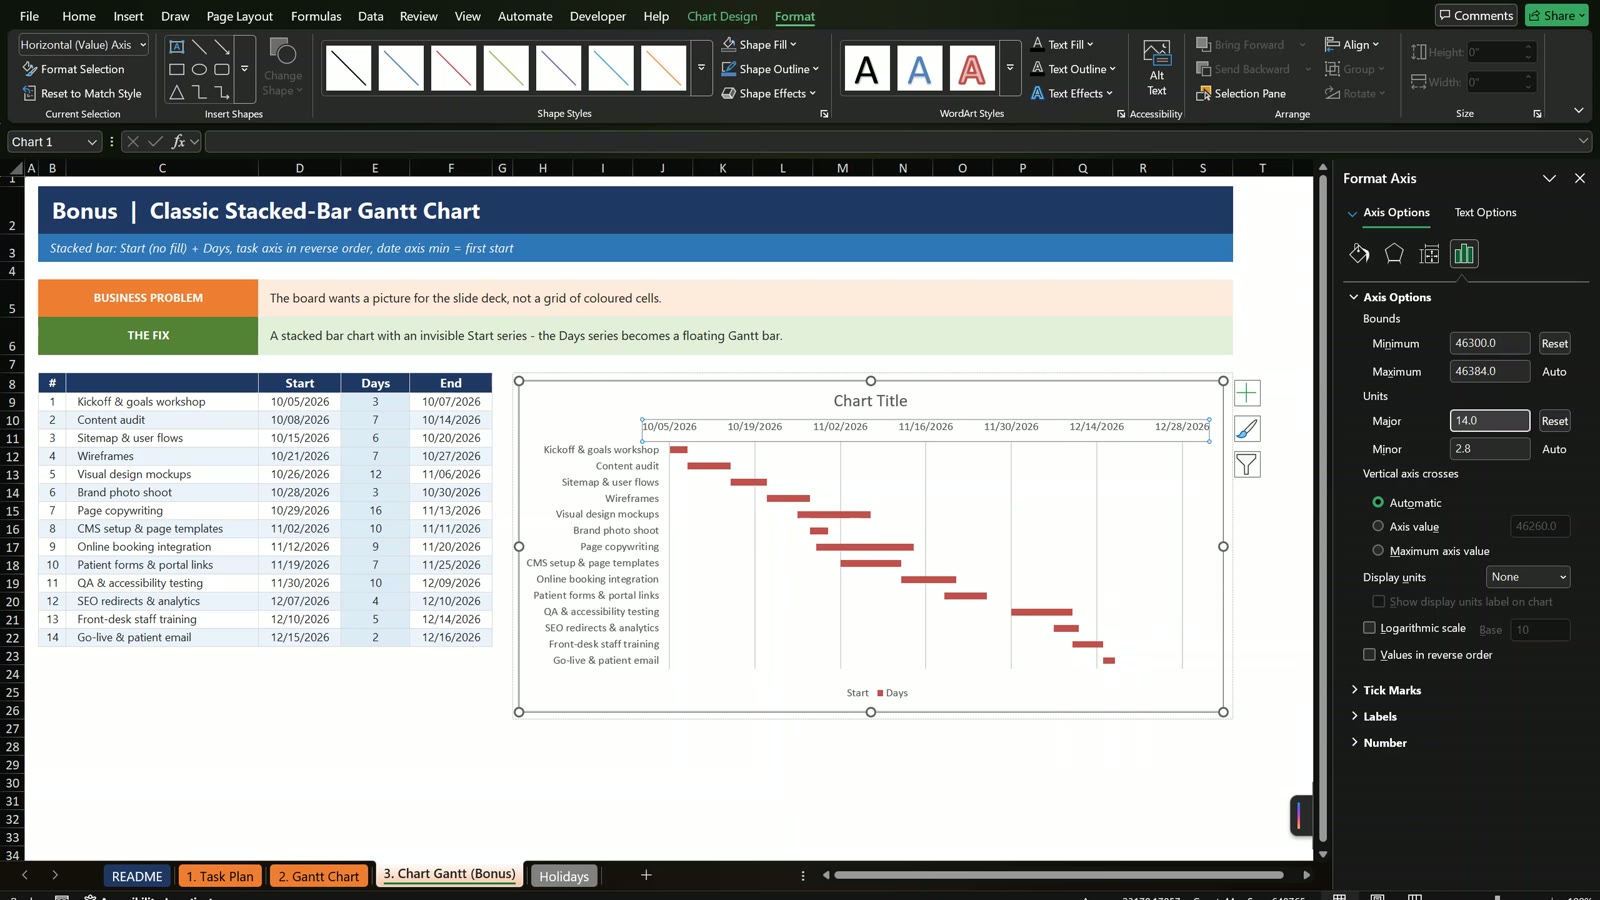
On the bonus sheet add a Days column with ='1. Task Plan'!H15-'1. Task Plan'!F15+1, insert a Stacked Bar chart on Task, Start and Days, set the Start series to No Fill, reverse the category order and set the horizontal axis minimum to 46300 (10/05/2026) and maximum to 46377.
Want a Ready-Made Version?
If you want a finished planner with more features, see the Project Plan Gantt Chart in Excel on Next Gen Templates. To learn dashboards and formulas in depth, join the Excel Pivot Tables & Dashboards course.
Frequently Asked Questions
How do I make a Gantt chart in Excel without macros?
Build a task table with Start, Workdays and End, add a timeline row of dates, then colour the grid with four conditional formatting rules: the status date line, the percent done fill, the planned bar and the weekends. Excel redraws every bar when a date changes.
Why does WORKDAY need the Workdays minus one?
WORKDAY counts days after the start date. A three-day task that starts Monday ends Wednesday, so the formula is =WORKDAY(F15,G15-1,Holidays).
How do I skip weekends and holidays in the end date?
Put the holidays on a Holidays sheet, name the range Holidays and pass it as the third argument of WORKDAY and NETWORKDAYS. Weekends are skipped automatically.
Why does the order of the conditional formatting rules matter?
When two rules colour the same cell, the rule higher in the list wins. Keep the status date line first, then percent done, then the planned bar, then weekends, and tick Stop If True.
Why do the formulas use $E13 and I$11?
They are mixed references. $E13 locks the column so every cell in a row reads that row's start date, and I$11 locks the row so every cell in a column reads that column's date.
How do I move the red status date line?
Change the StatusDate cell on the Task Plan sheet. Type a date to test, or use =TODAY() for a live plan.
Is the practice file free?
Yes. The zip has the Practice and Solution workbooks for a fictional dental clinic website project. The names and dates are example data for learning.
Download the Free Practice Files
⬇️ Download the Free Practice Files
Practice + Solution workbooks · 14-task project plan · .zip · Excel 365 / 2021 / 2019
By PK, An Excel Expert. The project, names and dates are fictional example data for learning.
Conclusion
WORKDAY and NETWORKDAYS give you honest dates and percentages, four conditional formatting rules draw the whole chart, and one StatusDate cell drives the red line and the status card. Download the free files, build it along with the video and compare with the Solution file if you get stuck.