Angel investment activity has surged globally — the global angel investment market exceeded $25 billion annually in recent years, with over 300,000 active angel investors in the US alone backing more than 60,000 ventures each year, according to data from the Angel Capital Association. Yet the majority of angel networks still track deal flow, portfolio returns, and mentor engagement across disconnected spreadsheets with no unified analytics view. The result: hours of manual consolidation every time an LP update or board review is due.
The Business Angel Networks Dashboard in Excel solves this directly. It consolidates your entire angel investment operation into 5 interactive analytics pages powered by pivot tables and slicers, covering deal flow, portfolio performance, network composition, and geographic spread — all from a single structured Data Sheet. Update your deals, click Refresh All, and every KPI card, chart, and filter updates automatically in under a minute. This tutorial walks you through every page, explains what each chart reveals, and shows you how to get your own data running in the dashboard.
🛒 Click here to Purchase the Business Angel Networks Dashboard in Excel
Key Features of the Business Angel Networks Dashboard in Excel
- 5 fully-interactive analytics pages — Overview, Deal Flow, Portfolio Performance, Network Analysis, and Geographic Analysis — each addressing a different dimension of angel investment management.
- 5 headline KPI cards on the Overview page — Total Deals, Total Investment, Total Post-Money Valuation, Avg. Returns Multiple, and Total Mentorship Hours — providing an instant portfolio pulse.
- 20+ pivot-driven charts built on Excel native pivot tables. All charts update with a single Refresh All click after adding new deal records.
- Dynamic slicers on every page — filter by Region, Sector, Funding Stage, Investor Type, Risk Rating, Deal Status, and Angel Network simultaneously across all charts.
- Structured Data Sheet — a single input table where you add deal records in a consistent column format. No formula editing required after initial setup.
- Support Sheet with pivot engine — all charts draw from pivot tables in this sheet. Keep it hidden for clean presentation; unhide anytime for full transparency.
- Works in Excel 2016, 2019, 2021, and Microsoft 365 — no plugins, no macros, no add-ins required. Pure Excel pivot and slicer technology.
Dashboard Pages Explanation
1 — Overview Page
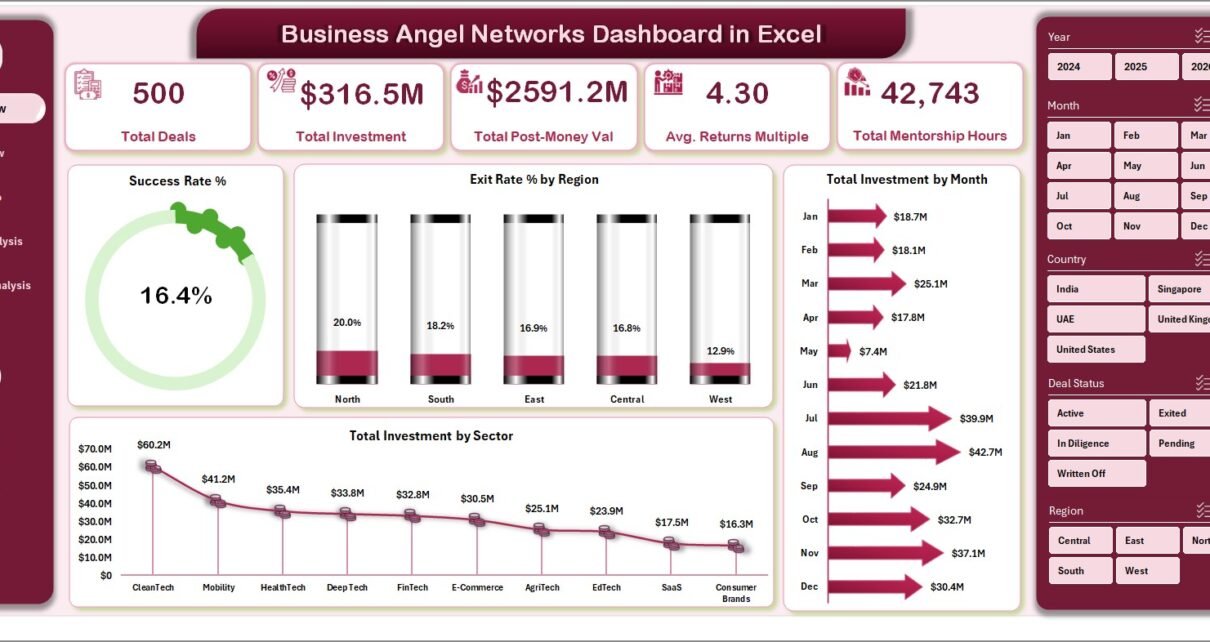
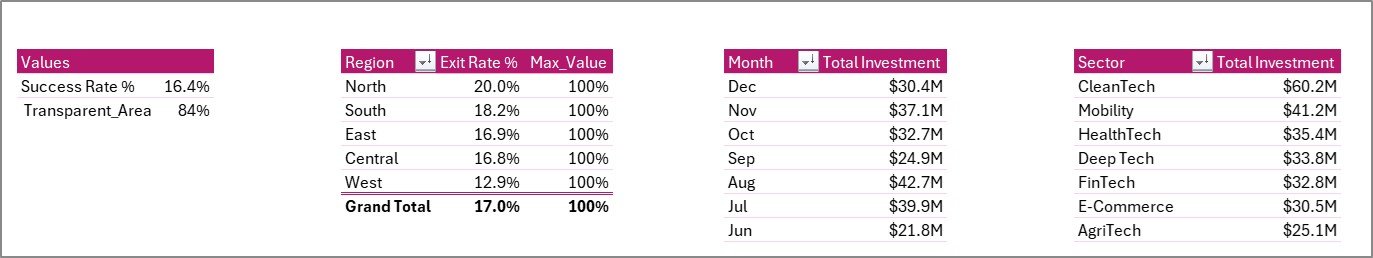
The Overview page is the command center of your angel network analytics. At the top, five KPI cards show your portfolio’s headline numbers at a glance: Total Deals, Total Investment, Total Post-Money Valuation, Avg. Returns Multiple, and Total Mentorship Hours. These cards update instantly when you apply any slicer filter, making them perfect for LP presentations and board meetings where decision-makers need filtered views on the fly.
Below the KPI cards, four charts provide a visual summary of portfolio health: Success Rate % shows how many deals are performing against expectations; Exit Rate % by Region reveals which geographies are generating the most exits; Total Investment by Sector highlights your capital concentration across industries; and Total Investment by Month tracks your deployment cadence over time — useful for identifying seasonal patterns and pacing your next fundraise.
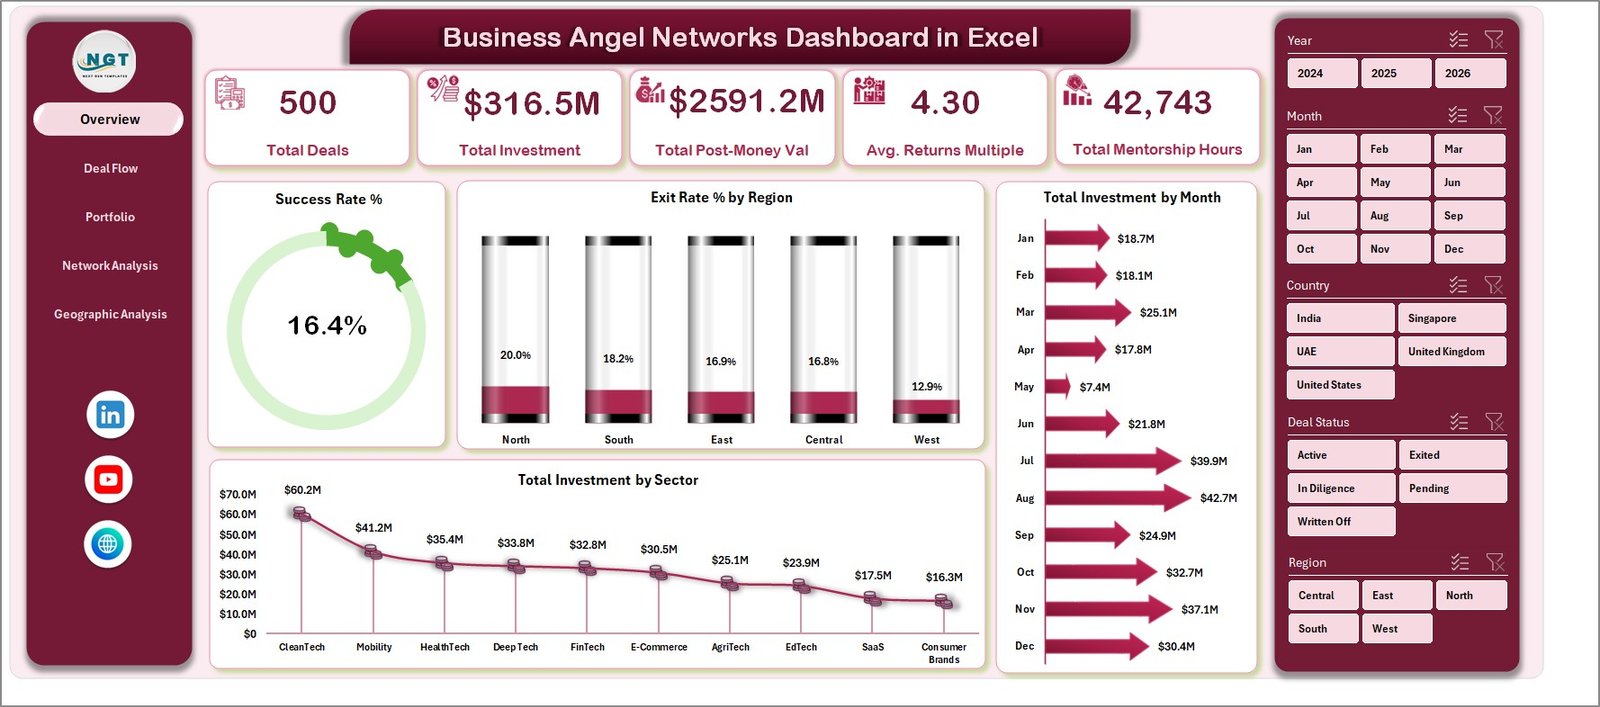
Business Angel Networks Dashboard in Excel — Overview Page
2 — Deal Flow Page
The Deal Flow page dives into your investment pipeline with four analytical charts. Success Rate % by Region answers a critical question for geographic diversification: which regions are generating the highest-quality deals? Total Investment by Funding Stage shows how your capital is distributed across pre-seed, seed, Series A, and later rounds. Total Deals by Sector reveals your sectoral concentration so you can spot over-exposure before it becomes a portfolio risk. Total Investment by Industry gives a more granular view of capital deployment within your deal universe.
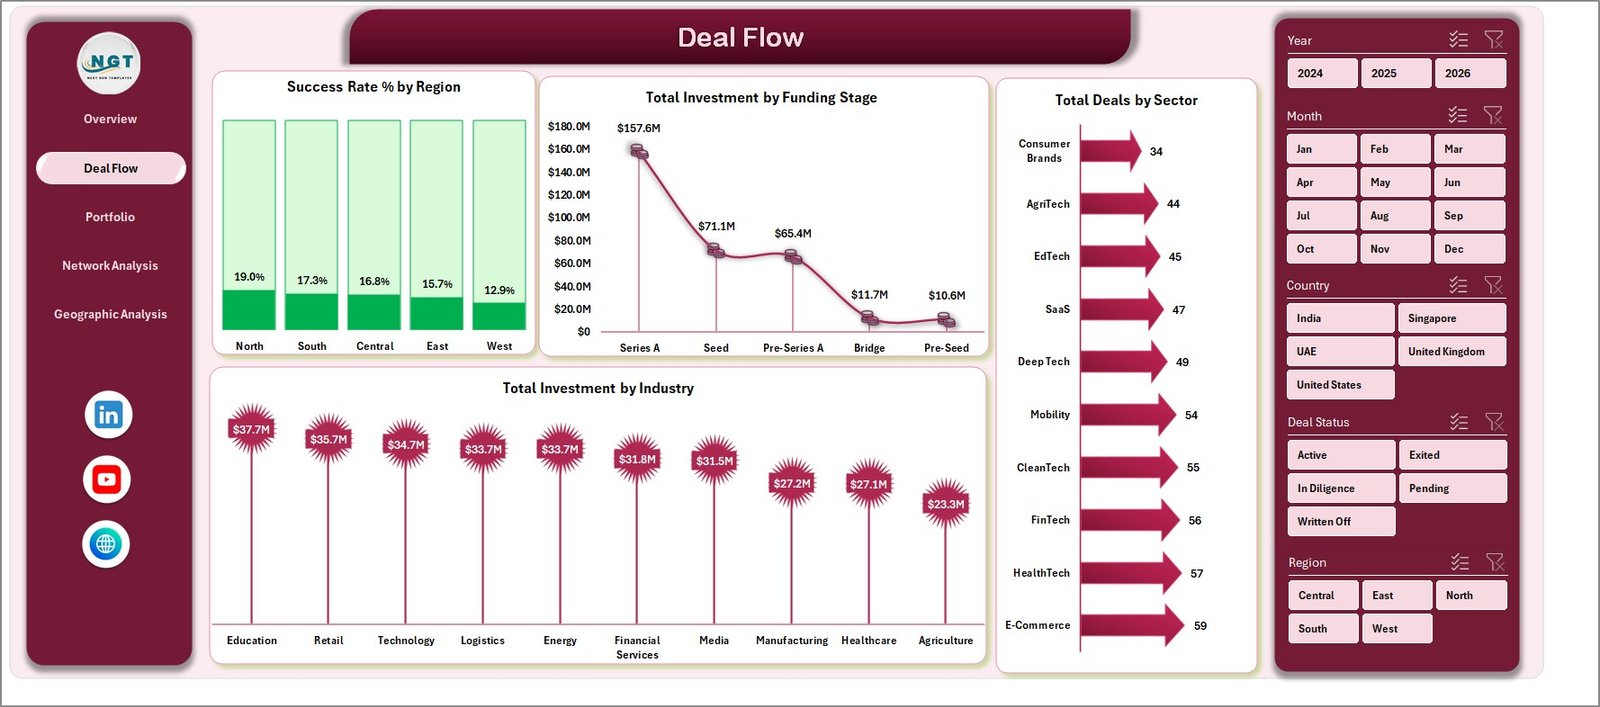
Business Angel Networks Dashboard in Excel — Deal Flow Page
3 — Portfolio Performance Page
Portfolio Performance is where you measure what matters most: returns and risk-adjusted success. Total Deals by Region gives a geographic breakdown of your active portfolio count. Success Rate % by Risk Rating is particularly insightful — it lets you test whether your internal risk assessments at the time of investment actually predicted outcomes. Avg. Returns Multiple by Sector and Avg. Returns Multiple by Funding Stage are the two charts most useful for refining your future investment thesis, showing exactly which sectors and stages are delivering the best multiples for your network.
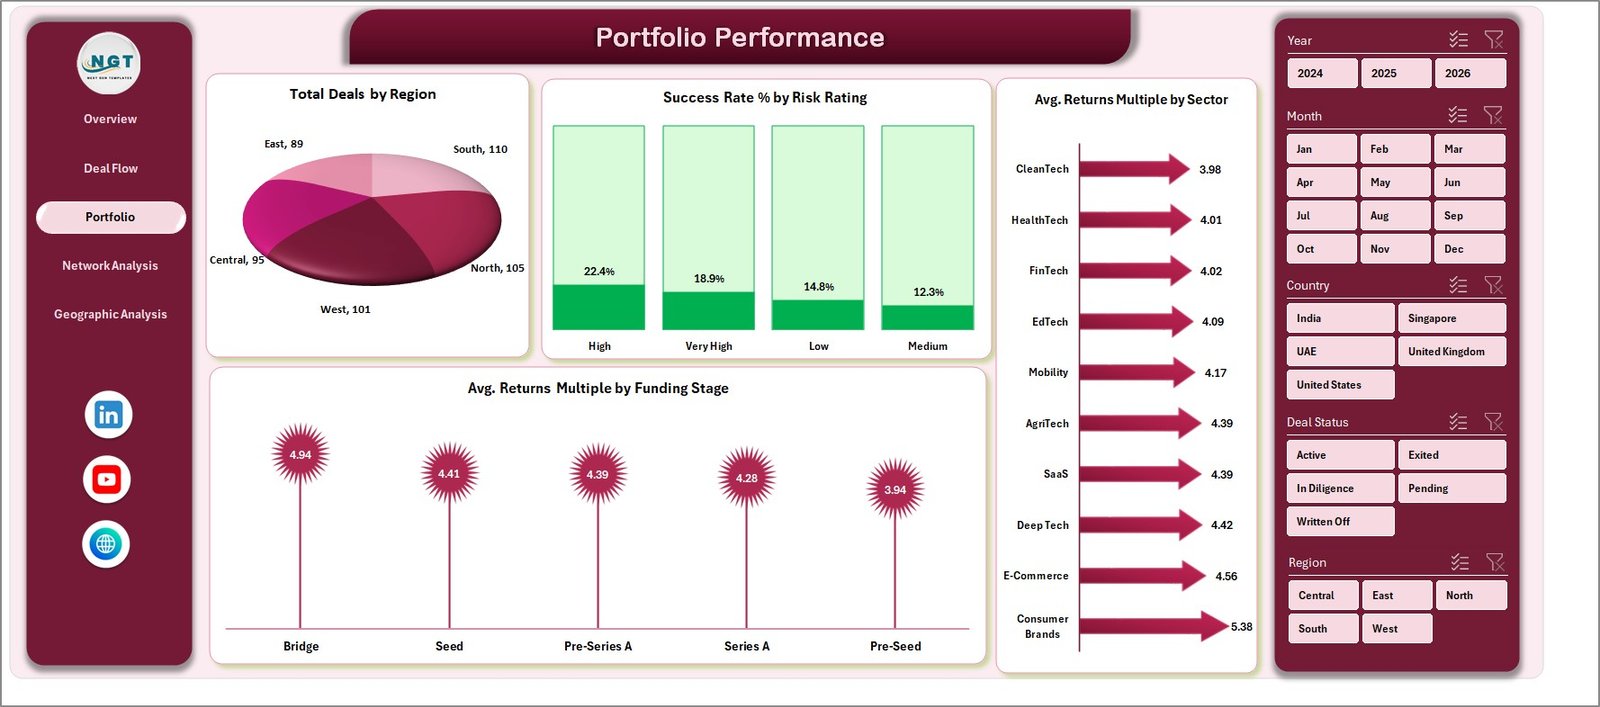
Business Angel Networks Dashboard in Excel — Portfolio Performance Page
4 — Network Analysis Page
Network Analysis examines the composition and dynamics of your investor community. Total Investment by Deal Status shows how much capital is deployed vs. exited vs. written off. Total Investment by Investor Type and Avg. Equity Stake % by Investor Type reveal how different investor categories (individual angels, syndicates, family offices, corporate investors) participate and what equity positions they typically take. Total Mentorship Hours by Angel Network is a unique KPI that quantifies the non-financial contribution of your network — increasingly important for demonstrating program value to LPs, universities, and government-backed ecosystem programs.
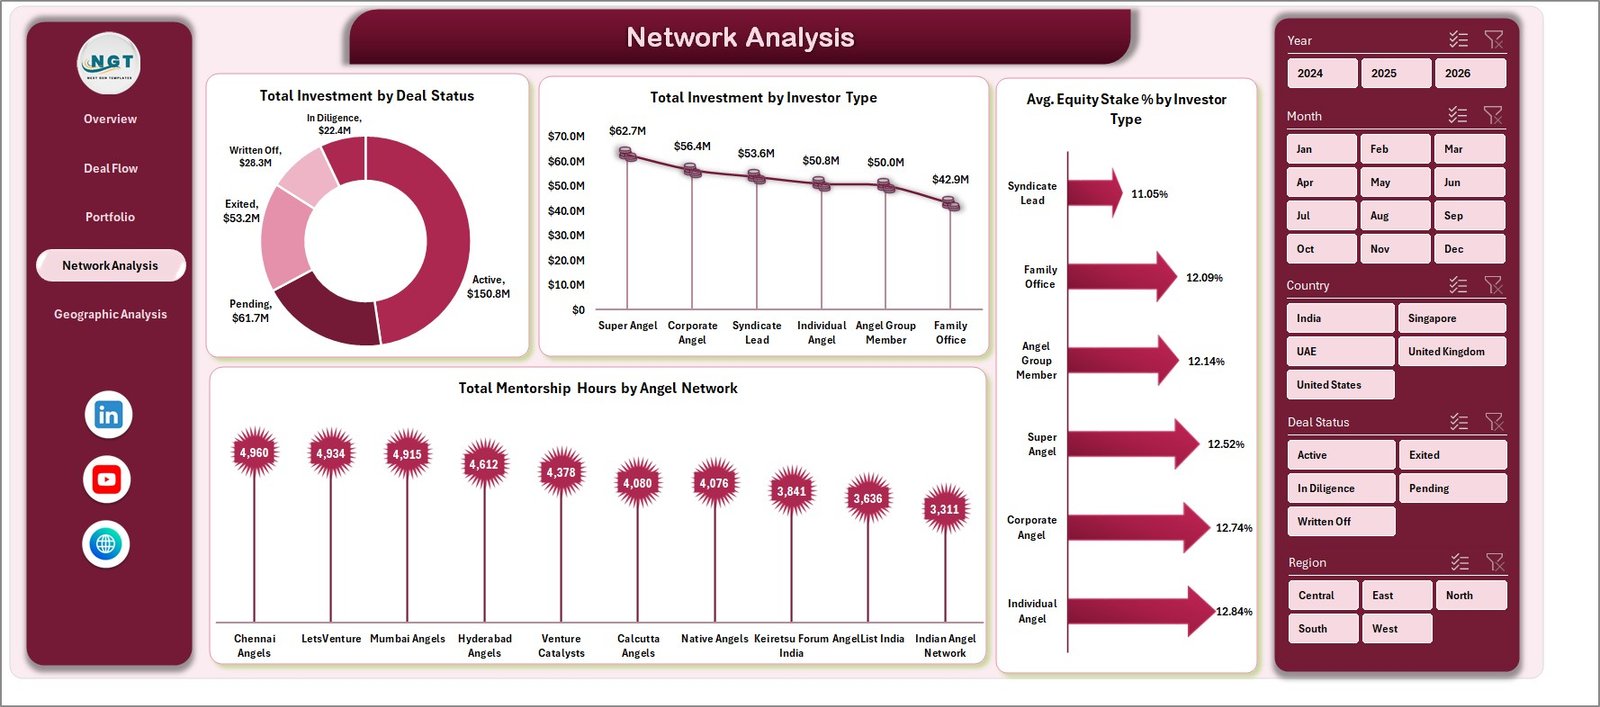
Business Angel Networks Dashboard in Excel — Network Analysis Page
5 — Geographic Analysis Page
Geographic Analysis maps your capital deployment across regions and countries. Total Investment by Region and Total Investment by Country provide a global view of where your network’s money is going. Total Investment by Risk Rating at a geographic level shows whether certain regions carry systematically higher or lower risk profiles. Avg. Returns Multiple by Region is the most actionable chart on this page — it identifies which geographies are generating the best returns, giving you a data-backed rationale for geographic focus in your next fund cycle.
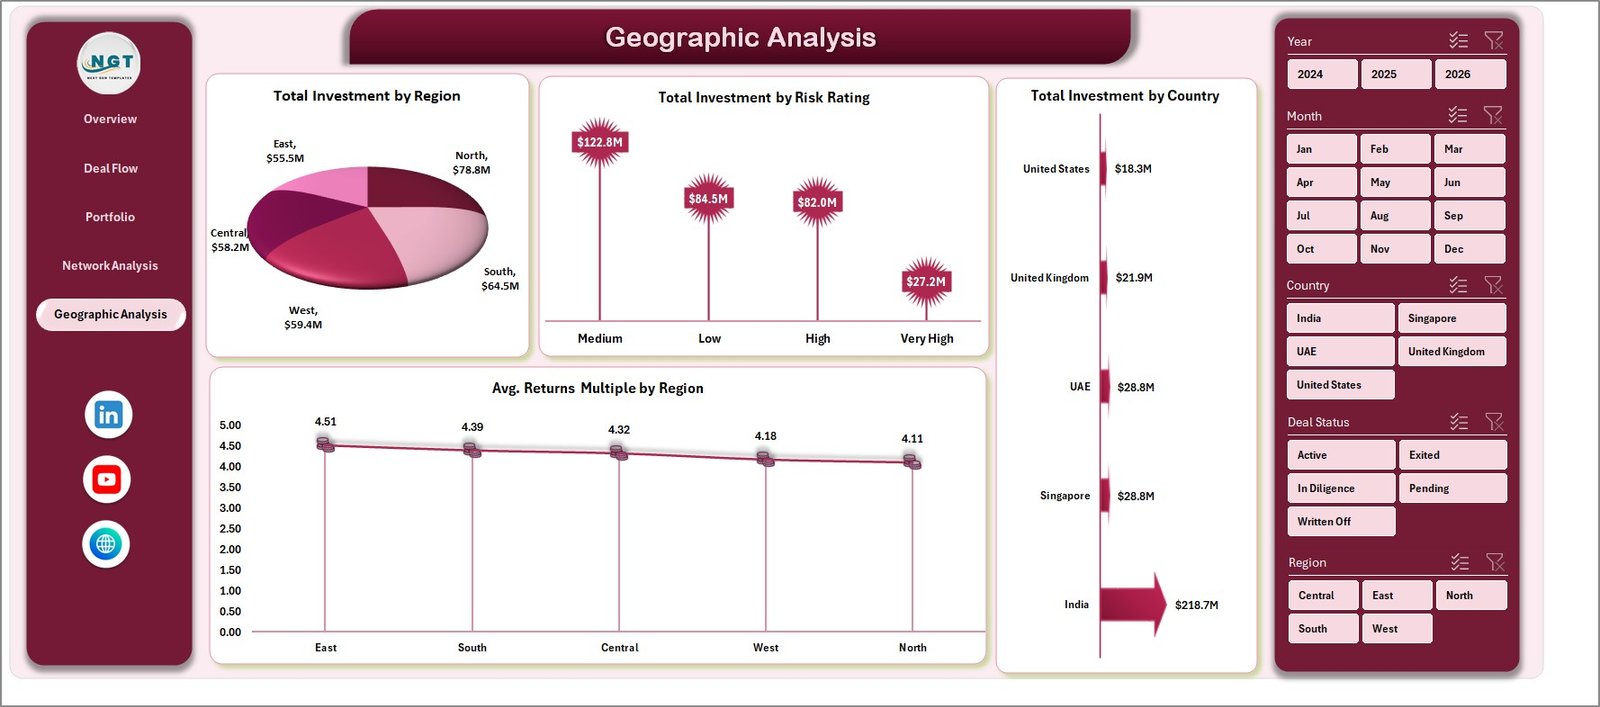
Business Angel Networks Dashboard in Excel — Geographic Analysis Page
6 — Data Sheet Tab
The Data Sheet is the single source of truth for the entire dashboard. Every deal record is entered here in a structured column format. The columns cover all the dimensions analyzed across the five pages: Deal Name, Company Name, Sector, Industry, Region, Country, Funding Stage, Investor Type, Angel Network, Deal Status, Investment Amount, Post-Money Valuation, Returns Multiple, Equity Stake %, Risk Rating, and Mentorship Hours. Add new rows as you close new deals, then click Refresh All and the dashboard updates instantly across all five pages.

Business Angel Networks Dashboard in Excel — Data Sheet Tab
7 — Support Sheet Tab
The Support Sheet contains all the pivot tables that power the dashboard charts. You never need to manually touch this sheet — it updates automatically when you click Refresh All on the Data tab in the Excel Ribbon after updating your deal data. If you add new custom columns to the Data Sheet, you can open the Support Sheet to extend the relevant pivot tables to include the new fields. For day-to-day use, keep this sheet hidden to maintain a clean, professional dashboard presentation.
Business Angel Networks Dashboard in Excel — Support Sheet Tab
Business Angel Networks Dashboard in Excel vs. Google Sheets vs. AngelList / Paid VC SaaS — Feature Comparison
| Feature | Business Angel Networks Dashboard in Excel | Google Sheets Version | AngelList / Carta / Paid VC SaaS |
|---|---|---|---|
| Cost | $17.99 one-time | ~$17.99 one-time | $500–$2,000+/year |
| Platform | Microsoft Excel (offline) | Google Sheets (cloud) | Web-based SaaS |
| Setup time | Under 10 minutes | Under 10 minutes | Days to weeks |
| Works offline | ✅ Fully offline | ❌ Requires internet | ❌ Requires internet |
| Customizable fields | ✅ Fully editable | ✅ Editable | ⚠️ Limited / locked |
| Slicer-based filtering | ✅ Yes | ✅ Yes | ✅ Yes (paid) |
| No per-user fees | ✅ One file, unlimited users | ✅ Share freely | ❌ Per-seat pricing |
| Year-1 cost for 5 users | $17.99 total | $17.99 total | $2,500–$10,000+ |
| Angel-network-specific KPIs | ✅ Built-in (Mentorship Hours, Exit Rate, Returns Multiple) | ✅ Built-in | ⚠️ Generic or VC-focused |
For angel networks that want professional-grade deal flow and portfolio analytics without paying enterprise SaaS prices, the Business Angel Networks Dashboard in Excel sits in the sweet spot.
Who Should Use This Template
✅ Perfect for:
- Angel investors and angel network managers tracking 10–200+ active deals in Microsoft Excel
- Family offices with early-stage startup allocations who need offline-capable reporting
- Startup ecosystem program managers monitoring cohort performance and mentor engagement hours
- Finance teams at accelerators and incubators needing investor-grade portfolio reports for board meetings
- Independent angels who want multi-dimensional analytics without committing to annual SaaS subscriptions
❌ Not a fit if:
- You need LP portal integration, SOC 2 compliance, or ILPA-format reporting (consider Allvue or Carta instead)
- Your team needs live multi-party cap table management with real-time concurrent edits
- You don’t have Microsoft Excel 2016 or later installed on your device
Real-World Use Cases
Priya manages a 40-member angel syndicate in Singapore. Each quarter, she uses the Business Angel Networks Dashboard in Excel to prepare a deal flow report for her LP advisory board — showing which sectors captured the most capital, how success rates vary by funding stage, and where geographic concentration risk is building. What used to take 3 days of manual data consolidation now takes 30 minutes. The Overview slicers let her filter to any specific network or region mid-presentation without switching to a different report.
Marcus runs a university angel network with 25 active portfolio companies. He tracks mentorship hours by angel network and monitors returns multiples across cohorts using the Portfolio Performance and Network Analysis pages. The Total Mentorship Hours by Angel Network chart is his secret weapon for demonstrating program ROI to university administrators. Last semester, the data helped him recruit 12 new mentor angels by showing measurable outcomes from the program’s engagement model.
Sarah is an independent angel investor with 18 deals across 6 sectors. She uses the Geographic Analysis page to spot that 70% of her capital is concentrated in North America, and the Portfolio Performance page to identify that seed-stage fintech deals are delivering her highest Returns Multiples. These insights shaped her next investment thesis — more geographic diversification into Southeast Asia, more fintech at seed. All of this analysis cost her $17.99 and 15 minutes of setup, not $1,200/year for a SaaS portfolio tracker.
Advantages of the Business Angel Networks Dashboard in Excel
- No recurring cost — one-time purchase, no subscription renewal, no per-seat pricing. For a 5-person angel network team, you save $2,500–$10,000 compared to typical SaaS alternatives over 3 years.
- Works offline — angel network data is sensitive. Keeping analytics in a local Excel file means no cloud dependency, no data breach risk from third-party SaaS platforms, and full control over who sees what.
- Customizable without a developer — add columns, rename categories, extend pivot tables to new fields. Any Excel user can adapt the dashboard to their network’s specific deal structure in under an hour.
- Slicer-driven filtering across all pages — apply a Region or Sector filter and every chart on every page responds simultaneously. No need to rebuild reports for different stakeholder views.
- Mentorship tracking built in — unlike generic investment dashboards, this template includes Mentorship Hours as a first-class KPI, enabling angel networks to demonstrate non-financial program value to LPs and institutional sponsors.
Opportunities for Improvement
- No real-time data feeds — like all Excel-based solutions, this dashboard requires manual data entry. If your CRM or deal management platform can export to CSV/Excel, you can paste-refresh, but there’s no live API connection.
- No multi-user concurrent editing — suitable for one primary analyst or a shared file on a network drive, but not designed for real-time collaborative editing across multiple users simultaneously.
- No cap table functionality — this is an analytics and reporting dashboard, not a cap table management tool. For equity ownership tracking and legal document management, you’ll still need a dedicated tool like Carta.
- Pivot table refresh is manual — after adding new data, you need to click Data → Refresh All. This takes seconds but requires a conscious step that fully automated SaaS dashboards handle automatically.
Best Practices
- Keep the Data Sheet clean — use consistent values for category fields (Region, Sector, Funding Stage, etc.) to avoid duplicates in slicer lists. Create a dropdown validation list for these columns to enforce consistency across all team members entering data.
- Refresh immediately after data entry — make it a habit to click Data → Refresh All every time you add or edit deal records. This ensures all 20+ charts and KPI cards are always current.
- Hide the Support Sheet before sharing — go to the Support sheet tab, right-click, and select Hide. This gives your dashboard a clean, professional look for LP presentations and board reviews.
- Back up your data file regularly — since this is a local Excel file, keep a backup copy on cloud storage (OneDrive, Google Drive, or Dropbox) so your deal history is never at risk from hardware failure.
- Use the Geographic Analysis page for quarterly board reports — the Avg. Returns Multiple by Region chart is particularly compelling for investors curious about geographic diversification strategy.
Explore Relevant Templates
- Business Angel Networks Dashboard in Excel — the full analytics dashboard covered in this post
- VC Portfolio Dashboard in Excel — 5-page venture capital analytics covering fund KPIs, sector analysis, stage performance, partner metrics, and regional trends
- Business Angel Networks KPI Dashboard in Excel — the KPI scorecard companion to this dashboard, with traffic-light MTD/YTD indicators for angel network performance
- Investment Banking KPI Dashboard in Excel — deal advisory and M&A performance tracking for investment banking teams
- Browse all Excel Dashboard Templates →
For more information on using Excel pivot tables and slicers for financial analytics, visit Microsoft’s official PivotTable documentation.
Frequently Asked Questions
What is the Business Angel Networks Dashboard in Excel?
The Business Angel Networks Dashboard in Excel is a 5-page analytics template tracking deal flow, portfolio performance, network composition, and geographic spread for angel investors and angel network managers. It includes 5 KPI cards, 20+ pivot-driven charts, and dynamic slicers — all powered by native Excel pivot tables that update with a single Refresh All click.
What KPIs does the Business Angel Networks Dashboard track?
The Business Angel Networks Dashboard in Excel tracks 5 headline KPIs: Total Deals, Total Investment, Total Post-Money Valuation, Avg. Returns Multiple, and Total Mentorship Hours. It also tracks 20+ chart-level metrics including Success Rate %, Exit Rate % by Region, Returns Multiple by Sector and Funding Stage, and Avg. Equity Stake % by Investor Type.
How do I update the dashboard with new deal data?
Open the Data Sheet tab, add new deal rows following the existing column structure, then click Data → Refresh All in the Excel Ribbon. All 20+ charts, KPI cards, and slicers across all 5 analytics pages update simultaneously in seconds. No formula editing or manual chart adjustments are needed.
Does this Excel dashboard require any plugins or macros?
No plugins, macros, or add-ins are required. The Business Angel Networks Dashboard in Excel runs entirely on native Excel pivot tables, pivot charts, and slicers. It is compatible with Microsoft Excel 2016, 2019, 2021, and Microsoft 365 on both Windows and Mac without any additional software.
How does this compare to AngelList or Carta for portfolio analytics?
AngelList and Carta focus on cap table management, equity documents, and LP portals — costing $500–$2,000+/year. The Business Angel Networks Dashboard in Excel focuses on analytics and reporting: deal flow trends, returns analysis, geographic breakdown. It costs $17.99 once, works offline, and requires no per-seat fees. Both tools serve different functions and can be used together.
Can I customize the metrics or add custom fields for my angel network?
Yes. The Data Sheet is a standard Excel table — you can add columns for custom fields specific to your network (co-investor names, board seat status, follow-on round dates, etc.). After adding columns, open the Support Sheet to update the relevant pivot table field lists, then click Refresh All to apply the changes across all charts.
Is this dashboard available for Power BI or Google Sheets?
Yes. The Business Angel Networks Dashboard is also available as a Power BI version and a KPI scorecard version in Excel. Choose the platform that best fits your team’s workflow and reporting environment.
About the Author
Built by PK — Microsoft Certified Professional with 15+ years of Excel, Google Sheets, and Power BI experience. Founder of NextGenTemplates, reaching 300K+ subscribers across YouTube channels. Every template is hand-built and tested before release.
Conclusion
Angel investment analytics doesn’t need to cost thousands per year or require weeks of implementation. The Business Angel Networks Dashboard in Excel gives your network professional-grade deal flow, portfolio performance, and geographic analysis for a one-time investment of $17.99 — no subscriptions, no per-user fees, no cloud dependency.
🛒 Click here to Purchase the Business Angel Networks Dashboard in Excel
✅ Instant download · One-time payment · No subscription · Works in Excel 2016+
🎥 Watch step-by-step tutorials on our YouTube channel: Youtube.com/@PK-AnExcelExpert
📅 Last updated: May 2026